City, University of London Institutional Repository
Citation
:
Wilson, M. H., Edsell, M. E. G., Davagnanam, I., Hirani, S. P., Martin, D. S.,
Levett, D. Z. H., Thornton, J. S., Golay, X., Strycharczuk, L., Newman, S. P., Montgomery, H.
E., Grocott, M. P. W. and Imray, C. H. E. (2011). Cerebral artery dilatation maintains cerebral
oxygenation at extreme altitude and in acute hypoxia-an ultrasound and MRI study. Journal
of Cerebral Blood Flow and Metabolism, 31(10), pp. 2019-2029. doi: 10.1038/jcbfm.2011.81
This is the unspecified version of the paper.
This version of the publication may differ from the final published
version.
Permanent repository link: http://openaccess.city.ac.uk/3381/
Link to published version
:
http://dx.doi.org/10.1038/jcbfm.2011.81
Copyright and reuse:
City Research Online aims to make research
outputs of City, University of London available to a wider audience.
Copyright and Moral Rights remain with the author(s) and/or copyright
holders. URLs from City Research Online may be freely distributed and
linked to.
City Research Online:
http://openaccess.city.ac.uk/
publications@city.ac.uk
Cerebral artery dilatation maintains cerebral
oxygenation at extreme altitude and in acute
hypoxia—an ultrasound and MRI study
Mark H Wilson
1,2, Mark EG Edsell
1,3, Indran Davagnanam
2, Shashivadan P Hirani
4,5,
Dan S Martin
1, Denny ZH Levett
1,6, John S Thornton
2, Xavier Golay
2, Lisa Strycharczuk
2,
Stanton P Newman
4,5, Hugh E Montgomery
1, Mike PW Grocott
1,6and Christopher HE Imray
1,7,
for the Caudwell Xtreme Everest Research Group
11Centre for Altitude, Space and Extreme Environment Medicine, Institute of Human Health and Performance,
Charterhouse Building, UCL Archway Campus, University College London, London, UK;2The National
Hospital for Neurology and Neurosurgery, Queen Square, London, UK; 3St George’s Hospital, Tooting,
London, UK;4Unit of Behavioural Medicine, UCL Division of Research Strategy, University College London,
London, UK; 5School of Community and Health Sciences, City University, London, UK;6Southampton
University Hospital NHS Trust, Southampton, UK;7Department of Surgery, Warwick Medical School,
University Hospitals Coventry and Warwickshire NHS Trust, Coventry, UK
Transcranial Doppler is a widely used noninvasive technique for assessing cerebral artery blood flow. All previous high altitude studies assessing cerebral blood flow (CBF) in the field that have used Doppler to measure arterial blood velocity have assumed vessel diameter to not alter. Here, we report two studies that demonstrate this is not the case. First, we report the highest recorded study of CBF (7,950 m on Everest) and demonstrate that above 5,300 m, middle cerebral artery (MCA) diameter increases (n= 24 at 5,300 m, 14 at 6,400 m, and 5 at 7,950 m). Mean MCA diameter at sea level was 5.30 mm, at 5,300 m was 5.23 mm, at 6,400 m was 6.66 mm, and at 7,950 m was 9.34 mm (P< 0.001 for change between 5,300 and 7,950 m). The dilatation at 7,950 m reversed with oxygen. Second, we confirm this dilatation by demonstrating the same effect (and correlating it with ultrasound) during hypoxia (FiO2= 12% for 3 hours) in a 3-T magnetic resonance imaging study at
sea level (n= 7). From these results, we conclude that it cannot be assumed that cerebral artery diameter is constant, especially during alterations of inspired oxygen partial pressure, and that transcranial 2D ultrasound is a technique that can be used at the bedside or in the remote setting to assess MCA caliber.
Journal of Cerebral Blood Flow & Metabolismadvance online publication, 8 June 2011; doi:10.1038/jcbfm.2011.81
Keywords: brain imaging; cerebral blood flow; high altitude; MRI; transcranial Doppler
Introduction
Normal cerebral function is dependent on an adequate and continuous supply of oxygen. With increasing altitude, barometric pressure falls, and with it the partial pressure of atmospheric and inspired oxygen. Acclimatization to such an environmental hypobaric hypoxic stress involves a number of adaptive processes (including hyper-ventilation and a rise in hematocrit (Ward et al,
2000)), which serve to restore arterial oxygen content toward sea level values. In addition, increased cerebral blood flow (CBF) is believed to be one compensatory mechanism serving to maintain nor-mal oxygen flux to the brain in the face of arterial hypoxemia. Such hypoxemia is common in critically ill patients and is thought to occur locally in ischemic stroke, the third commonest cause of death in the United Kingdom (The National Institute of Neurological Disorders and Stroke rt-PA Stroke Study Group, 1995). A greater understanding of the cerebrovascular response to hypoxia is thus of broad interest, as would be the validation of clinically relevant techniques to assess flow in intracranial vessels.
Transcranial Doppler (TCD) measurement of flow velocity in the middle cerebral artery (MCA) has been used to assess CBF dynamics both at rest and
Received 2 February 2011; revised 22 March 2011; accepted 10 April 2011
Correspondence: Dr MH Wilson, Centre for Altitude, Space and Extreme Environment Medicine, Institute of Human Health and Performance, Charterhouse Building, UCL Archway Campus, University College London, London N19 5LW, UK.
E-mail: mark@medicstravel.com
&2011 ISCBFM All rights reserved 0271-678X/11
during exercise at altitude (Ainslie et al, 2007; Appenzeller et al, 2004; Baumgartner et al, 1994, 1999; Feddersen et al, 2007; Imray et al, 2005; Jansen et al, 2000, 2002; Lysakowski et al, 2004; Norcliffe et al, 2005; Otis et al, 1989; Palma
et al, 2006; Subudhiet al, 2007; Ter Minassianet al, 2001; Van Osta et al, 2005). Assuming cerebral arterial diameter remains constant in the face of sustained hypoxia, investigators have inferred changes in CBF from changes in the velocity of blood in the MCA. This assumption is, however, disputed (Giller, 2003). Further, an opposite (contra-dictory) assumption is made in many clinical situations: in the management of subarachnoid hemorrhage, for example, changes in TCD-derived blood velocity are assumed to represent changes in vessel diameter (vasospasm).
The profound hypoxemia experienced by climbers at extreme altitude ( > 5,500 m) (Grocottet al, 2009) is known to be associated with cerebral dysfunction (Virues-Ortega et al, 2004; Ward et al, 2000), identified in B70% of deaths over 8,000 m on Everest (Firth et al, 2008). Such data suggest that cerebral oxygenation may not be fully maintained through adaptive responses, which may include changes in CBF. However, these blood flow re-sponses remain poorly documented. Indeed, the only studies of CBF using TCD velocity under conditions of comparable hypoxemia have been performed in a hypobaric chamber and vessel diameter was not measured (Ter Minassian et al, 2001).
In the past, the measurement of MCA diameter (MCADiam) has only been possible by direct vision at
surgery (Giller et al, 1993), by use of contrast angiography (Du Boulay and Symon, 1971) or magnetic resonance angiography (MRA)—techniques inappropriate for remote extreme altitude field studies. Transcranial color Doppler power signal has previously been used to indirectly infer MCA crosssectional area in a laboratory setting (Poulin and Robbins, 1996). Under conditions of mild hypobaric hypoxia, no significant change in MCA crosssec-tional area was noted. The recent development of portable ultrasound devices that incorporate both 2D color flow mapping and concurrent pulse wave Doppler ultrasonography permits measurement of both vessel diameter and the velocity of the blood within it. The 2D ultrasound ensures that the same segment of the artery can be reliably visualized and assessed.
We thus aimed to use such ultrasound imaging and Doppler measurements to characterize the contribu-tion of altered vessel diameter to changes in MCA flow (MCAFlow) and calculated oxygen delivery
(MCAOD) seen in response to hypobaric hypoxia. In
addition, a sea level MRA study was performed in normoxia and 12% hypoxia to determine whether acute hypoxia caused MCA vessel dilatation and to explore correlation between TCD and MRA meth-odologies.
Materials and methods
Ethical approval for this study was provided by University College London (Code 0292/015). Written informed con-sent was obtained from all participants.
High Altitude Transcranial Doppler Study
Twenty-four subjects (18 males, mean age: 35.2 years, range: 19 to 59 years) of the Caudwell Xtreme Everest Research Expedition (described with ascent profile elsewhere
(Gro-cott et al, 2010) were studied over 71 days. All subjects
trekked to 5,300 m (group 1, n= 24), of whom 14 subse-quently continued to 6,400 m (group 2) and 5 to 7,950 m (group 3). Each subject was studied between 1 and 3 days after arrival at each altitude. The study day was constant for each subject, the sole exception being at 7,950 m, where all subjects (n= 5) were investigated on the second day after arrival. No caffeine, alcohol, or medication that could affect CBF was consumed before the measurement on the study day. Immediately before each study, subjects rested in a horizontal position for 15 minutes. Climbers were not exposed to any supplemental oxygen until 7,100 m. At 7,950 m, subjects were off supplementary oxygen (2 L/min) for at least 30 minutes before the near infrared spectroscopy (NIRS) and TCD measurements were made. The NIRS and TCD studies were then repeated with the subjects receiving 2 L/min supplemental oxygen via a TopOut rebreath regulator system (Topout Mask Mk 2, Topout Oxygeneering Ltd, Cotgrave, UK) to assess reversibility of the initial measurements. At 7,950 m, the investigating clinician (CHEI) used supplementary oxygen (2 L/min).
Measurements
Blood pressure was recorded (mean of three noninvasive recordings) using an automated cuff (Omron M7, Bannock-burn, IL, USA); arterial oxygen saturation (SaO2) by near infrared finger pulse oximetry probe (Nonin, Onyx Model 9500, Plymouth, MN USA); hemoglobin concentration of whole venous blood by photometry (Hemocue Whole Blood hemoglobin System, Hemocue AB, Angelhoim, Sweden); and resting end tidal CO2 (ETCO2) by infrared capnometer (Cortex Metamax 3b, Leipzig, Germany).
Near infrared spectroscopy: Regional brain oxygen saturation (rSO2) measurements were made immediately before TCD insonation (Invos Cerebral Oximeter 5100C, Somanetics, Troy, MI, USA). The skin was cleaned and probes were placed over the right and left frontal lobes avoiding both the sagittal and frontal sinuses, and leftin situ
during the TCD analysis. Three consecutive readings were taken from each side, from which means were calculated.
Transcranial Doppler: In a supine subject, the right MCA was insonated via the temporal bone window, by one of the two skilled observers, using a 5 to 1 MHz Transducer MicroMaxx (Sonosite, Bothell, WA, USA). The clinoid process of the sphenoid bone, the Circle of Willis, and the distal internal carotid artery were initially identified, and then the M1 segment of the MCA was identified
(characterized by flow toward the transducer). Doppler gain was set in a standard manner (Martinoli and Derchi, 1997). An optimal portion of the MCA without branches and with near laminar flow was then selected and the depth recorded. Once identified, the center of the artery was insonated and MCA blood velocity (MCAVel), peak systolic velocity, end diastolic velocity, pulsatility index (the difference between peak systolic and minimum diastolic flow velocities divided by the mean flow velocity; which in certain circumstances reflects intracranial pressure), and resistivity index (the difference between peak systolic and minimum diastolic flow velocities divided by the peak systolic velocity) were calculated by the inbuilt software (Figure 1A). On subsequent studies, every effort was made to insonate the same depth (to within 1 mm). After 3 to 5 minutes of insonation, the 2D image movie sequence was saved, and the frame with the maximum vessel diameter (systole) studied. Using the on-screen caliper tool, the width of the vessel at the point of insonation was measured and recorded (Figure 1B). The angle of insonation was constant for each individual, since the position of the probe on the temporal bone window and the position on the interrogated section of the MCA were fixed.
Sea Level Hypoxic Magnetic Resonance Imaging Study
Seven subjects (5 males; mean age: 34.4 years, range: 22 to 48 years) were recruited from the Caudwell Xtreme Everest investigators. None had ascended above 1,000 m in the preceding 6 months. Physiological, TCD, and NIRS measurement techniques were identical to the field study
and performed in normoxia, at 90 and 180 minutes of hypoxia. All TCD measurements were performed three times by both investigators.
Hypoxia: After baseline measurements, subjects were subjected to 3 hours of normobaric hypoxia (FiO2= 12%; approximately equivalent to an altitude of 4,400 m), using a tight fitting mask and hypoxicator (Everest Summit Hypoxic Generator, Hypoxic Systems, New York, NY, USA). Inspired oxygen concentration was regularly checked (Class R-17D Oxygen Sensor, Oxycheq, Marianna, FL, USA). Extended magnetic resonance imaging (MRI)-compatible tubing enabled the subjects to remain hypoxic during the MRI and TCD studies at 3 hours.
Magnetic Resonance Imaging: A 3-T MRI (TIM Trio, Siemens AG, Eriangen, Germany) was performed at baseline and at 3 hours of hypoxia. At both time points 3D time of flight MRA was performed (repetition time (TR) = 8.6 milli-seconds; echo time (TE) = 4 milliseconds; flip angle (FA) = 201; three acquisition slabs; matrix 25625615;
voxel dimensions 1.21.07.0 mm3), principally to permit estimation of MCADiam. To measure MCA blood flow velocity, a single-slice 2D electrocardiogram-triggered seg-mented phase-contrast acquisition (TR = 30.3 milliseconds; TE = 5.5 milliseconds; FA = 301; matrix 384384; voxel
[image:4.595.59.535.432.705.2]dimensions 0.50.56.0 mm3) was performed with through-plane flow sensitization with velocity-encoding factor of 150 cm/s. An 800-milliseconds electrocardio-gram-synchronized acquisition window was sampled with 25 phases proving velocity sensitive images with an effective temporal resolution of 32 milliseconds.
Figure 1 Ultrasound images demonstrating (A) velocity/ratio and (B) vessel diameter measurement and (C) composite of four magnetic resonance imaging (MRI) images, demonstrating middle cerebral artery (MCA) multiplanar reconstruction and analysis.
MH Wilsonet al
A consistent section of the right proximal MCA (B1 cm from the bifurcation to correspond to the TCD area of investigation) was studied to provide estimates of blood velocity, the imaging plane being prescribed orthogonally to the main axis of the MCA.
To estimate MCADiam, time of flight MRA data were postprocessed using the maximum intensity projection function on a calibrated Siemens Leonardo workstation (Siemens AG). An independent consultant neuroradiolo-gist, blinded to the pre- or post-hypoxia-induced status of the subjects, assessed the maximum and minimum diameters, the circumference and crosssectional area of both MCAs on two data sets in all subjects. A semiauto-mated vessel tracing technique utilizing the In-Space vessel analysis program (Syngo MMWP Software, version VE36A with service pack SP03, Siemens, Munich, Germany) was performed to analyze the length of MCA on the postprocessed 3D rendered maximum intensity projection images. This was performed by manually entering two data points; proximally at the A1/M1 bifurcation of the terminal internal carotid artery and distally at the distal M1 segment of the MCA at the bi/ trifurcation. Multiplanar views of the segmented length for analysis of the M1 segment were then automatically generated by the program, which included a true cross-sectional view (Figure 1C). This automatically generated length of the M1 segment of the MCA was then divided equally into five data points, these data points were replicated and were therefore consistent in both the studies (pre- and post-hypoxia) for the respective lateralized M1 segment. The window width and level were standardized on the true crosssectional display panel at 200:100. A semiautomated calculation of the crosssectional area and circumference was performed by the program using a ‘best-fit’ algorithm with minimal refinement of the threshold levels and individual plotted data points. The maximum and minimum diameters were also determined at the same data point. This process was repeated at all five data points for each side (left and right M1 segments) in pre- and post-hypoxia-induced studies in all patients. Similar vessel analysis techniques have been previously utilized by other researchers to interrogate time of flight MRA acquisitions (Beckmann, 2000; Besselmannet al, 2001; Choyet al, 2006; Reeseet al, 1999).
Middle cerebral artery flow velocities were obtained from the phase-contrast imaging data also using software provided by Siemens (Argus Flow tool, Siemens, Munich, Germany). The extent of the MCA margins were deter-mined by manually defining an enclosing region of interest, which was adjusted for each phase to account for changes through the cardiac cycle. The software then automatically determined the average flow velocity for each subject.
Flow and oxygen delivery calculations: Blood oxygen content was calculated using the formula: Blood oxygen content = 1.36HbSaO2/100. The small quantity of dissolved oxygen (decreasing further at altitude) was not included in the estimation.
Middle cerebral artery blood flow was calculated using the formula: Flow =p(MCAdiam/2)2MCAvel. This estimation
does not take account of vessel wall resistance or changes due to any turbulent flow. Oxygen delivery was calculated as the product of blood flow and oxygen content.
Statistics
High altitude study: For each measure, differences in scores between altitudes were examined using the linear mixed models procedure in SPSS version 18 (IBM, NY, USA) to maximize the utilization of the data collected. The method of restricted maximum likelihood was used to estimate model parameters, and variance/covariance struc-tures were modeled as heterogeneous Toeplitz. Pairwise comparisons within each analysis were conducted using estimated marginal means using Sidak’s adjustment to compensate for multiple comparisons. For all tests, significance was set to < 0.05.
Sea level hypoxic magnetic resonance imaging study: Differences were again examined using the linear mixed models procedure in SPSS for consistency. The same means and the same variables were found to reach significance when checked with general linear models. Relationships between variables were examined using Pearson’s correlation. Correlations were considered sig-nificant whenP< 0.05. The coefficient of determination (r2) is also reported as an indicator of the correlation effect size. Interrater reproducibility for the MRI/TCD ratings was examined using intraclass correlations (averaged mea-sures) to examine the agreement between raters over the range of measures taken at different time points.
Results
High Altitude Transcranial Doppler Study
There were no technical problems encountered with the TCD and NIRS devices. Data were not available on one subject at 3,500 m (nonaltitude-related gastro-intestinal disturbance) and one subject at 5,300 m (severe acute mountain sickness). These missing data were accounted for as part of the multilevel modeling technique. Subject characteristics and basic physio-logical variables for the different groups at each altitude are presented in Table 1.
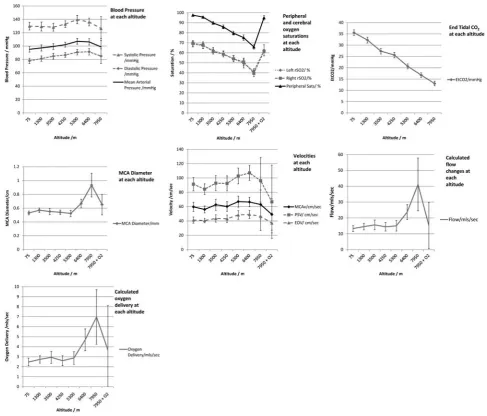
Table 2 summarizes the means of measured variables, the confidence intervals, and the signifi-cance of changes with increasing altitude.
Regional cerebral oxygenation (rSO2) values
(de-rived from NIRS), peripheral saturations (SaO2), and
EtCO2 decreased with each increase in altitude
(P< 0.05). MCAvel did not change at any altitude.
The MCADiam remained constant until extreme
alti-tude (6,400 and 7,950 m), where a marked increase was observed (5.3 mm at sea level, 6.66 mm at 6,400, and 9.34 mm at 7,950 m;P< 0.002)).
Similarly, calculated MCAFlow and MCAOD
mark-edly increased at 6,400 m and above (MCAFlow from
13.3 mL/s at sea level to 23.7 mL/s and 6,400 and 41.2 mL/s at 7,950; oxygen delivery from 2.5 mL/s at
T able 1 Barometric and subject characteristics plus basic physiological variables with estimated marginal means, significance of change, and confidence inter vals (CIs) using multilevel modeling 75 m 1 ,3 00 m 3 ,500 m 4 ,250 m 5 ,300 m 6 ,4 00 m 7 ,950 m 7 ,950 m+2 L Oxygen Sig Barometric pressure/kPa 100.5 86.7 67.3 61.5 53.8 46.7 38.9 — PiO 2 /kPa 19. 7 16.8 12.7 11.6 9 .9 8.5 6 .8 — Systolic BP (mm Hg) (CI) 129.85 a,b (124.21–135. 50) 129.25 a,b (122.66–135.84) 128.32 a(122.42– 134.21) 132. 89 a,b (127.90–137.88) 139.72 b (133.45–145.99) 136.03 a,b (130.18– 141.88) 126.33 a,b (108.52– 133.14) — 0 .047 Diastolic BP (mm Hg) (CI) 77. 85 a(73.86–81.8 4 ) 81. 25 a,c (77.22–85.29) 84.94 a,b,c (80.52–8 9.36) 86. 68 b,c (83.14–90.2 3 ) 90.90 b (86.81–95.0 0 ) 91.48 b (86. 67–96.29) 84.96 a,b,c (74.08–9 5.83) — < 0.01 Mean BP (mm Hg) (CI) 95.18 (91.10–99.2 6 ) 97.25 (92.62–101.88) 99.40 (95.09–1 03.70) 102.08 (98.36–105. 80) 107.17 (102.74–111.61) 106.29 (101.56– 111.02) 98. 76 (85.96–1 11.56) — 0 .003 Peripheral Sats (%) (CI) 97. 63 a(97.24–98.0 2 ) 95.67 b(95.01–96.32) 89.75 c(88.39–9 1.11) 85. 88 d(84.01–87.7 4 ) 79. 63 e(77.68–81.6 0 ) 75.13 e(72. 35–77.91) 65.90 f(63.74–6 8.07) 95.03 a,b (92.78–9 7.27) < 0 .001 End tidal CO 2 (kPa) (CI) 4.74 a(4.56–4.91) 4.30 b(4.13–4.48) 3.65 c(3.48–3.81) 3.4 2 d(3.26–3.58) 2.75 e(2.61–2.89) 2.23 f(2. 10–2.37) 1.7 3 g (1.60–1.87) — < 0.001 Hemoglobi n (mg/dL) (CI) 13.97 (13.61–14.3 4 ) 14.53 (14.20–14.87) 15.43 (14.97–1 5.89) 15.52 (15.11–15.9 3 ) 17.63 (17.00–18.2 7 ) 19.09 (17. 96–20.2 3) 18. 83 (18.17–1 9.49) — < 0.001 BP , blood pressure. Note: altitudes with the same superscript letter do not differ significantly (i.e., they belong to a homogenous subset). Table 2 Estimated marginal means, significance of change, and CIs for each variable using multilevel modeling 75 m 1 ,300 m 3 ,500 m 4 ,250 m 5 ,300 m 6 ,400 m 7 ,950 m 7 ,950 m+ 2 L Oxygen S ig Left rSO 2 (%) (CI) 68.77 a(65.91–71.63) 66.00 a(64.30–69 .70) 62.62 b(59.87–65.37) 5 8 .94 c(55.89 –61.99) 54.16 c,d (51.07–5 7.25) 49.27 d(44.84–53.7 0 ) 41.95 e(39.76–44.15) 62.5 7 a,b,c,e (57.02–68.12) < 0 .00 1 Right rSO 2 (%) (CI) 69.47 a(66.74–72.20) 67.75 a(64.57–70 .93) 61.36 b(58.88–63.84) 58.5 7 b,c (55.90 –61.24) 53.98 c,d (51.11–5 6.85) 50.95 d(47.23–54.6 7 ) 39.55 e(36.14–42.96) 61.75 b(61.42–62.08) < 0 .00 1 Oxyge n content (mLs/1 00 mLs) (CI) 18.55 a,b (18.08–19.02) 18.91 a(18.44–19 .38) 18.83 a(18.25–19.41) 18.1 2 a,b (17.54 –18.70) 19.02 a(18.16–1 9.89) 19.29 a(17.70–20.8 7 ) 16.81 b(15.87–17.76) 24.27 c(23.18–25.37) < 0 .00 1 MCA v (cm/s) (CI) 5 9 .66 (53.25–66.07) 56.08 (51.32–60 .84) 62.63 (54.89–70.38) 60.14 (53.22 –67.07) 66.97 (59.17–7 4.76) 66.42 (59.78–73.0 6 ) 62.92 (42.73–83.11) 49 .03 (27.17–70.88) 0.16 3 PSV (cm/s) (CI) 91 .32 (82.12–100.51) 84.34 (76.89–91 .80) 91.73 (82.21–103.24) 92.39 (81.81 –102.96) 102.75 (91.74–1 13.75) 107.10 (96.71–117 .48 ) 96.15 (63.46–128.84) 66 .70 (15.68–117.73) 0.11 6 EDV (cm /s) (CI) 41 .25 (36.96–45.55) 40.55 (37.42–43 .67) 43.48 (38.34–48.61) 42.98 (37.62 –48.35) 48.38 (42.37–5 4.39) 49.10 (43.45–54.7 5 ) 46.42 (26.56–66.28) 37 .09 (23.25–50.93) 0.16 7 Pulsitili ty index (CI) 0 .85 (0.79–0.90) 0.81 (0.76–0.86 ) 0 .78 (0.71–0.84) 0.82 (0.72– 0.92) 0.82 (0.75–0.89 ) 0 .87 (0.87–0.97) 0.83 (0.45–1.2) 0 .7 1 (0.50–0.91) 0.21 3 Resistivit y index 0 .54 (0.51–0.57) 0.54 (0.52–0.56 ) 0 .52 (0.49–0.55) 0.53 (0.50– 0.56) 0.53 (0.50–0.56 ) 0 .54 (0.50–0.57) 0.52 (0.41–0.64) 0 .47 (0 .37–0.57) 0.41 0 MCA diameter (mm) 5.30 a(5.01–5.59) 5.70 a,b (5.38–6.02 ) 5 .51 a,c (5.05–5.97) 5.40 a(5.07– 5.73) 5.23 a(4.78–5.68 ) 6 .66 b,c,d (6.03–7.30) 9.34 b,e (7.62–11.06) 6.0 a,d,e (5.03–8.02) 0.00 3 MCA flow (mL/s) 13.30 a(11.38–15.21) 14.54 a(12.46–16 .61) 15.62 a,b (12.53–18.71) 1 4 .42 a(11.75 –17.09) 15.04 a,b (11.74–1 8.34) 23.68 b(18.93–28.4 3 ) 41.16 a,b (24.51–57.82) 15.27 a,b (0.64–29.89) 0.02 6 Oxyge n delivery (m L /s) 2 .47 a(2.10–2.85) 2.74 a,b (2.36–3.11 ) 2 .94 a,b (2.34–3.55) 2.61 a(2.12– 3.10) 2.87 a,b (2.25–3.50 ) 4 .69 b(3.61–5.78) 6.98 a,b (4.25–9.70) 3.68 a,b ( 0.75–8.11) 0.10 1 CI, confidence inter val; EDV , end diastolic velocity ; MCA, middle cerebral arter y. Note: altitudes with the same superscript letter do not differ significantly (i.e., they belong to a h omogenous subset).
MH Wilsonet al
[image:6.595.353.498.72.741.2]sea level to 4.7 mL/s at 6,400 and 7.0 mL/s at 7,950m;
P< 0.01 for all). Figure 2 demonstrates these changes in graphical format.
Sea Level Hypoxic Magnetic Resonance Imaging Study
All seven subjects completed 3 hours of hypoxia and underwent the complete study. Because of technical difficulties, one observer was unable to adequately measure the MCA values utilizing TCD in one subject in normoxia. This data set was otherwise complete.
Tables 3 displays the changes in mean blood pressure, pulse, SO2, rSO2, ETCO2, oxygen content, ultrasound
and MRA-measured vessel diameters, and blood velo-city and calculated blood flow and oxygen delivery. Middle cerebral artery diameter increased after 3 hours exposure to 12% hypoxia, when measured
using ultrasound or MRI (TCD: 5.44 to 6.28 mm; MRI: 3.04 to 3.27 mm; P= < 0.05 for both). Cerebral blood velocity did not significantly increase when assessed with either method (TCD: 65.2 to 71.6 cm/s; MRI: 32.8 to 38.8 cm/s;P= 0.13).
Cerebral blood flow, calculated with either meth-odology, increased (TCD: 14.8 to 21.9 mL/s; MRI: 2.3 to 3.2 mL/s;P< 0.01).
Calculated oxygen delivery was maintained whether measured using ultrasound or MRI.
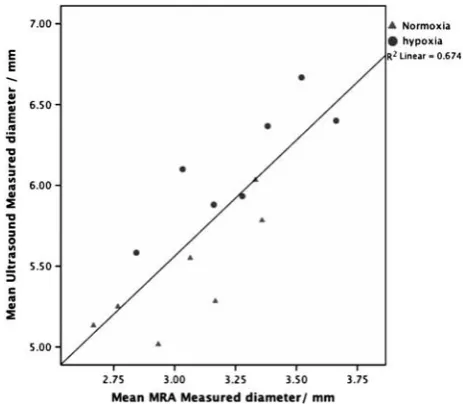
Correlation of Transcranial Doppler and Magnetic Resonance Imaging
[image:7.595.52.540.64.480.2]Transcranial Doppler and MRI-measured vessel diameters correlate (r= 0.82 (Pearson’s), r2= 0.67
Figure 2 Composite of seven graphs, demonstrating changes in blood pressure, arterial oxygen saturation (SaO2), regional cerebral
oxygenation (rSO2), end tidal CO2(ETCO2), peak systolic, end diastolic and mean velocities, middle cerebral artery (MCA) diameter
(MCADiam), calculated MCA flow (MCAFlow), and oxygen delivery (note: blood pressure and EtCO2were not reassessed after oxygen
administration at 7,950 m).
(Figure 3)). However, although there was a strong correlation, the actual values of diameter appeared to have a sizeable, though constant, difference between TCD and MRI, for example, normoxia TCD-measured MCADiam= 5.44 mm; normoxia MRA-measured MCA-Diam= 3.04 mm. This difference creates marked
differ-ences in calculated flow and oxygen delivery since the square of the radius has a large contribution to these calculation (see Discussion).
The interclass correlation between the two TCD observers was 0.76.
Discussion
This is the first field study to assess cerebral perfusion over 5,500 m. The technical advance demonstrated in this study is that transcranial ultrasound can be used to measure changes in cerebral vessel diameters and the changes detected using such a technique correlate with MRI measure-ments. We have shown, for the first time, that exposure to hypoxia is associated with an increase in MCADiam and that this is a consistent finding in
both normobaric and hypobaric hypoxia. Thus, the measurement of velocity alone is likely to be unreliable in evaluating MCA blood flow. In accli-matized subjects ascending to extreme altitude, the vessel caliber change appears to be of greater importance to increasing flow than changes in the velocity of the blood within it. Oxygen supplementa-tion at 7,950 m rapidly reversed the observed MCA vessel dilatation. Such vessel dilatation and its rapid reversal through administration of supplemental oxygen have not previously been described, and challenge currently accepted concepts relating to adaptive mechanisms.
The main strength of this study is that two differing techniques (MRA and ultrasound) have demonstrated that MCADiam increases with hypoxia
[image:8.595.54.545.99.266.2]and that these techniques are well correlated. We have demonstrated the same phenomenon in normo-baric and hyponormo-baric hypoxia and that our findings are reversed with supplemental oxygen at 7,950 m. However, our studies do have inherent weaknesses, which relate to subject selection, technical and logistical limitations. First, subjects were all experi-enced high altitude climbers, whose physiological responses may, in some way, have been ‘selected for.’
Table 3 Estimated marginal means,Fvalues, and CIs of heart rate, blood pressure, peripheral and regional brain saturations, end tidal CO2, calculated oxygen content, transcranial doppler, MRA-measured velocities and ultrasound and MRI-measured diameters,
calculated flows, and calculated oxygen delivery
Normoxia 90 minutes Hypoxia 180 minutes Hypoxia Sig
Pulse (beats/min) (CI) 58.00 (46.99–69.01) 62.71 (53.39–72.04) 64.14 (55.03–73.26) 0.27 Systolic BP (mm Hg) 115.90 (109.32–122.40) 113.86 (105.36–122.36) 114.71 (97.13–132.30) 0.67 Diastolic BP (mm Hg) 68.00 (58.95–77.05) 62.86 (59.30–66.42) 66.57 (55.54–77.61) 0.167 SaO2(%) 98.29a(96.06–100.51) 76.00b(67.66–84.34) 74.86b(67.55–82.16) < 0.001
rSO2(mean R&L) (%) 71.10a(63.58–78.61) 50.47b(45.92–55.03) 50.33b(44.62–56.04) < 0.001
End tidal CO2(kPa) 5.23a(4.43–6.03) 2.64b(1.95–3.33) 2.63b(1.97–3.30) < 0.001
Oxygen content (mL per 100 mLs) 18.78a(17.84–19.71) 14.57b(12.51–16.63) 14.34b(12.53–16.15) 0.001
TCD-measured MCAv (cm/s) 65.23a(48.36–82.10) 74.29b(55.60–92.98) 71.60a,b(51.51–91.68) 0.004
MRA-measured MCAv (cm/s)y 32.80 (21.61–43.99) — 38.75 (27.25–50.35) 0.006 TCD-measured diameter (mm) 5.44a(5.17–5.70) 6.23b(5.67–6.78) 6.28a,b(5.61–6.95) 0.021
MRA-measured diameter (mean R&L) (mm)y
3.04a(2.79–3.29) — 3.27b(3.01–3.53) 0.006
TCD calculated flow (mL/s) 14.83a(12.34–17.31) 22.07b(18.31–25.84) 21.87b(15.90–27.84) 0.002
MRA calculated flow (mL/s)y
2.33a(16.54–29.98) — 3.23b(22.75–41.76) 0.013
TCD calculated O2delivery (mLsO2/s) 2.77 (2.38–3.15) 3.18 (2.63–3.74) 3.15 (2.15–4.14) 0.184
MRA Calculated O2delivery (mLsO2/s) y
0.44 (0.32–0.55) — 0.45 (0.32–0.59) 0.586
BP, blood pressure; CI, confidence interval; MCA, middle cerebral artery; MRA, magnetic resonance angiography; MRI, magnetic resonance imaging; TCD, Transcranial Doppler.
y
No MRI studies done at 90 minutes of hypoxia.
Note: altitudes with the same superscript letter do not differ significantly (i.e., they belong to a homogenous subset).
Figure 3 A graph demonstrating the correlation between transcranial Doppler (TCD) and magnetic resonance imaging (MRI) measurements of middle cerebral artery (MCA) diameter.
MH Wilsonet al
[image:8.595.53.285.340.542.2]Many were young (which may account for some of the differences in MCADiam compared with
angiographic/cadaver studies—see below). Thus, these findings require confirmation in those of different ages, sex, and ethnic group as well as in nonmountaineers.
Second, combining assessments of vessel anatomy (from color mapping) and flow velocity (from pulse wave Doppler) allows vessel flow to be estimated. Such calculations do, however, assume frictionless laminar flow. Further, only maximal MCADiam is
used. True measures of flow would thus have to integrate flow velocity with changes in vessel diameter across the cardiac cycle. Caution should thus be applied when interpreting absolute values. However, we are confident about the observed trends and relative changes. In support, the marked in-creases in vessel diameter observed at extreme altitude (7,950 m) were rapidly reversed with supple-mental oxygen. Further, in the high altitude study, the ascent profile of 17 days to 5,300 m was relatively gentle and all subjects were partly acclimatized when studied, having been at the study altitude for 1 to 3 days. The lack of increase in MCAVel we
observed is thus consistent with other studies of MCA velocity measured 24 to 72 hours after arrival at altitude (Ainslie et al, 2008; Brugniaux et al, 2007; Chanet al, 2005; Van Ostaet al, 2005). There was no change in MCADiam up to 5,300 m, suggesting
repeated measurements of MCADiam using this
tech-nique are reliable and repeatable.
Third, the measurements at 7,950 m demonstrating the largest increase in MCADiam were performed
within 36 to 48 hours of arrival, and all subjects had used supplementary oxygen to climb from 7,100 to 7,950 m. It may be that these larger observed changes were a more acute effect. Further studies during exercise and with acute exposure,
both of which may accentuate the changes, are advocated.
Although changes in relative measurements of ultrasound and MRA-measured MCADiam correlated
well, actual values were significantly different (e.g., TCD diameter measurements in normoxia and hypoxia were 5.44 and 6.28 mm, while correspond-ing MRA diameter measurements were 3.04 and 3.27 mm). Such disparity has been previously re-ported, ultrasound (both color Doppler as we used and Power Doppler) yielding larger diameter mea-surements than MRI (Table 4). Since our ultrasound and MRA measurements correlate well, this implies that although the ultrasound-measured diameter may not be a true diameter, it reliably reflects changes in diameter. It may be that the plane of the ultrasound, although consistent, is not truly tangential to the vessel and hence the crosssectional area may be more eliptiform.
Our data imply that rSO2decreases in the face of
increased oxygen delivery at 7,950 m. An increased delivery of deoxygenated blood would, however, not be expected to result in an increase in regional oxygen saturation. rSO2 measures the ratio of
oxygenated to deoxygenated blood in the interro-gated region and does not reflect the flux of blood (or flux of oxygen) passing through. In addition, many other factors (such as alterations in the contribution of arterial and venous compartments due to changes in intravessel volume) will affect rSO2 (Wolff et al,
2007).
[image:9.595.49.547.527.710.2]There have not been many studies validating TCD-estimated changes in CBF against other measures of cerebral perfusion. It is interesting to note that some of the few that have attempted to correlate cerebral perfusion, as measured using the Kety–Schmidt technique, have found very poor correlations with TCD velocity measurements (Nuttall et al, 1996;
Table 4 Results of various studies measuring mean MCA diameters using direct vision in cadaver studies, using MRA, angiography, and Doppler
Measurement modality Mean MCA diameter (mm) Number of subjects
Notes
Cadaver 2.5–4 mm (mean = 3.35 mm) (Paiet al,2005) 5 MRA (all 1.5 T) 2.9 mm (Serradoret al,2000) 12 2.73 mm (Schreiberet al,2000) 8 2.23 mm (Tarasowet al,2007) 36 2.95 mm (Hansenet al,2007) 12 3.4 mm (Valduezaet al,1997) 6 Angiography 2.38 mm (Tarasowet al,2007) 36
Power Doppler
Proximal MCA 5.2 mm 17 Subjects suspected of
Distal MCA 4.3 mm (Mulleret al,2000) having vasospasm
TCCS
Proximal MCA 5.9 mm 17 Subjects suspected of
Distal MCA 4.9 mm (Mulleret al,2000) having vasospasm
MCA, middle cerebral artery; MRA, magnetic resonance angiography; TCCS, transcranial color-coded sonography. The differences between MRA and Doppler-measured diameters are similar to ours.
Weyland et al, 1994). Giller’s group investigated further the use of TCD during exercise and con-cluded that, because of probable vessel diameter change, the use of TCD velocities to interpret CBF during exercise might be invalid (Gilleret al, 2000). Our data support that caution must be used when using TCD-measured velocity data to imply changes in cerebral perfusion.
Possible Mechanisms of Vasodilatation
To maintain cerebral oxygen delivery in an increas-ingly hypoxic environment, one would expect to see an increase in CBF. This can be influenced by alterations in vessel diameter and the velocity of blood within it (which in turn is determined by blood pressure and blood viscosity—Poiseuille’s law). In this study, the first to measure both diameter and velocity with two techniques, vasodilatation appears to be the principal factor affecting flow. It may be that with increasing viscosity of blood, vasodilatation becomes the most important mechanism.
A number of mechanisms could be proposed to underlie vasodilatation.
Hypoxia: Hypoxia-induced increases in adenosine and nitric oxide, previously thought to mediate vasodilata-tion at an arteriolar level, might cause arterial vasodilatation. Other factors (such as those mediated by hypoxia inducible factor and the cascade it induces) are thought to occur over a longer time period (Wilson
et al, 2009). The rapid reversal of arterial dilatation with oxygen suggests a direct hypoxic effect.
Hypocarbia: A paradoxical phenomenon of hypocar-bic vasodilatation has previously been observed in forced hyperventilation (Du Boulay and Symon, 1971; Wollman et al, 1968). Du Boulay and Symon noted vasodilatation angiographically with PaCO2values of
20 to 25 mm Hg (2.6 to 3.33 kPa). While such a mechanism was not thought physiologically relevant, the extreme hyperventilation and consequent hypo-capnea that occurred at 7,950 m (mean ETCO2= 1.7
k-Pa) might be inducing this paradoxical effect.
Implications in High Altitude Illness
The arterial oxygen content (CaO2) at rest in a
subgroup of our subjects has previously been reported and is maintained at sea level values up to and above 7,100 m (Grocott et al, 2009). The reduc-tion in CaO2 above that altitude coincides with the
marked MCA arterial dilatation observed. Exercise at altitude is known to decrease CaO2 and increase
blood pressure (Imray et al, 2005). Similarly, Moller
et al (2002) reported that CaO2 was not only
maintained, but increased at rest at high altitude. Opposite to sea level observation, CaO2 decreased
slightly at the altitude of 5,260 m.
Although the increase in MCADiam only occurred
above 5,300 m, a similar change may also occur at
lower altitudes as a response to acute hypoxia, or during exercise at altitude (both of which are known to be potential triggers for acute mountain sickness and high altitude cerebral edema). According to LaPlace’s law (vessel wall tension = blood pressure
radius), the observed increase in MCADiam will
result in an increase in vessel wall tension.
The trigeminovascular system has been implicated in the genesis of both high altitude headache and acute mountain sickness (Jansenet al, 2000; Van Osta
et al, 2005). The observed cerebral vessel dilatation may act as a direct mechanical trigger for this system. Alternatively, failure to dilate might result in increased MCA velocities and raised arterial pres-sures in an attempt to maintain an adequate cerebral oxygen delivery, which could also have implication in the development of high altitude illness.
Deaths above 8,000 m on Everest have been associated with cognitive impairment, ataxia, pro-found fatigue, late summit times, and a tendency to fall behind (Firth et al, 2008). Our group’s recent study with blood gas analysis at 8,400 m (n= 4) demonstrated mean PaO2 was 3.28 kPa and PaCO2
was 1.77 kPa (Grocott et al, 2009). It is therefore suggested that some climbers suffer an acute hypoxic cerebral dysfunction and it may be that they are reaching the limits of the adaptive mechanisms for maintaining CaO2and cerebral oxygen delivery.
Clinical Implications
Giller, in his editorial, ‘The Emperor has no clothes,’ challenged the long held assumption that any changes in cerebral artery diameter that might occur are of no significance (Giller, 2003). Other studies have highlighted the need to obtain quantitative measures of CBF if there is reason to suspect that the diameter of the MCA might not remain constant, for example, when drugs such as nitroglycerin are used (Zuj et al, 2007).
The two studies reported here confirm that marked cerebral hypoxia is associated with significant increases in cerebral artery diameter. The wider implication from this study is that any future investigations measuring cerebral vessel blood velo-city, must also consider potential changes in vessel diameter. Vasospasm is known to occur following subarachnoid hemorrhage (Gonzalez et al, 2007). This study demonstrates that hypoxia also affects vessel caliber. Other conditions such as sepsis, inflammatory mediators, drugs, and alterations in blood pH may have similar effects.
These findings offer new insights into the possible underlying pathophysiology of acute mountain sick-ness and high altitude cerebral edema and highlight the importance of concurrent measurement of vessel caliber when using Doppler velocities to infer flow. The correlation of ultrasound measurements with MRA measurements implies that ultrasound may enable repeated assessments of cerebral artery size
MH Wilsonet al
and flow at the bedside, during hospital transfer or in the field (Wilsonet al, 2011).
Conclusions
This is the first published field study of cerebral perfusion above 5,500 m, and the first to show that exposure to extreme hypobaric hypoxia is associated with an increase in MCADiam, which is rapidly
reversed by inhaled supplemental oxygen. These field TCD findings have been replicated and con-firmed using MRA in acute hypoxia at sea level. This has uniquely demonstrated that ultrasound and MRA MCA measurements correlate. The increased diameter, as opposed to increased blood velocity, is the major factor increasing CBF and maintaining oxygen delivery. This may have implications for the pathogenesis of cerebral high altitude illness and the acclimatization process. Future studies inferring CBF from TCD velocity measurements at altitude and clinical studies where oxygenation may change, must take vessel caliber into account.
Acknowledgements
The Caudwell Xtreme Everest Research Group con-tributed to designing and conducting the experi-ments. The members of the Caudwell Xtreme Everest Research Group are as follows: Investigators—V Ahuja, G Aref-Adib, R Burnham, A Chisholm, K Clarke, D Coates, M Coates, D Cook, M Cox, S Dhillon, C Dougall, P Doyle, P Duncan, M Edsell, L Edwards, L Evans, P Gardiner, M Grocott, P Gunning, N Hart, J Harrington, J Harvey, C Holloway, D Howard, D Hurlbut, C Imray, C Ince, M Jonas, J van der Kaaij, M Khosravi, N Kolfschoten, D Levett, H Luery, A Luks, D Martin, R McMorrow, P Meale, K Mitchell, H Montgomery, G Morgan, J Morgan, A Murray, M Mythen, S Newman, M O’Dwyer, J Pate, T Plant, M Pun, P Richards, A Richardson, G Rodway, J Simpson, C Stroud, M Stroud, J Stygal, B Symons, P Szawarski, A Van Tulleken, C Van Tulleken, A Vercueil, L Wandrag, M Wilson, J Windsor; Scientific Advisory Group—B Basnyat, C Clarke, T Hornbein, J Milledge, J West.
Disclosure/conflict of interest
The authors declare no conflict of interest.
References
Ainslie PN, Burgess K, Subedi P, Burgess KR (2007) Alterations in cerebral dynamics at high altitude following partial acclimatization in humans: wakeful-ness and sleep.J Appl Physiol102:658–64
Ainslie PN, Ogoh S, Burgess K, Celi L, McGrattan K, Peebles K, Murrell C, Subedi P, Burgess KR (2008) Differential effects of acute hypoxia and high altitude on
cerebral blood flow velocity and dynamic cerebral autoregulation: alterations with hyperoxia. J Appl
Physiol104:490–8
Appenzeller O, Passino C, Roach R, Gamboa J, Gamboa A, Bernardi L, Bonfichi M, Malcovati L (2004) Cerebral vasoreactivity in Andeans and headache at sea level.
J Neurol Sci219:101–6
Baumgartner RW, Bartsch P, Maggiorini M, Waber U, Oelz O (1994) Enhanced cerebral blood flow in acute mountain sickness.Aviat Space Environ Med65:726–9 Baumgartner RW, Spyridopoulos I, Bartsch P, Maggiorini M, Oelz O (1999) Acute mountain sickness is not related to cerebral blood flow: a decompression chamber study.
J Appl Physiol86:1578–82
Beckmann N (2000) High resolution magnetic resonance angiography non-invasively reveals mouse strain differ-ences in the cerebrovascular anatomy in vivo. Magn
Reson Med44:252–8
Besselmann M, Liu M, Diedenhofen M, Franke C, Hoehn M (2001) MR angiographic investigation of transient focal cerebral ischemia in rat.NMR Biomed14:289–96 Brugniaux JV, Hodges AN, Hanly PJ, Poulin MJ (2007)
Cerebrovascular responses to altitude. Respir Physiol
Neurobiol158:212–23
Chan CW, Hoar H, Pattinson K, Bradwell AR, Wright AD, Imray CH (2005) Effect of sildenafil and acclimatization on cerebral oxygenation at altitude. Clin Sci (Lond)
109:319–24
Choy M, Ganesan V, Thomas DL, Thornton JS, Proctor E, King MD, van der Weerd L, Gadian DG, Lythgoe MF (2006) The chronic vascular and haemodynamic response after permanent bilateral common carotid occlusion in new-born and adult rats. J Cereb Blood Flow Metab 26: 1066–75
Du Boulay GH, Symon L (1971) The anaesthetist’s effect upon the cerebral arteries.Proc R Soc Med64:77–80 Feddersen B, Ausserer H, Neupane P, Thanbichler F,
Depaulis A, Waanders R, Noachtar S (2007) Right temporal cerebral dysfunction heralds symptoms of acute mountain sickness.J Neurol254:359–63
Firth PG, Zheng H, Windsor JS, Sutherland AI, Imray CH, Moore GW, Semple JL, Roach RC, Salisbury RA (2008) Mortality on Mount Everest, 1921 to 2006: descriptive study.BMJ337:a2654
Giller CA (2003) The Emperor has no clothes: velocity, flow, and the use of TCD.J Neuroimaging13:97–8 Giller CA, Bowman G, Dyer H, Mootz L, Krippner W (1993)
Cerebral arterial diameters during changes in blood pressure and carbon dioxide during craniotomy.
Neurosurgery32:737–41; discussion 41–42
Giller CA, Giller AM, Cooper CR, Hatab MR (2000) Evaluation of the cerebral hemodynamic response to rhythmic handgrip.J Appl Physiol88:2205–13
Gonzalez NR, Boscardin WJ, Glenn T, Vinuela F, Martin NA (2007) Vasospasm probability index: a combination of transcranial Doppler velocities, cerebral blood flow, and clinical risk factors to predict cerebral vasospasm after aneurysmal subarachnoid hemorrhage. J Neurosurg
107:1101–12
Grocott MP, Martin DS, Levett DZ, McMorrow R, Windsor J, Montgomery HE (2009) Arterial blood gases and oxygen content in climbers on Mount Everest.
N Engl J Med360:140–9
Grocott MP, Martin DS, Wilson MH, Mitchell K, Dhillon S, Mythen MG, Montgomery HE, Levett DZ (2010) Caudwell xtreme Everest expedition.High Alt Med Biol11:133–7
Hansen JM, Pedersen D, Larsen VA, et al(2007) Magnetic resonance angiography shows dilatation of the middle cerebral artery after infusion of glyceryl trinitrate in healthy volunteers .Cephalalgia27:118–27
Imray CH, Myers SD, Pattinson KT, Bradwell AR, Chan CW, Harris S, Collins P, Wright AD (2005) Effect of exercise on cerebral perfusion in humans at high altitude.J Appl Physiol99:699–706
Jansen GF, Kagenaar DA, Basnyat B, Odoom JA (2002) Basilar artery blood flow velocity and the ventilatory response to acute hypoxia in mountaineers. Respir
Physiol Neurobiol133:65–74
Jansen GF, Krins A, Basnyat B, Bosch A, Odoom JA (2000) Cerebral autoregulation in subjects adapted and not adapted to high altitude.Stroke31:2314–8
Lysakowski C, Von Elm E, Dumont L, Junod JD, Tassonyi E, Kayser B, Tramer MR (2004) Effect of magnesium, high altitude and acute mountain sickness on blood flow velocity in the middle cerebral artery. Clin Sci (Lond)
106:279–85
Martinoli C, Derchi LE (1997) Gain setting in power Doppler US.Radiology202:284–5
Moller K, Paulson OB, Hornbein TF, Colier WN, Paulson AS, Roach RC, Holm S, Knudsen GM (2002) Unchanged cerebral blood flow and oxidative metabolism after acclimatization to high altitude. J Cereb Blood Flow
Metab22:118–26
Muller M, Schwerdtfeger K, Zieroth S (2000) Assessment of middle cerebral artery diameter after aneurysmal subarachnoid hemorrhage by transcranial color-coded duplex sonography.Eur J Ultrasound11:15–9
Norcliffe LJ, Rivera-Ch M, Claydon VE, Moore JP, Leon-Velarde F, Appenzeller O, Hainsworth R (2005) Cerebrovascular responses to hypoxia and hypocapnia in high-altitude dwellers. J Physiol 566: 287–94
Nuttall GA, Cook DJ, Fulgham JR, Oliver Jr WC, Proper JA (1996) The relationship between cerebral blood flow and transcranial Doppler blood flow velocity during hypothermic cardiopulmonary bypass in adults.Anesth
Analg82:1146–51
Otis SM, Rossman ME, Schneider PA, Rush MP, Ring-elstein EB (1989) Relationship of cerebral blood flow regulation to acute mountain sickness. J Ultrasound Med8:143–8
Pai SB, Varma RG, Kulkarni RN (2005) Microsurgical anatomy of the middle cerebral artery.Neurol India53:186–90 Palma J, Macedonia C, Deuster P, Olsen C, Mozayeni BR,
Crutchfield KE (2006) Cerebrovascular dynamics and vascular endothelial growth factor in acute mountain sickness.Wilderness Environ Med17:1–7
Poulin MJ, Robbins PA (1996) Indexes of flow and cross-sectional area of the middle cerebral artery using Doppler ultrasound during hypoxia and hypercapnia in humans.Stroke27:2244–50
Reese T, Bochelen D, Sauter A, Beckmann N, Rudin M (1999) Magnetic resonance angiography of the rat cerebrovascular system without the use of contrast agents.NMR Biomed12:189–96
Schreiber SJ, Gottschalk S, Weih M, Villringer A, Valdueza JM (2000) Assessment of blood flow velocity and diameter of the middle cerebral artery during the acetazolamide provocation test by use of transcranial Doppler sonography and MR imaging. AJNR Am J
Neuroradiol21:1207–1
Serrador JM, Picot PA, Rutt BK, Shoemaker JK, Bondar RL (2000) MRI measures of middle cerebral artery diameter in conscious humans during simulated ortho-stasis.Stroke31:1672–8
Subudhi AW, Dimmen AC, Roach RC (2007) Effects of acute hypoxia on cerebral and muscle oxygenation during incremental exercise.J Appl Physiol103:177–83 Tarasow E, Abdulwahed Saleh Ali A, Lewszuk A, Walecki J (2007) Measurements of the middle cerebral artery in digital subtraction angiography and MR angiography.
Med Sci Monit13 (Suppl 1):65–72
Ter Minassian A, Beydon L, Ursino M, Gardette B, Gortan C, Richalet JP (2001) Doppler study of middle cerebral artery blood flow velocity and cerebral autoregulation during a simulated ascent of Mount Everest.Wilderness
Environ Med12:175–83
The National Institute of Neurological Disorders and Stroke rt-PA Stroke Study Group (1995) Tissue plasmi-nogen activator for acute ischemic stroke.N Engl J Med
333:1581–7
Valdueza JM, Balzer JO, Villringer A, Vogl TJ, Kutter R, Einhaupl KM (1997) Changes in blood flow velocity and diameter of the middle cerebral artery during hyper-ventilation: assessment with MR and transcranial Doppler sonography. AJNR Am J Neuroradiol 18: 1929–34
Van Osta A, Moraine JJ, Melot C, Mairbaurl H, Maggiorini M, Naeije R (2005) Effects of high altitude exposure on cerebral hemodynamics in normal subjects. Stroke
36:557–60
Virues-Ortega J, Buela-Casal G, Garrido E, Alcazar B (2004) Neuropsychological functioning associated with high-altitude exposure.Neuropsychol Rev14:197–224 Ward M, Milledge JS, West JB (2000) High Altitude
Physiology. 3rd edn. London: Arnold Publishers
Weyland A, Stephan H, Kazmaier S, Weyland W, Schorn B, Grune F, Sonntag H (1994) Flow velocity measurements as an index of cerebral blood flow. Validity of transcra-nial Doppler sonographic monitoring during cardiac surgery.Anesthesiology81:1401–10
Wilson MH, Levett DZ, Dhillon S, Mitchell K, Morgan J, Grocott MP, Imray C (2011) Stroke at high altitude diagnosed in the field using portable ultrasound.
Wild-erness Environ Med22:54–7
Wilson MH, Newman S, Imray CH (2009) The cerebral effects of ascent to high altitudes.Lancet Neurol8:175–91 Wolff CB, Richardson N, Kemp O, Kuttler A, McMorrow R, Hart N, Imray CH (2007) Near infra-red spectroscopy and arterial oxygen extraction at altitude.Adv Exp Med Biol599:183–9
Wollman H, Smith TC, Stephen GW, Colton III ET, Gleaton HE, Alexander SC (1968) Effects of extremes of respiratory and metabolic alkalosis on cerebral blood flow in man.J Appl Physiol24:60–5
Zuj KA, Greaves DK, Hughson RL (2007) WISE-2005: reduced cerebral blood flow velocity with nitroglycer-in–comparison with common carotid artery blood flow.
J Gravit Physiol14:P65–6
This work is licensed under the Creative Com-mons Attribution-NonCommercial-No Derivative Works 3.0 Unported License. To view a copy of this license, visit http://creativecommons.org/licenses/by-nc-nd/3.0/
MH Wilsonet al