1
Extraction of Chemical Information of Suspensions
using Radiative Transfer Theory to Remove Multiple
Scattering Effects: Application to a Model
Multi-Component System
Raimundas Steponavičius1, Suresh N. Thennadil2*
1Merz Court, School of Chemical Engineering and Advanced Materials, Newcastle University,
Newcastle upon Tyne, NE1 7RU, United Kingdom; 2 James Weir Building, 75 Montrose Street, Department of Chemical and Process Engineering, University of Strathclyde, Glasgow, G1 1XJ, United
Kingdom.
*To whom correspondence should be addressed: [email protected].
RECEIVED DATE
ABSTRACT
2 empirical scatter correction approaches to diffuse reflectance, diffuse transmittance and collimated transmittance measurements. It was found that the method provided appreciable improvement in model performance for the prediction of both the types of analytes. The study indicates that as long as the bulk absorption spectra is accurately extracted, no further empirical pre-processing to remove light scattering effects is required.
KEYWORDS: Scatter correction, Multivariate calibration, Near-infrared spectroscopy, Multiple scattering, Radiative transfer equation, Adding-doubling method.
INTRODUCTION
Development of robust and accurate calibration models for predicting analyte concentration in a particulate sample (e.g. powder mixtures, tissue, blood and other suspensions) using near infrared (NIR) spectroscopy poses a significant challenge due to complications arising from the competing effects of absorption and scattering and the nonlinear nature of sample-to-sample variations in scattering. Various empirical 1-6 and semi-empirical 7 approaches to remove scattering effects from spectra can be found in the literature. However, these approaches have not been adequate for situations where the sample-to-sample variations in light scattering are very large. Therefore, approaches based on separating absorption and scattering effects using fundamentals of light propagation are gaining greater impetus in the field of spectroscopic quantitative analysis of highly scattering samples 8-12. Recently 13, a method for removing multiple scattering effects using the radiative transfer theory in order to improve the performance of multivariate calibration models was proposed and tested on a model two component (polystyrene-water) system. This method consisted of decoupling the absorption and scattering effects by extracting the bulk absorption (μa) and scattering (μs) using the radiative transfer equation (RTE) and
building a Partial least squares (PLS) regression model using μa to predict the concentration of the
3 particles in the suspension. However, when the method was applied to a polystyrene-water system to build a model for predicting the concentration of polystyrene particles, two issues arose: (1) Additional pre-processing of the extracted bulk absorption spectra was required to obtain the best performing calibration model with this approach. (2) Calibration built using the total diffuse transmittance (Td) led
to a better performing calibration model. It was argued that the first issue was due to light losses from the sides of the cuvette at low particle concentrations. The second issue was attributed to an effect specific to the two-component system used. Since polystyrene particles absorb and scatter light, changes in photon path length will be correlated to the particle concentrations in a two-component system. This information would be removed by the decoupling step where the bulk absorption spectra (μa) are
extracted whereas in the diffuse transmittance measurements (Td), this information is retained. It was
argued that this effect is unique to a two-component system and thus when multi-component samples are considered, calibration models built on μa should perform significantly better than when Td
measurements are used.
In this paper, the effectiveness of this scatter correction approach based on the RTE is evaluated using a model multi-component system. The objectives of this study were (1) to determine if eliminating light losses from the sides of the cuvette will indeed remove the need for additional pre-processing, (2) to evaluate the performance of calibration models built after extracting the bulk absorption spectra for a multi-component suspension for predicting (a) the concentration of a particulate species that absorbs and scatters light and (b) the concentration of a purely absorbing (non-scattering) species.
MATERIALS AND METHODS
Decoupling of scattering and absorption effects
4 decoupling of absorption and scattering effects. This is achieved by inverting an appropriate set of measurements using the radiative transfer equation (RTE) which, for a specific wavelength λ is given by: d , ˆ , , ˆ , p 4 ) ( , , ) ( d , , d 4 s
t Ir s s s Ir s
s s r I
(1)
where I r,s, is the specific intensity at a distance r from source along the directional vector s, Ba(λ)
(cm-1)B is the bulk absorption coefficient, Bs(λ)B (cm
-1) is the bulk scattering coefficient,
) ( ) ( )
( a s
t is the total extinction coefficient, ps,sˆ, is the phase function, which is a
measure of the angular distribution of scattered light and is the solid angle. The phase function is represented as a function of the anisotropy factor g(λ) through the use of Henyey-Greenstein approximation 14 .(see eq. (6) in Ref. 13).
Through the inversion of (1), the parameters Ba(λ), Bs(λ) and g(λ) for a sample are obtained from the
measurements. This is carried out for all wavelengths at which the measurements are made resulting in a spectrum of these parameters which are denoted as vectors Ba, Bs and g. The inversion will then result in
the decoupling of absorption and scattering effects with Bs and g containing the effects due to scattering
and Ba representing the absorption properties of the sample. Further the bulk absorption is related
linearly to the concentration of the individual species present in the sample 13.
In order to extract the bulk optical properties by inverting the RTE, at least three measurements at each wavelength are required. The three measurements used in this study for extraction of the optical properties were: total diffuse transmittance (Td), total diffuse reflectance (Rd) and collimated
transmittance (Tc), the bold letters indicating that these are vectors of measurements at several
5 optical parameters 15,16. The extracted bulk absorption spectra are used for building a multivariate calibration model for estimating the concentration of the chemical component of interest.
EXPERIMENT
Design of Experiments
The model multi-component system constructed for this study was a four-component system consisting of water, deuterium oxide, ethanol and polystyrene particles. The model system was chosen such that we can study the problem of predicting the concentration of an analyte in a suspension for two commonly occurring situations namely, the case where the analyte (a) is an absorbing species and (b) is a species that both absorbs and scatters light (i.e. a particulate species). In this study, the prediction of ethanol concentration will correspond to case (a) and the prediction of the concentration of polystyrene particles will correspond to case (b). By having 4 chemical components, we can ensure that in the dataset collected, the concentrations of the two analytes of interest are not correlated to one another or to other components in the sample.
Ethanol (99.8% purity) was purchased from Fisher Scientific, heavy water (99.9% purity) was purchased from Qmx Laboratories and polystyrene latex suspensions (10% by weight of particles) of different particle sizes were bought from Duke Scientific. The three absorbing components ethanol, water and heavy water are fully miscible and they do not dilute or swell polystyrene particles at the concentrations used in this study
.
6 the upper limit for particle diameter. The highest concentration of particles was set to 5 %wt., beyond which the signal in the transmission mode gets too low for samples with 500 nm diameter particles i.e. we get into the zone of low signal-to-noise ratio and nonlinear detector response. The lower limits for particle size (100nm diameter) and concentration (1% by weight) were chosen so that for the measurement configurations used the light losses through the sides of the cuvette 17-19 were negligible. Five particle sizes of mean diameters 100, 200, 300, 430 and 500 nm, five particle concentrations centered around 1, 2, 3, 4 and 5 %wt. and five concentrations of ethanol centered around 2, 4, 6, 8 and 10 %wt. were used to build a dataset consisting of a total of 44 samples. These were prepared using various combinations of the concentrations of the components and particle sizes in a manner to ensure that in the resulting dataset the correlation between ethanol concentration and the other components and the correlation between polystyrene concentration and the other components were negligible.
Since the number of components is fairly small, it is not possible to get zero correlation between any pair of components because of the closure condition i.e. w 1
i i
where wi represents concentration of
7 avoid any possible correlations of the concentrations with experimental conditions (ambient temperature, instrument drift etc.).
Measurement set up
The measurement set up used was the same as the one used in previous studies for extracting bulk optical properties 13,20,21. Three measurements TBcB, TBdB and RBdB were taken for each sample which was
placed in a 1mm path length cuvette made of special optical glass (100.099-OS, Hellma) using a scanning spectrophotometer (CARY 5000, Varian Inc.) fitted with a diffuse reflectance accessory (DRA-2500). For this study a fixed spectral bandwidth of 7 nm was used for the whole wavelength region. Spectral data was collected in the wavelength region 1500-1880 nm at 2 nm intervals with an integration time of 10 seconds resulting in measurements at 191 discrete wavelengths per spectrum. This wavelength range was chosen because the first overtone peaks of polystyrene and ethanol due to C-H stretching vibrations occur in this region.
Extraction of bulk optical properties
The inverse adding-doubling (IAD) method 18 was used to extract the bulk optical properties μa, μs
and g from the measurements of Td, Rd, and Tc. The inversion algorithm used the collimated
8 this work, since water was the major component, the refractive index of the sample could be set equal to the refractive index of water. The inversion was run with both approaches i.e. using a weighted sum of the refractive index and using just the refractive index of water. The real refractive indices of water, ethanol, polystyrene and the glass of the measurement cell in the chosen wavelength range change little i.e.: from 1.3121 to 1.2993, from 1.3540 to 1.3535, from 1.5558 to 1.5529 and from 1.507 to 1.5027 respectively over the wavelength range considered. The refractive indices of ethanol and heavy water were taken from the refractive index database available 22.
Calibration
Multivariate calibration was carried out using PLS regression. The performance of the PLS models were evaluated using root mean square error of cross validation (RMSECV). Cross validation was carried out using the „leave-one-out‟ method. Further, all the raw spectra were smoothed using Savitsky-Golay filter with the window width 9 and the polynomial order 3 to remove noise in the measurements. For all models, the spectra were mean-centered. The computations were carried out using MatlabP
®
P
and the PLS models were built using PLS_Toolbox by Eigenvectors Research Inc.
RESULTS AND DISCUSSION
The three measurements (diffuse reflectance, diffuse transmittance and collimated transmittance) and the extracted bulk absorption spectra for the samples are presented in figure 1. It is seen that the magnitudes of variation in the dataset are much larger in the measurements (diffuse reflectance, diffuse transmittance and collimated transmittance) than in the extracted BaB where the variations due to multiple
light scattering have been removed. However, there is still some “spread” in the data which is due to the fact that that while Ba represents the absorption properties of the sample, it still contains a contribution
9 An important point to note in figure 1 is the broad peak in the wavelength region 1600-1750 nm centered around 1670nm which can be seen most clearly in figures 1 (b) and (d). This peak does not appear in the absorption spectra of the pure components. This indicates that the absorption spectra of the mixtures for the range of concentrations considered here are not additive and that a new absorption peak may be forming due to interactions. To find out which of the components interacted to form this new peak different binary mixtures, namely, ethanol-water, ethanol-D2O and water-D2O, were examined. It
was found that spectra of H2O – D2O mixtures exhibited this peak. It appears neither in the absorption
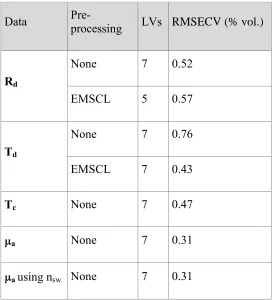
spectrum of pure water nor in the absorption spectrum of deuterium oxide. Figure 2(a) shows the spectra of H2O – D2O mixtures of different composition. The peaks centered around 1450, 1790 and 1900 nm
are the first overtones of O–H (from H2O), while a comparatively weak and broad band of O–D (from
D2O) is seen centered approximately around 1600nm. Figure 2(b) shows the absorbance at 3 different
wavelengths: 1670 nm which is approximately the centre of the broad peak in the 1600-1750nm and 1500 nm and 1800 nm which lie on either side of this peak. At the latter wavelengths which include absorption due to both O-H and O-D overtones, the absorption changes linearly with concentration of water. The absorbance at 1670nm increases as the ratio of D2O to H2O is increased and then drops when
the % vol. of water becomes greater than about 55-60% by volume reaching the value of absorbance of pure water at 100% by volume. As indicated in the figure, the absorbance at this wavelength is non-linear with the points being fitted well with a second order polynomial with respect to the water concentration. This suggests that the peak is probably due to the formation of H2O – D2O dimers.
Studies of water, D2O and HDO dimers have been extensively carried out in the past by researchers23-27
which have shown that dimers with H2O.DOD and D2O.HOH structures are formed with the dimer
10
(a) Prediction of concentration of absorbing-only (non-scattering) species
In the model four-component system considered in this study, ethanol corresponds to an absorbing-only species as the analyte of interest. In the wavelength region considered, the first overtone bands of ethanol are found at around 1680nm (C-H), 1684nm and 1692nm (C-H3) and bands due to asymmetric
vibrations of CH2 and CH3 at around1714nm and 1719nm28. Calibration models were built using PLS
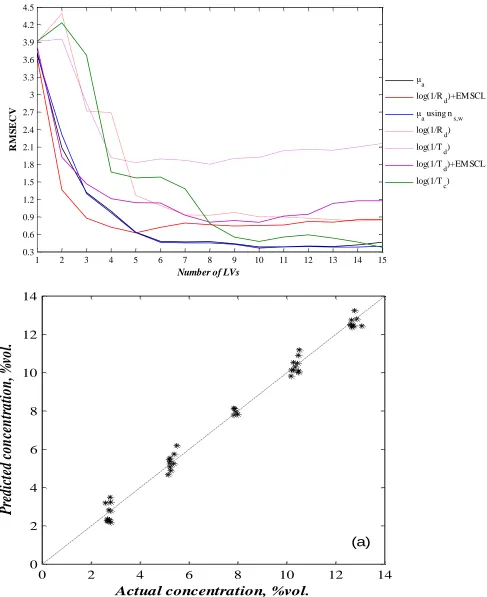
regression both with and without applying pre-processing. The following pre-processing methods were tried: multiplicative scatter correction, standard normal variate, extended multiplicative scatter correction and first and second derivatives. Only the results for pre-processing method that provided the best performing model for each of the measurement set are reported here along with the performance of the corresponding model built without pre-processing. Figure 3(a) shows the RMSECV curves for the models built using different data sets i.e. Td, Rd, Tc and μa. As mentioned earlier, the bulk absorption
spectra μa were extracted using two different values for the refractive index of the sample. In figure 3(a),
the curve labeled μa denotes the RMSECV curve for the model built with μa extracted by taking the
sample refractive index to be the weighted sum of the refractive indices of the individual components in the sample. The curve labeled „μa using ns,w‟ denotes the model built with μa extracted by approximating
the refractive index of the samples to be that of pure water. It can be seen from figure 3(a) and Table 2 that the differences in the results are negligible indicating that approximating the refractive index of the sample with that of pure water will not adversely affect the final results. It can be seen that the best results are obtained by using μa without pre-processing with an RMSECV of 0.47 vol% using a PLS
model having six latent variables. Since there are 4 components in the samples plus the effect due to the formation of H2O-D2O dimers and the effect of particle sizes, this is the number of latent variables that
would be expected if the large non-linearities arising from photon path length variations due to multiple scattering have been removed. Predicted versus actual values of ethanol concentration for the best PLS model i.e. the one built on a, are plotted in figure 3(b). Note that the RMSECV obtained using
collimated transmittance (Tc) measurements also is the same as that obtained when using μa though it
11 the model using Tc is not surprising since this measurement contains largely unscattered light at low
particle concentrations. As the particle concentration increases, this measurement will be increasingly contaminated with scattered light as well as facing a rapid reduction in signal-to-noise. At moderate to high concentrations this measurement will not be feasible due to lack of sufficient signal and other configurations such as diffuse reflectance or diffuse transmittance measurements will have to be used.
It is seen that for diffuse transmittance and diffuse reflectance data, empirical pre-processing can lead to appreciable drop in RMSECV compared to building a model without any pre-processing. The best pre-processing method for these data among the ones considered was the version of extended multiplicative scatter correction method (EMSCL) which models wavelength dependence as a logarithmic function 2.
(b) Prediction of concentration of scattering-absorbing (particulate) species
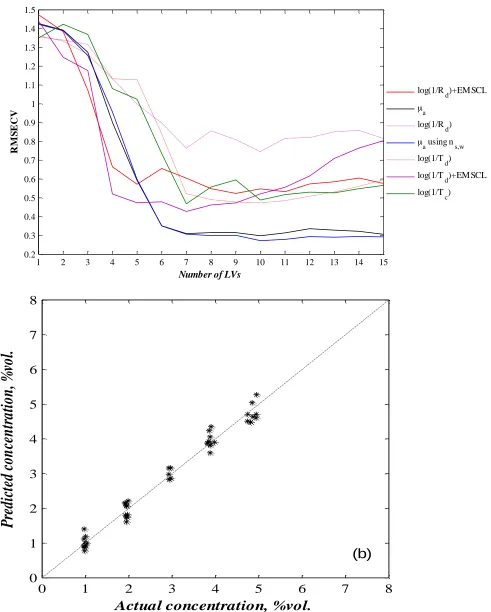
In the model system considered in this study, polystyrene latex particles correspond to a scattering-absorbing species as the analyte of interest. In the wavelength range considered, first overtone peaks of polystyrene are centered around 1680nm (C-H). Figure 4(a) shows the RMSECV curves for the models built using different data sets i.e. Td, Rd, Tc and μa. Table 3 summarizes the performance of the models.
As in the case with absorbing-only species, the best performance was achieved by the model built on the extracted bulk absorption spectra μa. In this case one more latent variable than that required for the
absorbing-only case was needed i.e. 7 latent variables were needed. The increase could be due to a small amount of particle concentration dependent scattering effect being embedded in the extracted μa.
Predicted versus actual values of polystyrene concentration for the best PLS model i.e. the one built on
a, are plotted in figure 4 (b).
As mentioned earlier, for the two component (polystyrene-water) system studied in an earlier work 13, the model built using Td performed much better than the one built on μa. It was hypothesized that this
12 would not exist, it was predicted that there will be degradation in the performance of models built on Td
for estimating particle concentrations in such a system compared to using μa. The result reported here
confirms this hypothesis.
Again, no significant difference is observed between the two different values used for the refractive index of sample, suggesting that not accounting for the small changes in refractive index due to variations in the composition of the samples will not adversely affect the performance of the calibration models built using μa extracted by inverting the radiative transfer equation.
Comparing the results in predicting the two types of species i.e. the absorbing and the scattering-absorbing species, using the empirically pre-processed measurements, one can notice that in the first case a better performance was obtained using Rd pre-processed with EMSCL and in the second case
using Td pre-processed with EMSCL.
CONCLUSIONS
13 of measurements such as spatially resolved measurements where reflectances from the sample at different distances from the incident beam are collected.
ACKNOWLEDGMENT
14
LIST OF FIGURES
Figure 1. Collimated transmittance, total transmittance, total reflectance and bulk absorption spectra of the 4 component model system for different compositions.
Figure 2. (a) Absorption spectra of H2O-D2O mixtures; (b) Dependence of absorption on H2O-D2O
composition: 1500 nm (triangle), 1880 nm (square) and 1670 nm (cross); the blue line is the fit.
Figure 3. (a) RMSECV curves for prediction of ethanol concentration; (b) Predicted versus actual values of ethanol concentration.
Figure 4. (a) RMSECV curves for prediction of concentration of polystyrene particles; (b) Predicted versus actual values of concentration of polystyrene.
LIST OF TABLES
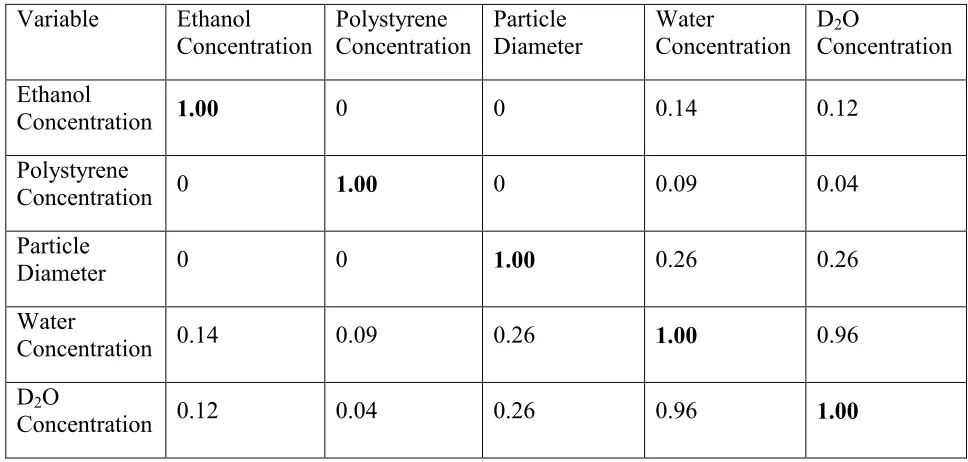
Table 1. Correlation matrix between variables (concentrations of analytes and particle diameters) in the dataset.
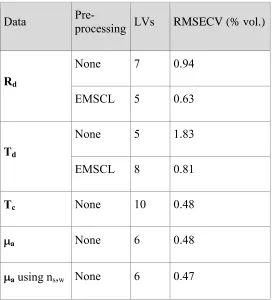
Table 2. Performance of calibration models for estimating concentration of absorbing-only species (ethanol).
15
Table 1. Correlation matrix between variables (concentrations of analytes and particle diameters) in the dataset.
Variable Ethanol Concentration
Polystyrene Concentration
Particle Diameter
Water
Concentration
D2O
Concentration Ethanol
Concentration 1.00 0 0 0.14 0.12
Polystyrene
Concentration 0 1.00 0 0.09 0.04
Particle
Diameter 0 0 1.00 0.26 0.26
Water
Concentration 0.14 0.09 0.26 1.00 0.96
D2O
16
Table 2. Performance of calibration models for estimating concentration of absorbing-only species (ethanol).
Data Pre-processing LVs RMSECV (% vol.)
Rd
None 7 0.94
EMSCL 5 0.63
Td
None 5 1.83
EMSCL 8 0.81
Tc None 10 0.48
a None 6 0.48
[image:16.612.171.443.99.399.2]17
Table 3. Performance of calibration models for estimating concentration of scattering-absorbing species (polystyrene).
Data Pre-processing LVs RMSECV (% vol.)
Rd
None 7 0.52
EMSCL 5 0.57
Td
None 7 0.76
EMSCL 7 0.43
Tc None 7 0.47
a None 7 0.31
18 0
1 2 3 4 5
ln
(1
/T
d
)
0 1 2 3 4 5
ln
(1
/R
d
)
0 2 4 6 8
ln
(1
/T
c
)
15000 1550 1600 1650 1700 1750 1800 1850 1
2 3 4 5
Wavelength, nm
[image:18.612.179.418.43.576.2]a
19 900 1000 1100 1200 1300 1400 1500 1600 1700 1800 1900
0 0.5 1 1.5 2 2.5 3 3.5 4 4.5 5 Wavelength, nm A b so rb a n ce
1.6 % vol.of wat er 5.1 % vol.of wat er 8.0 % vol. of wat er 10.1 % vol.of wat er 32.5 % vol. of wat er 50.0 % vol. of wat er 71.3 % vol. of wat er 90.8 % vol. of wat er 100 % vol. of wat er 0 % vol. of wat er
0 0.2 0.4 0.6 0.8 1
0 0.2 0.4 0.6 0.8 1 1.2 1.4 1.6 1.8
Concentration of water, %vol.
A b so rb a n c e
Figure 2. (a) Absorption spectra of H2O-D2O mixtures; (b) Dependence of absorption on H2O-D2O
composition: 1500 nm (triangle), 1880 nm (square) and 1670 nm (cross); the blue line is the fit. (a)
[image:19.612.96.510.62.591.2]20 1 2 3 4 5 6 7 8 9 10 11 12 13 14 15
0.3 0.6 0.9 1.2 1.5 1.8 2.1 2.4 2.7 3 3.3 3.6 3.9 4.2 4.5
Number of LVs
R M S E C V a log(1/R
d)+EM SCL
a using ns,w log(1/R
d) log(1/T
d) log(1/T
d)+EM SCL log(1/T
c)
0 2 4 6 8 10 12 14
0 2 4 6 8 10 12 14
Actual concentration, %vol.
P
red
ict
ed
co
n
ce
n
tr
at
io
n
, %
vo
l.
(a) [image:20.612.60.547.58.655.2]21 1 2 3 4 5 6 7 8 9 10 11 12 13 14 15
0.2 0.3 0.4 0.5 0.6 0.7 0.8 0.9 1 1.1 1.2 1.3 1.4 1.5
Number of LVs
R M S E C V log(1/R
d)+EM SCL
a log(1/R
d)
a using ns,w log(1/T
d) log(1/T
d)+EM SCL log(1/T
c)
0 1 2 3 4 5 6 7 8
0 1 2 3 4 5 6 7 8
Actual concentration, %vol.
P
red
ict
ed
co
n
ce
n
tr
at
io
n
, %
vo
l.
(b)
[image:21.612.59.550.33.645.2]22 REFERENCES
(1) Martens, H.; Nielsen, J. P.; Engelsen, S. B. Analytical Chemistry 2003, 75, 394-404.
(2) Thennadil, S. N.; Martin, E. B. Journal of Chemometrics 2005, 19, 77-89.
(3) Chen, Z. P.; Morris, J.; Martin, E. Analytical Chemistry 2006, 78, 7674-7681.
(4) Helland, I. S.; Naes, T.; Isaksson, T. Chemometrics and Intelligent Laboratory Systems 1995, 29, 233-241.
(5) Rinnan, A.; van den Berg, F.; Engelsen, S. B. Trac-Trends in Analytical Chemistry 2009, 28, 1201-1222.
(6) Svensson, O.; Kourti, T.; MacGregor, J. F. Journal of Chemometrics 2002, 16, 176-188.
(7) Thennadil, S. N.; Martens, H.; Kohler, A. Applied Spectroscopy 2006, 60, 315-321.
(8) Leonardi, L.; Burns, D. H. Applied Spectroscopy 1999, 53, 628-636.
(9) Abrahamsson, C.; Johansson, J.; Andersson-Engels, S.; Svanberg, S.; Folestad, S. Analytical Chemistry 2005, 77, 1055-1059.
(10) Chaiken, J.; Goodisman, J. Journal of Biomedical Optics 2010, 15, 037007.
(11) Leger, M. N. Applied Spectroscopy 2010, 64, 245-254.
(12) Ottestad, S.; Isaksson, T.; Saeys, W.; Wold, J. P. Applied Spectroscopy 2010, 64, 795-804.
(13) Steponavicius, R.; Thennadil, S. N. Analytical Chemistry 2009, 81, 7713-7723.
23 (15) Prahl, S. A. In Optical-thermal response of laser irradiated tissue; Welch, A. J., van Gemert, M. J. C., Eds.; Plenum Press: New York, 1995, p 101-129.
(16) Van de Hulst, H. C. Multiple light scattering: tables formulas and applications; USA Academic: USA, 1980; Vol. 1.
(17) de Vries, G.; Beek, J. F.; Lucassen, G. W.; van Gemert, M. J. C. Ieee Journal of Selected Topics in Quantum Electronics 1999, 5, 944-947.
(18) Prahl, S. A.; Vangemert, M. J. C.; Welch, A. J. Applied Optics 1993, 32, 559-568.
(19) Zhu, D.; Lu, W.; Zeng, S. Q.; Luo, Q. M. Journal of Biomedical Optics 2007, 12.
(20) Dzhongova, E.; Harwood, C. R.; Thennadil, S. N. Applied Spectroscopy 2009, 63, 25-32.
(21) Saeys, W.; Velazco-Roa, M. A.; Thennadil, S. N.; Ramon, H.; Nicolai, B. M. Applied Optics 2008, 47, 908-919.
(22) Refractive index database available at http://refractiveindex.info
(23) Devlin, J. P. Journal of Chemical Physics 2000, 112, 5527-5529.
(24) Engdahl, A.; Nelander, B. The Journal of Chemical Physics 1987, 86, 1819-1823.
(25) Worley, J. D.; Klotz, I. M. The Journal of Chemical Physis 1966, 45, 2868 - 2871.
(26) Thomas, M. R.; Scheraga, H. A.; Schrier, E. E. The Journal of Physical Chemistry 1965, 69, 3722 - 3726.
(27) Lappi, S. E.; Smith, B.; Franzen, S. Spectrochimica Acta Part A 2004, 60, 2611 - 2619.
24
FOR TOC ONLY
1 2 3 4 5 6 7 8 9 10 11 12 13 14 15 0.2
0.3 0.4 0.5 0.6 0.7 0.8 0.9 1 1.1 1.2 1.3 1.4 1.5
Number of LVs
R
M
S
E
C
V
log(1/R
d)+EM SCL
a log(1/R
d)
a using ns,w log(1/T
d) log(1/T
d)+EM SCL log(1/T