Laissez Faire and the Clean Development Mechanism:
Determinants of Project Implementation in Indian States,
2003-2011
∗
Patrick Bayer† Johannes Urpelainen‡ Alice Xu§
18 March 2014
Abstract
India is the world’s second-largest host of projects implemented under the Kyoto Proto-col’s Clean Development Mechanism (CDM). There is, however, considerable variation in the distribution of CDM projects implemented across different Indian states. While a large body of literature examines cross-national variation in the implementation of CDM projects, few studies have analyzed the determinants of sub-national variation in different national con-texts. Since India has adopted a laissez-faire approach to CDM project implementation, we theorize that profitable climate mitigation opportunities and political stability are two factors that promote CDM project implementation. A quantitative analysis provides empirical sup-port for a set of hypotheses regarding the effects of these variables on project implementation. First, states with a lot of public electricity generating capacity and industrial capital imple-ment more CDM projects than other states. Additionally, project developers rarely propose CDM projects during election years due to high levels of political uncertainty. Since India’s liberal approach prevents the central government from using the CDM to promote sustain-able development in less developed states, both India and other host countries should develop coordinated national policies to maximize their gains from CDM projects.
Keywords: climate policy; international institutions; Clean Development Mechanism; India; sub-national variation.
∗This paper was written during a research stay funded by an ERP fellowship of the Studienstiftung des deutschen
Volkes. Patrick Bayer gratefully acknowledges this generous funding and is thankful for the hospitality of Columbia University. We thank Michaël Aklin, S.P. Harish, and the anonymous reviewers for helpful comments on a previous draft.
†Department of Political Science & Program in International and Area Studies, Washington University in St. Louis. One Brookings Drive. St. Louis, MO 63130, USA.
‡Corresponding author. Department of Political Science, Columbia University. 420 West 118th Street, 712 Interna-tional Affairs Building. New York, NY 10027, USA.
1 Introduction
The Kyoto Protocol’s Clean Development Mechanism (CDM) allows industrialized countries to
acquire carbon credits which are generated from emissions reductions in climate mitigation
projects in developing countries. As the second-largest user of the CDM, India has played a
great part in assisting industrialized countries in securing these cost reductions. Between 2003
and 2011, project developers submitted 2,178 project proposals to the CDM Executive Board.1
The use of the CDM across Indian states and over time is highly uneven. Some states, such
as Gujarat and Tamil Nadu, have implemented hundreds of CDM projects, while others with
equally large populations and land areas, such as Madhya Pradesh, have implemented many
fewer. Moreover, the growth in CDM project implementation over time varies across states. Why
are there regional differences in the use of the CDM in India?
These questions are important for the emerging literature on sub-national variation in
en-vironmental governance (Schreurs, 2008; Andonova and Mitchell, 2010). In the cross-national
context, the CDM is concentrated in rapidly industrializing economies, especially China and
India. However, it remains unclear if economic development can also explain sub-national
vari-ation in CDM project implementvari-ation within Indian states. Can theories designed to explain
cross-national patterns also explain sub-national variation? Given how many CDM projects are
located in a handful of rapidly industrializing states, answering these questions is equally
im-portant as explaining variation across host countries.
While the empirical literature on the CDM has analyzed cross-national variation in project
implementation (Dechezleprêtre, Glachant, and Ménière, 2008; Castro and Michaelowa, 2011;
Di-nar et al., 2011), there are few studies that investigate sub-national variation (Bayer, Urpelainen,
and Wallace, 2013). Most existing studies on differences in the national governance of the CDM
across countries (Ganapati and Liu, 2008; Benecke, 2009; Schroeder, 2009) do not test hypotheses
on how national institutions shape sub-national patterns of project implementation. In regard
to India, the emerging literature on the CDM includes some studies that analyze CDM projects
within the country, but these are either purely descriptive or rely heavily on survey results
(Er-lewein and Nüsser, 2011; Michaelowa and Purohit, 2007).2
In contrast to analyses in the existing research, this study presents findings from a systematic
empirical analysis of CDM projects during the 2003-2011 period in 27 Indian states.3 Our main
argument is that the distribution of CDM projects across India is largely driven by the country’s
laissez-faire approach to the CDM (Ganapati and Liu, 2008; Benecke, 2009). In contrast to China,
where the national government uses the CDM to promote specific economic goals (Schroeder,
2009), such as the development of poor provinces or the transfer of new technologies from abroad
(Popp, 2011; Curnow and Hodes, 2009), India does not actively coordinate the implementation
of CDM projects across states.
Although we do not replicate the statistical analysis for China in this work, Bayer, Urpelainen,
and Wallace (2013) provide an comparable analysis that confirms this difference in experience
between the two countries. While the statistical comparison is not exactly identical given the
difference in the dependent variable, the logic of the argument is similar, and the article is also
based on the same theoretical grounding. Consistent with the idea that Beijing uses the CDM to
promote economic development in underprivileged areas, Bayer, Urpelainen, and Wallace (2013)
show that Chinese provinces with low per capita income and levels of foreign direct investment
receive more technology transfer from the CDM than their wealthier counterparts.
We first argue that India’s laissez-faire approach has important implications for sub-national
patterns of CDM project implementation. Given India’s liberal approach, we expect CDM projects
to be concentrated in states with a lot of potential for climate mitigation, as investors are at
lib-erty to search for profitable opportunities. In the absence of a national coordination strategy,
CDM projects in India should be located where abatement is cheapest; therefore, states with a lot
of mitigation potential are most lucrative CDM hosts. More generally, India’s sub-national
pat-terns of CDM project implementation should largely resemble the corresponding cross-national
2Erlewein and Nüsser (2011) conduct a descriptive analysis of the effectiveness of large hydropower CDM projects in the Indian state of Himachal Pradesh by examining planning documents and carrying out expert interviews. Michaelowa and Purohit (2007) study a sample of 52 CDM project design documents to determine if these documents address additionality.
patterns.
Indeed, we find that states with high capacity for public electricity generation and with a lot
of industrial capital implement more CDM projects than those that lack these resources. Since
electricity and industry are key sources of carbon emissions, this is consistent with the
expecta-tion that mitigaexpecta-tion potential is central to understanding the distribuexpecta-tion of CDM projects within
India. On the other hand, our findings show that there is no correlation between private
elec-tricity generation capacity and CDM project implementation. Given that elecelec-tricity generation
by the private sector is more productive than the performance of the country’s public utilities
(Joseph, 2010), it is understandable that public as opposed to private generation capacity
in-creases CDM project implementation. Moreover, India’s private electricity generation capacity
is a relatively new development because independent power generators were only allowed after
the 1991 economic reforms.
In view of India’s liberal approach to the CDM, we also hypothesize that investors prefer to
avoid implementing new projects during years with high political uncertainty. It is difficult to
measure political uncertainty in the sub-national context as a continuous variable. Instead, we
construct a simple, binary indicator to capture election years in the states, and use this election
years variable to proxy time periods of political uncertainty in the state. Because investors would
prefer to avoid political uncertainty that characterizes pre-election and post-election times, CDM
project implementation should be lower in a given Indian state during election years than
non-election years. We find that this is the case for renewable energy projects, perhaps because
renewable energy projects are more dependent on policies than other energy projects.
This study explains why sub-national variation is as extensive as variation in CDM project
im-plementation across countries. The findings highlight the need for new empirical research at the
sub-national level. The approach we use could be applied to an analysis of sub-national variation
in other large, developing countries, such as Brazil or South Africa, and to other international
institutions that promote environmental projects, such as the Global Environmental Facility. Our
study also has important policy implications for developing countries. First, India’s laissez-faire
sufficiently industrialized. In this regard, China’s more aggressive approach of promoting CDM
project implementation in less developed provinces seems more successful than India’s hands-off
strategy. Second, in the context of institutional differences, it appears that political factors
engen-dered by India’s status as a democracy challenge CDM project implementation. India and other
rapidly industrializing countries can reap more gains from the CDM if they reassure investors
regarding the stability of their climate mitigation policies.
2 Background, Theory, and Hypotheses
To set the stage for our empirical analysis, we begin with an overview of the CDM. Then, we
provide an account of the CDM in the context of India and derive empirically testable hypotheses.
2.1 Understanding the Clean Development Mechanism
The CDM is one of the Kyoto Protocol’s “flexible mechanisms” (Article 12). It allows
industrial-ized countries to use Certified Emissions Reduction credits (CERs), which are generated through
carbon abatement in developing countries and can be credited against domestic reduction
tar-gets.4 The CDM scheme promotes “where”-efficiency and takes advantage of lower marginal
abatement costs in developing countries (Grubb, 2003). Thus, from an economic perspective, the
CDM reduces carbon emissions in a cost-effective manner.
CDM project implementation is characterized by a standard, seven-stage process.5 In the first
stage, the project participant prepares a Project Design Document (PDD) that details the project’s
methodologies and expected emission reductions. In the second stage, project participants solicit
approval from the Designated National Authority of the host country, confirming that project
implementation is voluntary and contributes to the sustainable development of the region. In
the subsequent two stages, a nationally accredited Designated Operational Entity (DOE) and the
CDM Executive Board conduct a separate review of the design document. If the reviews confirm
that the project adheres to the Kyoto Protocol’s CDM modalities, the project is registered in the
CDM database. The project participants monitor the actual emission reductions in stage 5, and
4One CER is equivalent to the abatement of one metric ton of carbon dioxide emissions. These credits can be traded and sold to industrialized countries with reduction commitments under the Kyoto Protocol.
the emissions reduction is verified by the DOE in stage 6. Finally, the CDM Executive Board
conducts a final review of the project before it issues CERs to the project participant.
2.2 Indian Context
India is frequently listed alongside China and Brazil as one of the most attractive non-Annex I
countries for CDM project development.6 Especially beginning in the mid-2000s, CDM project
development in India reached new heights. Given that the energy sector accounts for more
than 85% of the country’s CO2 emissions, a major share of CDM activity in India is, from the
beginning, expected to be directed towards reducing emissions from this sector (Markandya and
Halsnaes, 2002).
India is a federal system with 28 states and seven Union Territories. Policy formulation is
divided between the central and state governments. Because of the organization of the country’s
federal system, Indian states have substantial political influence in policy areas that target energy
and the environment (Benecke, 2009). Lobbying on the part of private enterprises, for one, occurs
at the local level. In regard to the CDM, the revenue from the CERs generated by the mechanism
are within state interests because they are considered to be a national resource that is created
at the local level (Benecke, 2009). In other words, CER revenue is jointly shared by the central
and state governments. Overall, Indian policymakers at different levels play an influential role
in directing the development of the CDM (Shalini Randeria, 2003).
A critical goal on the country’s development agenda is to target poverty alleviation in
cer-tain rural communities. In spite of the CDM’s capacity to encourage the development of less
developed states, while contributing to sustainable development in these regions, the Indian
government has not actively channeled CDM project development to the states that need them
the most. Sub-national reports conducted by India’s Ministry of Environment and Forests
doc-ument various implementation gaps, institutional rigidities, and state-level differences at play
(Benecke, 2009). The National CDM Authority (NCDMA), India’s Designated National
Author-ity, evaluates proposed CDM projects according to the probability of successful implementation
and the degree to which projects meet sustainable development objectives.7 Instead of
encourag-ing project implementation in underdeveloped states, the Ministry of Environment and Forests
only provides clearance to project participants for the use of forest land.8
In contrast to the Chinese government’s efforts to direct CDM investment to specific areas that
are in line with national priorities (Popp, 2011), the Indian government has adopted a
laissez-faire approach to the CDM. In other words, the Indian government takes on a passive role of
market facilitation when it comes to the the CDM (Benecke, 2009; Fuhr and Lederer, 2009; Newell,
2009). Specifically, the government refrains from setting up extensive regulation and does not
proactively intervene in the promotion of carbon markets in India. The NCDMA places the
responsibilities of CDM project implementation largely in the hands of the private sector, and the
Authority merely ensures the smooth functioning of the market (Benecke, 2009). In spite of how
the Authority “has sufficient human, technical, and financial resources to apply harder control
mechanisms, for example, with regard to sustainability assessments, additionality testing, and
establishing level-playing fields on regulations,” (Benecke, 2009: 366) these regulatory bodies lack
the political mandate to use the CDM as a policy instrument to promote economic development
in less developed regions.
There are other, more ingrained factors that help explain the Indian government’s liberal
approach to the CDM. As a country that inherited various democratic institutions from its
pre-colonial times, democratic politics are a central component of India’s CDM regime. Among the
Indian public, the NCDMA retains an image as a transparent institution that is open to public
consultation (Indian Ministry of Environment and Forests, 2001; Benecke, 2009). The effects of
having a higher level of democratic accountability are two-fold.
First, India’s central government does not have significant leverage in directing the allocation
of CDM projects to different regions. Given the constraints imposed by democracy, the central
government simply does not have free reign in interfering with the CDM market. Second,
recur-ring elections are a key feature in a country with sufficiently developed, democratic institutions.
7Seehttp://www.cdmindia.gov.in/constitution.php. Accessed June 6, 2012.
Since CDM project developers prefer to avoid political uncertainty, we expect the frequency of
elections to affect the pattern of CDM project implementation at the state level. In summary,
the democratic institutions in India have a dual effect in allowing market forces to dictate the
development of the CDM market and in making elections a determinant of patterns in project
implementation.
Despite the laissez-faire approach, the Indian government recently made the CDM project
approval process more stringent (Benecke, 2009). Because India has a high number of CDM
projects rejected by the CDM Executive Board, the regulatory structure of the CDM in India
has been subject to substantial criticism (Newell, 2009). Against this backdrop, the relevant
government bodies, many of which are at the state level, were obliged to respond accordingly.
Benecke (2009) finds that the NCDMA has been particularly concerned with the extent to which
proposed projects fulfill the sustainability criteria. He notes that the NCDMA has also embraced
a more rigorous evaluation of project additionality and baseline assessment, a task that usually
falls under the domain of the Designed Operational Entities (Benecke, 2009).
While India’s approach to the CDM is generally liberal, the public sector has traditionally
played a key role in the electricity sector. In India, state utilities cannot provide reliable power
service, because regulation of electricity generation by the public sector has been plagued with
ongoing power theft by customers, corruption, and an artificially decreased pricing structure
(Joseph, 2010). Tongia (2003) confirms that the Indian power sector is beset with theft and
bu-reaucratic inefficiencies, citing a loss of 5 billion dollars per year. The value, constituting more
than one percent of the country’s GDP, is a generous underestimate, for the losses would be
much greater if state governments did not spend around two billion dollars in cross subsidies,
grants, and soft loans to alleviate the existing problems (Tongia, 2003). In response to the failed
attempts to reform public sector electricity generation, industrial consumers have resorted to
pri-vate, on-site generation to secure stable electricity provision (Joseph, 2010; Mathy, Hourcade, and
de Gouvello, 2001). This recent trend has resulted in a “dual-track economy” (Joseph, 2010: 503)
with coexisting public and private electricity generation.
project implementation. While national policies that support renewable electricity generation
exist, there is considerable variation in support for renewable electricity at the sub-national level.
In April 2010, for example, 17 of the 27 Indian states had established a Renewable Portfolio
Obligation (Arora et al., 2010: 25-26), which would increase the profitability of renewables. This
policy along with many others have had a large impact on the profitability of climate mitigation
under the CDM in India. Therefore, it is important to account for the political and economic
characteristics of different states.
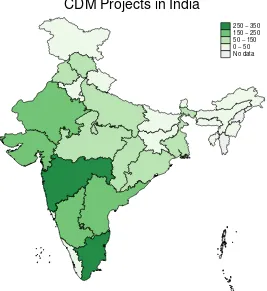
We expect CDM project development to exhibit unequal distribution across India, with projects
concentrated in the states that are highly industrialized. As Figure 1 shows, the states of
Ma-harashtra and Tamil Nadu, two states that are among those with the highest GDP, are shown
as having the highest number of CDM projects. In contrast, states in the northern and eastern
regions, such as Sikkim and Andhra Pradesh, have much lower GDP and also much fewer CDM
projects. In his assessment of the extent to which CDM projects in India contribute to the
socioe-conomic component of the country’s sustainable development objectives, Sirohi (2007) finds that
the government’s laissez-faire approach has resulted in a CDM market that is dominated by
un-derlying business interests. Because market forces dictate CDM project implementation, project
development is rarely directed towards the rural poor. In other words, CDM project developers
choose project locations to maximize profits.
[Figure 1 about here.]
2.3 Hypotheses
Building on the overview provided in the last two sections, we arrive at several empirically
testable hypotheses. The hypotheses relate climate mitigation potential and political uncertainty
to the implementation of CDM projects. Since mitigation potential is commonly analyzed in the
cross-national literature (Castro and Michaelowa, 2011; Dinar et al., 2011), it is natural to expect
it to shape project implementation under India’s liberal policy. Because political uncertainty has
not been analyzed in past studies, our results can inform future studies of the politics of the
state population, are controlled for in the empirical analysis.
Using state-year as the unit of analysis, we examine the role of sub-national state
character-istics on CDM project implementation. More specifically, we hypothesize that public electricity
generating capacity and the amount of industrial fixed capital, as indicators of mitigation
poten-tial, increase CDM project implementation. As to political uncertainty, we expect the
implemen-tation of CDM projects to decrease during election years.
First, we expect that electricity generation has an effect on CDM project implementation. In
practice, many CDM projects aim to reduce carbon emissions from specifically electricity
gener-ation.9 There are three reasons for this emphasis on electricity generation in the CDM. First, the
demand for carbon credits from CDM projects is highest among electricity generating utilities
from industrialized countries. In the European Union’s Emissions Trading Scheme (EU ETS),
for example, the energy sector alone accounts for more than 60% of all regulated emissions in
Europe (Ellerman and Buchner, 2007). Although the CDM does not specify any sector-specific
regulations, energy utilities are likely to invest in electricity generating CDM projects because of
the existing informational and technological experience and expertise. Second, electricity
gener-ation in itself is highly carbon-intensive, and thus has substantial potential for carbon reductions.
Finally, less developed countries often use inferior, or outdated, technologies to generate
elec-tricity. Hence, the existing inefficiencies make investment in electricity generating CDM projects
very attractive.
As discussed above, the distinction between private and public electricity generating
capac-ities is crucial in the Indian context. To empirically explore this difference, we estimate the
effects of private and public electricity generating capacity separately on the number of CDM
projects. Following Joseph’s (2010) analysis, the unprecedented rise in installed capacity of
pri-vately owned electricity generation units is the industrial sector’s response to unreliable
electric-ity production on the part of state-owned units. While inefficiencies in the public sector remain
high, the newly established private electricity sector has a much lower level of capacity, is less
prone to corruption, and is more efficient. Since CDM investment is most profitable when
ciencies are large, we expect that generation capacity in the more efficient private sector does not
affect the number of CDM projects, while that in the inefficient public electricity generation has
a positive association with the number of CDM projects. The explanation presented leads to the
two hypotheses that follow:
Hypothesis 1(private electricity generating capacity and project implementation). A state’s private
electricity generation does not have an effect on CDM project implementation in that state at a given time.
Hypothesis 2(public electricity generation and project implementation). The larger a state’s public
electricity generation, the higher is the number of CDM projects implemented in that state at a given time.
In addition to the discrepancy between private and public electricity generating capacity, we
hypothesize that states with a developed, industrial capital base should have a higher number of
CDM projects. A higher level of industrial, fixed capital implies greater capacity for industrial
activity, and a rise in industrial activity, in turn, results in higher levels of carbon emissions.
Industries, such as cement, ceramics, iron, steel, or glass, are energy- and carbon-intensive in
comparison to those in the agriculture or services sector. Therefore, a large industrial capital
base indicates that there is high potential for emissions reductions. The number of CDM projects
in a given Indian state is likely to be higher in industrialized states than in those with minimal
industrial development that rely heavily on agricultural production.
Hypothesis 3(industrial capital and project implementation). The larger a state’s industrial capital
base, the higher the number of CDM projects implemented in that state at a given time.
This is not to say that CDM investments under high levels of industrial capital are necessarily
driven by specific plans for carbon abatement. It is more plausible that the investments reflect
opportunities afforded by industrial production and growth, especially given the volatility of the
carbon credit price in international markets. We do not make claims about the priority ordering
of the CDM in the state government’s planning, but instead focus on the relationship between
industrial capital and opportunities for CDM projects more generally.
Finally, India’s laissez-faire approach implies that the lack of political mandate to develop the
strategically promote CDM in underdeveloped states. Since a considerable share of total CDM
projects is large-scale projects that involve wind farms or hydroelectric dams, investments are
only worthwhile given stable political and economic conditions.10 Since the implementation of
a CDM project may require a lot of time and political difficulties at any time during that period
can reduce the profitability of the effort, investors rationally anticipate electoral uncertainty and
try to avoid initiating projects at election time.
For example, consider India’s largest CDM project (CDM5760), a project approved in 2009
that supports methane capture from mining activities in West Bengal.11 This project seeks to
reduce more than 83 million tons of CO2 emissions over a period of ten years.12 Clearly, firms
would not be willing to invest in such large-scale projects when the political environment is
uncertain. In election years, politics are inherently subject to change. New governments could
be elected. Existing, favorable policies, such as subsidies or tax exemptions, could be reversed if
governmental priorities change during election years. Instead of implementing CDM projects in
election years, investors are inclined to postpone investment decisions until the political climate is
stable once again. Moreover, the electoral cycle could create administrative difficulties that could
slow down the approval process of CDM proposals on the part of state government agencies.
Such potential difficulties during election season may prompt investors to postpone the initiation
of CDM registration procedures. The theoretical explanation provided leads to the following
hypothesis:
Hypothesis 4 (state elections and project implementation). During election years, the number of
CDM projects implemented in a state is lower than that during other years.
In the section that follows, we describe how we test the four hypotheses that link private and
10Approximately one third of the CDM projects in our sample are classified as large-scale projects, while the rest is considered small-scale. In accordance with the official CDM guidance document, we classify projects as small based on the used methodology. Specifically, we use methodologies with the prefix, “AMS,” to categorize projects as small. Seehttp://www.cdmpipeline.org/publications/GuidanceCDMpipeline.pdf. Accessed June 11, 2012.
11For further details, see the project design document at http://cdm.unfccc.int/filestorage/Z/H/E/
ZHE76BG0Q4LO1XTYUV9F85WIJPCMRA/PDD%20GEECL.pdf?t=MzB8bTR3NmIxfDDK9-54G1mtewmOXEyf0Iek. Accessed May 31, 2012.
public electricity generating capacity, the amount of industrial, fixed capital, and election years
with CDM project development across Indian states.
3 Research Design
For our empirical analysis, we collect data on the number of CDM projects in 27 Indian states
for the years 2003-2011.13 The CDM data is provided by the CDM Pipeline14 in units of
state-year. In total, the dataset includes 231 observations and 2,178 CDM projects, so we have a
balanced panel.15 To conduct the analysis, we estimate negative binomial count regressions with
random effects. The purpose of our analysis is to examine how variation in the values of four
key explanatory variables (i.e., private and public electricity generating capacity, industrial fixed
capital, and election years) predicts the number of new CDM projects implemented in a given
year in each state.
3.1 Dependent Variable
The dependent variable in our analysis is the number of new CDM projects that are available
from the official CDM/JI Pipeline Database for a specific year in each of the 27 Indian states. As
Table 1 shows, this count varies considerably across states and over time. While there are very
few CDM projects in the earlier years (i.e., only one in 2003 and nine in 2004), the number rises
dramatically during the later years (i.e., 362 in 2010 and 391 in 2011). In addition to variation
across time, there is considerable variation across states. While the state of Maharashtra holds
the record for implementing 55 new projects in 2007, Arunachal Pradesh consistently does not
implement any projects in all the years except 2007 (i.e., when it has one project) and 2011 (i.e.,
when it has two projects). Projects are also clustered by region, with more than 700 projects
located in the southern regions and only 66 implemented in the northeastern region.
[Table 1 about here.]
13Overall, in India, there are 35 sub-national units, 28 states, and 7 Union Territories. Since we lack non-zero CDM project data for all Union Territories except Delhi (Andaman and Nicobar Islands, Chandigarh, Dadra and Nagar Haveli, Daman and Diu, Lakshadweep, and Pondicherry) and for two states (Mizoram and Nagaland), our sample consists of only 27 sub-national units. Seehttp://india.gov.in/knowindia/state_uts.php. Accessed May 31, 2012.
14Seehttp://www.cdmpipeline.org. Accessed December 31, 2011.
To account for the non-normal distribution of the dependent variable in our statistical
anal-ysis, we use a negative binomial count model. An alternative approach used with conventional
regression models is to construct the dependent variable, the total amount of CO2 emissions
re-ductions in a given state-year, as a continuous variable. The approach is inferior to our count data
approach for three reasons. First, around two-thirds of the CDM projects in our sample are
clas-sified as small projects. Using total abatement as a dependent variable would bias the analysis
towards large-scale projects. Second, emissions reductions are not yet realized for most projects,
but are only projected quantities. Hence, emissions reduction measures are subject to high
uncer-tainty compared to the undisputed measure of counts for implemented projects. Third, as shown
in the supplementary appendix, the number of CDM projects is highly correlated with the
ex-pected total number of Certified Emissions Reductions by 2020. In our sample, the five states
with the highest numbers of CDM projects (i.e., Tamil Nadu, Maharashtra, Gujarat, Karnataka,
and Rajasthan) account for 58% of the sample, and similarly, comprise 42% of expected carbon
emissions reductions by 2020.
Taking into account the systematic differences between renewable and non-renewable CDM
projects, we conduct a separate, empirical analysis on renewable projects (1,426 projects) and
on non-renewable projects (752 projects). This disaggregation is justified because our
explana-tory variables may affect CDM allocation differently due to geographical heterogeneity across
Indian states. Long rivers, strong winds, and many hours of sunshine make hydropower, wind,
or solar energy projects more likely in certain regions more than in others. Non-renewable
en-ergy projects, on the other hand, are not affected by these geographical characteristics. Because
pooling data would prevent us from accounting for these differences in the analysis, we test our
hypotheses separately for renewable and non-renewable projects. The results of the analysis are
discussed below.
3.2 Independent Variables
To test the four hypotheses, we first add an explanatory variable to operationalize each state’s
electricity generating capacity. To do this, we collected data on the installed capacity (megawatts)
Ministry of Power.16 The reports allow us to also disaggregate installed capacity by ownership
type. Specifically, we disaggregate the variable of electricity generation capacity into publicly and
privately owned utilities. This allows for a more meticulous analysis that differentiates between
state- and market-based investment choices. Since both variables are highly skewed to the right,
we logarithmize both variables before entering them to into our statistical model.17
Our third hypothesis is that a larger industrial capital base is more conducive to CDM
in-vestment in a given state-year. We measure this variable with data from the Annual Survey of
Industries, which is published by the Indian Ministry of Statistics and Programme
Implemen-tation since 1998.18 This survey provides data on fixed capital by state, a variable measured in
million rupees. To account for the non-normal distribution, we take the logarithm of this
vari-able. We also apply linear extrapolation for years after 2010 to avoid losing the 391 CDM projects
that were implemented in 2011.19
To operationalize our hypothesis on the influence of elections, we code an election year
vari-able.20 This is a binary indicator that scores one for each year in which elections take place in an
Indian state and zero otherwise.21 Overall, there are 28 state-level elections in our sample for the
years 2003-2011. During this time period in India, more than three state-level elections are called
per year.
3.3 Control Variables
While we prefer a simple econometric specification, we include additional models with four
state-level control variables to check for the robustness of our results. First, we include a logarithmic
measure of total population size to capture pure scale effects.22 Densely populated states are
16Seehttp://www.powermin.nic.in/reports/annual_report.htm. Accessed April 24, 2012.
17Distributions of privately and publicly owned electricity generating capacities can be found in the supplementary appendix.
18See http://mospi.nic.in/mospi_new/upload/asi/ASI_main.htm?status=1&menu_id=88. Accessed May 13, 2012.
19The supplementary appendix provides a histogram showing the distribution of the industrial capital base variable. To account for the fact that the capital base needs to be renewed over time, we also estimate regression models with both the level and the annual net change in the capital base included, without any consequences of our main results.
20Seehttp://eci.nic.in/eci_main1/ElectionStatistics.aspx. Accessed June 6, 2012.
21To avoid bias from potential anticipation and backlog effects from elections called at the beginning or the end of a year, we also estimate models with pre- and post-election year dummies, without any changes to our results.
22Population data come from the census of the Office of the Registrar General of India. See http://
more likely to attract more CDM projects simply because they are larger. Since population data
is only available for the years 2001 and 2011, we use linear interpolation for this variable to
increase the number of observations for our population variable. Controlling for size effects is
more important than the concern that interpolation may not be an accurate measure of population
size in a given state-year.
Second, we control for GDP per capita, a measure in units of thousand rupees at 2005 constant
prices.23 The inclusion of this control variable is necessary because wealthier states may offer a
more attractive investment environment. Since industrial capital is a source of wealth, the control
variable allows us to avoid conflating the effects of industrial capital with the effects of wealth. It
could also be the case that in states with a higher level of net wealth, the cheapest abatement
op-portunities may have already been realized, discouraging CDM project implementation in these
states. Although the direction of the effect of GDP per capita on CDM project implementation
is unclear, we control for the effects of state income. To account for the asymmetric distribution,
the logarithm of the GDP per capita variable is used.
Third, we add economic growth as a variable to capture change in economic performance
over time. We construct this control variable as the percentage change in GDP per capita relative
to that of the previous year, and the data comes from the same sources as those for the nominal
GDP per capita variable. Controlling for economic growth is important because states with
higher levels of economic growth can obtain more CDM projects than those with slower rates
of growth. To avoid conflating the impact of economic growth on CDM project implementation
with the systematic effects of our hypotheses, we add economic growth to only select econometric
specifications.
Fourth, we control for each state’s level of public debt as a percentage of the state’s GDP.24
Public debt measures how well a state is managed. In other words, it is indicative of the
stabil-ity of the CDM investment environment provided by the state. Including a public debt control
allows us to account for state-year differences in economic governance across Indian states. The
23Data are from the Directorate of Economics Statistics of the respective state governments. See http://
planningcommission.nic.in/data/datatable/0904/tab_109.pdf. Accessed April 25, 2012.
24Data are from the Databook for DCH. Seehttp://planningcommission.nic.in/data/datatable/0904/tab_115.
supplementary appendix provides histograms illustrating the distribution of all our control
vari-ables.
To account for the effects of time trends, all our models include year fixed effects. The year
indicators also account for the electoral victory of the Indian National Congress over BJP in 2004.
To account for regional differences arising from geographic heterogeneity and other unobserved
state characteristics that may affect the distribution of CDM project implementation, we use
zonal (i.e., region) fixed effects.25 For this, we classify all Indian subnational units under six
Zonal Councils, as established in the 1956 States Reorganization Act and the 1972 North Eastern
Council Act.26
Table 2 shows the summary statistics for all our dependent, independent, and control
vari-ables. We find that there is considerable variation across observations in our panel dataset. Most
importantly, the dependent variable is far from being normally distributed. Instead, it is highly
skewed with a mean of 9.33, a standard deviation of 13.92, and minimum and maximum values
of zero and 80. Our negative binomial count model can account for this data structure.
[Table 2 about here.]
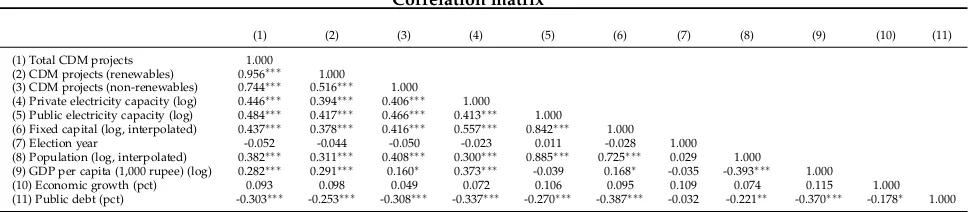
We present a correlation matrix of all our variables in Table 3. The bivariate correlations
show two remarkable facts. First, electricity generating capacity, both private and public, and
industrial capital base are positively correlated with our dependent variables of total, renewable,
and non-renewable CDM projects; in contrast, the election year variable has a negative influence.
All these effects are thus in line with our expectations. Second, the private and public electricity
generation variables are significantly correlated, but only at a level ofr= +0.446.
25In a robustness check, we also estimate our main models with state fixed effects instead of regional ones, without any changes to our findings.
26Specifically, we have the Northern Zonal Council (Chandigarh, Delhi, Haryana, Himachal Pradesh, Jammu and Kashmir, Punjab, Rajasthan), the Central Zonal Council (Chhattisgarh, Madhya Pradesh, Uttarakhand, Ut-tar Pradesh), the Eastern Zonal Council (Bihar, Jharkhand, Orissa, and West Bengal), the Western Zonal Coun-cil (Dadra and Nagar Haveli, Daman and Diu, Goa, Gujarat, Maharashtra), the Southern Zonal CounCoun-cil (Andhra Pradesh, Karnataka, Kerala, Pondicherry, and Tamil Nadu), and the North Eastern Council (Arunachal Pradesh, Assam, Manipur, Meghalaya, Mizoram, Nagaland, Sikkim, and Tripura). The Indian Union Territories Andaman and Nicobar Islands and Lakshadweep are not part of any of India’s six official Zonal Councils, so they are not listed in Table 1. This classification comes from the Ministry of Home Affairs of the Indian Government. See
[Table 3 about here.]
3.4 Statistical Model
We estimate a negative binomial count model with random effects. This is a two-level model
that allows the distribution of the error term to vary across the 27 subnational units in our
sample. A series of likelihood ratio tests confirms that random effects are justified, given that
the null hypothesis of identical error distributions across Indian states can be rejected. We also
use the Vuong test to check for zero inflation (Vuong, 1989). Using population and year as the
zero-inflation variables, the test statistic allows us to reject the null hypothesis of zero inflation.
We cannot include a lagged dependent variable in the estimation since the estimation is only
consistent under exponential growth in the dependent variable (Brandt et al., 2000).
4 Results
We first report findings from our main model with the total CDM project count as the dependent
variable. Then, we present the results from when we disaggregate the analysis by project type,
using the number of renewable and non-renewable CDM projects as dependent variables. For
our key findings, we present substantive effects.
4.1 Main Findings
Table 4 shows regression results for five count models with random effects, including all CDM
projects hosted by the 27 Indian states in our sample. While our first model only includes our
four explanatory variables (i.e., private and public electricity capacity, fixed capital base, and an
election year dummy), models (2)-(5) differ with respect to the set of control variables. We extend
our set of control variables from only population (model (2)) to GDP per capita (model (3)),
economic growth (model (4)), and public debt (model (5)). As discussed above, all our models
have year fixed-effects and zonal fixed-effects.
For our main results, we find a consistent pattern: industrial capital base has a positive and
highly significant effect on CDM allocation, while political uncertainty, operationalized by our
election year dummy, decreases the number of implemented CDM projects. Public electricity
models, though the coefficient is only statistically significant in one. This lack of robustness
could reflect the fact that some public generation capacity, such as large hydroelectric facilities,
may not offer opportunities for the CDM. In stark contrast, the coefficients for private electricity
generation capacity are tiny and never statistically significant. This not only sheds light on the
systematically different effects of state-based compared to market-based electricity generation
in India, but also provides tentative support to our political-economic explanation for this
find-ing. Higher inefficiencies in the public electricity sector allow for more profitable investment in
climate mitigation, and thus CDM project implementation increases with increased generation
capacity in state-owned utilities.
[Table 4 about here.]
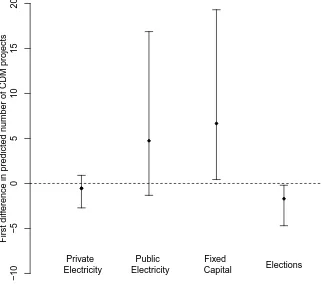
Figure 2 illustrates the substantive effects for our main explanatory variables from model (1)
(King, Tomz, and Wittenberg, 2000). All simulations of these substantive effects are based on
1,000 draws from a multivariate normal distribution. For continuous variables, we consider a
change from the mean to one standard deviation above the mean, while for the election year
dummy we increase the binary indicator from zero to one.
[Figure 2 about here.]
In line with our regression results, the strongest marginal effect is detected for industrial
capital base. On average, a one standard deviation increase above the mean increases the
num-ber of CDM projects by 6.67, with 19.30 and 0.43 as lower and upper bounds, respectively. The
marginal effect of public electricity generating capacity is only slightly smaller (average increase
of 4.74), with somewhat larger confidence bounds of 16.87 and -1.31. The expected effect of
private electricity generation capacity is almost exactly zero, and thus also not statistically
sig-nificant. Finally, election years decrease the mean number of CDM projects by -1.69, where -0.19
and -4.68 are the boundaries of the 95% confidence interval.
In summary, our statistical analysis confirms our four hypotheses. In our sample of 27 Indian
states and 2,178 CDM projects, higher public electricity generating capacity and a larger
cap-tured by the election year variable, negatively affects investment conditions, and thus, reduces
the number of hosted CDM projects. Consistent with this hypothesis, an additional analysis
shows that the negative effect of political uncertainty is even exacerbated in those election years
in which political competition is high, as indicated by a comparatively small winning margin.
Our analysis also points to systematic differences between private and public electricity
gener-ating capacity. This finding deserves particular attention that merits future research. From a
cross-country perspective, it is interesting to examine if this difference is equally applicable to
other contexts as well.
To examine the robustness of our results, we conduct five additional tests27. First, we run
the negative binomial models with random effects using three different independent variables:
electricity transmission and distribution losses (%) and two types of controls for corruption, that
is the number of corruption cases and data from Transparency International’s (2005) corruption
index for India.28 The results remain virtually unchanged. Second, we estimate our models
without the observations for the year 2011. Many of the independent variables have observations
for 2011 that were derived from linear extrapolation; for example, fixed capital, one of our main
explanatory variables, is extrapolated beyond 2010. By excluding the year 2011 from the
analy-sis, we can confirm our results to be robust without that specified year. Indeed, the results are
generally stronger when the year 2011 is excluded. Third, as CDM project allocation is shaped
by geographical and physical considerations, that is renewable energy potential, in particular,
we control for renewable potential from solar, hydroelectricity, and wind sources, without any
changes to our main findings. Fourth, we include a control variable that accounts for CDM
promotion policies at the subnational level. Finally, we examine whether party cohesion
be-tween the federal government and state-level governments matters for the distribution of CDM
projects across Indian states. Our results remain unaffected in both additional checks, as neither
27All estimation results can be found in the supplementary appendix.
promotion policies nor partisanship is found to influence CDM allocation.
4.2 Disaggregation by Project Type
In Table 5, we show the regression results for the same five count models as before, but only
considering the 1,426 renewable projects in our sample. We disaggregate our analysis to explore
differences across project types, i.e., across renewable and non-renewable CDM projects. While
the positive effects that we find for public electricity generating capacity and industrial capital
base attenuate in our reduced sample, the negative effect of political uncertainty on renewable
CDM project remains strong.29
[Table 5 about here.]
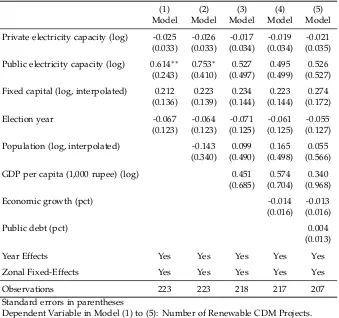
To examine the impact of our explanatory variables on non-renewable CDM project allocation,
we re-estimate our five negative binomial count models for 752 non-renewable projects in our
sample. Table 6 shows the estimation results. Compared to our previous findings, for
non-renewable CDM projects, political uncertainty does not seem to matter, at least not at statistically
significant levels. However, a state’s industrial capital base and public electricity generating
capacity increase CDM project implementation in a given state-year.30
[Table 6 about here.]
In summary, we find a consistent pattern in our empirical analysis. In the full sample, public
electricity generating capacity and fixed industrial capital base have a positive effect on the
num-ber of implemented CDM projects. In contrast, political uncertainty discourages the allocation
of CDM projects. Interestingly, the noted effects vary according to project type. In the
sam-ple with only renewable CDM projects, the election year effect is the only explanatory variable
with a statistically significant coefficient. In line with our argument on political uncertainty, it is
not unlikely to assume that renewable energy projects are more dependent on political support.
The development of new technologies and the deployment of (decentralized) renewable energy
production are commonly subsidized by governments. This may, in part, explain why
renew-able CDM project implementation is more responsive to political uncertainty than non-renewrenew-able
project development.
In the sample with only non-renewable energy projects, public electricity generating capacity
has a limited positive effect on project count, and the coefficients are not statistically significant.
Additionally, fixed capital has a strong, positive association with CDM project implementation.
The correlation matrix in Table 3 above shows there are stronger correlations in size between
electricity generating capacity and capital base with non-renewable energy projects than with
renewable ones. Since the correlation between the number of renewable energy projects and
project size (r= +0.952) is much higher than that between the number of non-renewable energy
and small projects (r = +0.578)31, the larger average project size of non-renewable projects may
explain why public electricity generating capacity and the fixed capital base are more important
for this type of project.
5 Conclusion
In India, thousands of CDM projects have reduced carbon dioxide emissions at a low cost. Due to
the central government’s liberal approach to the CDM, project implementation in India has been
largely driven by business opportunities. At the sub-national level, this has produced
consider-able variation across states and over time. In this article, we have analyzed the determinants of
CDM project implementation in Indian states from 2003-2011. Our main premise is that India’s
liberal approach to the CDM emphasizes the importance of climate mitigation opportunities,
while increasing the salience of political factors. In contrast to China, India does not use the
CDM to promote economic development in less developed areas.
Our findings corroborate these hypotheses. Both public electricity generation and industrial
capital have large, positive effects on CDM project implementation. This is consistent with the
central role of mitigation potential in explaining the distribution of CDM projects under India’s
liberal policy framework. However, private electricity generation is not associated with CDM
project implementation. A potential explanation for this null finding is the public sector’s
nance in Indian electricity generation and the private sector’s superior efficiency relative to that
of the public sector. Finally, CDM projects are rarely proposed during election years.
Our findings emphasize the need for more research on sub-national variation in climate
pol-icy. Several researchers have found that sub-national variation is equally, if not more, important
than cross-national variation (Schreurs, 2008; Andonova and Mitchell, 2010). However, there
are few quantitative studies that explain sub-national variation within large countries like
In-dia. Further empirical analysis on variation at the sub-national level promises large payoffs. For
example, scholars should investigate how the importance of mitigation potential as a covariate
of CDM projects within countries depends on national institutions. Our findings concerning
the importance of sub-national elections in India also highlight the importance of incorporating
sub-national politics into models of CDM implementation within countries. At the same time,
we recognize that, especially in the early years of the CDM, the methodology for establishing a
baseline for business-as-usual emissions has suffered from certain problems. Therefore, it would
be useful to evaluate the environmental quality of India’s CDM projects.
For policymakers in India and elsewhere, our study also offers some useful suggestions.
While India’s laissez-faire approach to the CDM can be justified as attractive to project
develop-ers, it carries the hidden cost of neglecting underdeveloped states. Without centralized
coordina-tion, the CDM cannot allow the federal government to promote sustainable development in states
that would need it the most. While China’s policymakers have implemented policies that allow
the country to use the CDM to promote economic development in the country’s underdeveloped
Western provinces (Schroeder, 2009), India has not adopted this strategy. India and other
devel-oping countries can maximize the developmental benefits of the CDM by adopting coordinated
national policies that promote project implementation in less developed areas. For example,
na-tional governments could offer incentives to CDM project developers that locate their projects in
less industrialized regions. Similarly, national governments could reduce the transaction costs of
project implementation in less developed areas by investing in capacity building. For example,
this strategy could build on lessons from China’s CDM Service Center model (Schroeder, 2009:
References
Andonova, Liliana B., and Ronald B. Mitchell. 2010. “The Rescaling of Global Environmental Politics.”Annual Review of Environment and Resources35 (1): 255–282.
Arora, D.S., Sarah Busche, Shannon Cowlin, Tobias Engelmeier, Hanna Jaritz, Anelia Milbrandt, and Shannon Wang. 2010. “Indian Renewable Energy Status Report: Background Report for DIREC 2010.” National Renewable Energy Laboratory, NREL/TP-6A20-48948.
Bayer, Patrick, Johannes Urpelainen, and Jeremy Wallace. 2013. “Who Uses the Clean Develop-ment Mechanism? An Empirical Analysis of Projects in Chinese Provinces.” Global Environ-mental Change23 (2): 512–521.
Benecke, Gudrun. 2009. “Varieties of Carbon Governance: Taking Stock of the Local Carbon Market in India.” Journal of Environment and Development18 (4): 346–370.
Brandt, Patrick T., John T. Williams, Benjamin O. Fordham, and Brian Pollins. 2000. “Dynamic Modeling for Persistent Event-Count Time Series.” American Journal of Political Science 44 (4): 823–843.
Castro, Paula, and Axel Michaelowa. 2011. “Would Preferential Access Measures Be Sufficient to Overcome Current Barriers to CDM Projects in Least Developed Countries?” Climate and Development3 (2): 123–142.
Curnow, Paul, and Glenn Hodes. 2009. Implementing CDM Projects: A Guidebook to Host Country Legal Issues. Roskilde, Denmark: UNEP Risoe Centre.
Dechezleprêtre, Antoine, Matthieu Glachant, and Yann Ménière. 2008. “The Clean Development Mechanism and the International Diffusion of Technologies: An Empirical Study.”Energy Policy
36 (4): 1273–1283.
Dinar, Ariel, Shaikh Mahfuzur Rahman, Donald F. Larson, and Philippe Ambrosi. 2011. “Lo-cal Actions, Global Impacts: International Cooperation and the CDM.” Global Environmental Politics 11 (4): 108–133.
Ellerman, Denny A., and Barbara K. Buchner. 2007. “The European Union Emissions Trading Scheme: Origins, Allocation, and Early Results.” Review of Environmental Economics and Policy
1 (1): 66–87.
Erlewein, Alexander, and Marcus Nüsser. 2011. “Offsetting Greenhouse Gas Emissions in the Himalaya: Clean Development Dams in Himachal Pradesh, India.” Mountain Research and De-velopment31 (4): 293–304.
Fuhr, Harald, and Markus Lederer. 2009. “Varieties of Carbon Governance in Newly Industrial-izing Countries.”Journal of Environment and Development18 (4): 327–345.
Ganapati, Sukumar, and Liguang Liu. 2008. “The Clean Development Mechanism in China and India: A Comparative Institutional Analysis.” Public Administration and Development 28: 351– 362.
Indian Ministry of Environment and Forests. 2001. “India: State of the Environment 2001.” Joint Report with UNEP and TERI.
Joseph, Kelli L. 2010. “The Politics of Power: Electricity Reform in India.”Energy Policy 38 (1): 503–511.
King, Gary, Michael Tomz, and Jason Wittenberg. 2000. “Making the Most of Statistical Analyses: Improving Interpretation and Presentation.”American Journal of Political Science44 (2): 341–355.
Markandya, Anil, and Kirsten Halsnaes. 2002. Climate Change and Sustainable Development Prospects for Developing Countries. London, UK: Earthscan Publications.
Mathy, Sandrine, Jean-Charles Hourcade, and Christophe de Gouvello. 2001. “Clean Develop-ment Mechanism: Leverage for DevelopDevelop-ment?” Climate Policy1 (2): 251–268.
Michaelowa, Axel, and Pallav Purohit. 2007. “Additionality Determination of Indian CDM Projects: Can Indian CDM Project Developers Outwit the CDM Executive Board.” Climate Strategies Discussion Paper CDM-1.
Newell, Peter. 2009. “Varieties of CDM Governance: Some Reflections.” Journal of Environment and Development 18 (4): 425–435.
Popp, David. 2011. “International Technology Transfer, Climate Change, and the Clean Develop-ment Mechanism.”Review of Environmental Economics and Policy5 (1): 131–152.
Schreurs, Miranda A. 2008. “From the Bottom Up: Local and Subnational Climate Change Politics.”Journal of Environment and Development17 (4): 343–355.
Schroeder, Miriam. 2009. “Varieties of Carbon Governance: Utilizing the Clean Development Mechanism for Chinese Priorities.”Journal of Environment and Development18 (4): 371–394.
Shalini Randeria. 2003. “Between Cunning States and Unaccountable Institutions: Social Move-ments and rights of Local Communities to Common Property Resources.” WZB Discussion Paper Nr. SP IV 2003-502.
Sirohi, Smita. 2007. “CDM: Is It a ‘Win-Win’ Strategy for Rural Poverty Alleviation in India?”
Climatic Change84 (1): 91–110.
Tongia, Rahul. 2003. “The Political Economy of India Power Sector Reforms.” Stanford University, Program on Energy and Sustainable Development, Working Paper 4.
Transparency International. 2005. India Corruption Study 2005. New Delhi: Centre for Media Studies.
250 − 350 150 − 250 50 − 150 0 − 50 No data
CDM Projects in India
First Differences in Predicted Number of CDM Projects
−10
−5
0
5
10
15
20
First diff
erence in predicted n
umber of CDM projects
Private Electricity
Public Electricity
Fixed
[image:27.612.130.455.219.511.2]Capital Elections
Distribution of CDM projects by region, state, and year
# State Years Sum
2003 2004 2005 2006 2007 2008 2009 2010 2011
Northern Zonal Council 357
1 Delhi 0 0 0 0 3 2 3 3 1 12
2 Chandigarh na na na na na na na na na na
3 Haryana 0 0 0 3 5 7 7 6 4 32
4 Himachal Pradesh 0 2 2 14 8 8 17 16 11 78
5 Jammu and Kashmir 0 0 0 0 2 1 1 1 0 5
6 Punjab 0 0 13 10 4 10 4 14 10 65
7 Rajasthan 0 1 23 14 9 6 20 43 49 165
Central Zonal Council 307
8 Chhattisgarh 0 0 11 21 17 12 8 7 15 91
9 Madhya Pradesh 0 0 4 3 6 8 10 10 15 56
10 Uttarakhand 0 0 0 8 10 6 7 6 6 43
11 Uttar Pradesh 0 0 12 35 16 25 7 14 8 117
Eastern Zonal Council 166
12 Bihar 0 0 1 2 3 0 0 1 2 9
13 Jharkhand 0 0 1 1 4 2 1 3 2 14
14 Orissa 0 0 6 7 15 12 13 11 8 72
15 West Bengal 0 0 11 8 14 9 9 9 11 71
Western Zonal Council 543
16 Dadra and Nagar Haveli na na na na na na na na na na
17 Daman and Diu na na na na na na na na na na
18 Goa 0 0 1 0 1 0 0 1 0 3
19 Gujarat 1 0 14 22 26 56 34 34 61 248
20 Maharashtra 0 0 13 34 55 61 40 50 39 292
Southern Zonal Council 736
21 Andhra Pradesh 0 1 30 25 25 24 3 22 27 157
22 Karnataka 0 3 26 38 28 38 39 23 33 228
23 Kerala 0 0 1 0 5 6 4 3 1 20
24 Pondicherry na na na na na na na na na na
25 Tamil Nadu 0 2 22 28 40 53 51 55 80 331
Northeastern Zonal Council 66
26 Arunachal Pradesh 0 0 0 0 1 0 0 0 2 3
27 Assam 0 0 0 3 2 4 1 2 2 14
28 Manipur 0 0 1 0 1 0 13 14 12 41
29 Meghalaya 0 0 0 1 0 0 1 1 0 3
30 Mizoram na na na na na na na na na na
31 Nagaland na na na na na na na na na na
32 Sikkim 0 0 0 1 0 2 0 2 2 7
33 Tripura 0 0 0 0 0 0 0 1 0 1
[image:28.612.92.523.78.621.2]Total 1 9 192 278 300 352 293 362 391 2,178
Summary statistics
count mean sd min max Total CDM projects 207 9.63 14.06 0.00 80.00 CDM projects (renewables) 207 6.19 10.96 0.00 73.00 CDM projects (non-renewables) 207 3.43 4.81 0.00 26.00 Private electricity capacity (log) 207 3.49 3.25 0.00 8.56 Public electricity capacity (log) 207 7.85 1.23 5.01 9.70 Fixed capital (log, interpolated) 207 11.28 2.37 1.23 14.35
Election year 207 0.20 0.40 0.00 1.00
[image:29.612.146.460.76.235.2]Population (log, interpolated) 207 10.16 1.31 6.40 12.20 GDP per capita (1,000 rupee) (log) 207 3.36 0.48 1.95 4.72 Economic growth (pct) 207 6.78 4.25 -8.13 29.25 Public debt (pct) 207 35.85 13.74 14.20 77.46
Correlation matrix
(1) (2) (3) (4) (5) (6) (7) (8) (9) (10) (11)
(1) Total CDM projects 1.000
(2) CDM projects (renewables) 0.956∗∗∗ 1.000
(3) CDM projects (non-renewables) 0.744∗∗∗ 0.516∗∗∗ 1.000
(4) Private electricity capacity (log) 0.446∗∗∗ 0.394∗∗∗ 0.406∗∗∗ 1.000
(5) Public electricity capacity (log) 0.484∗∗∗ 0.417∗∗∗ 0.466∗∗∗ 0.413∗∗∗ 1.000
(6) Fixed capital (log, interpolated) 0.437∗∗∗ 0.378∗∗∗ 0.416∗∗∗ 0.557∗∗∗ 0.842∗∗∗ 1.000 (7) Election year -0.052 -0.044 -0.050 -0.023 0.011 -0.028 1.000 (8) Population (log, interpolated) 0.382∗∗∗ 0.311∗∗∗ 0.408∗∗∗ 0.300∗∗∗ 0.885∗∗∗ 0.725∗∗∗ 0.029 1.000
[image:30.612.72.556.76.182.2](9) GDP per capita (1,000 rupee) (log) 0.282∗∗∗ 0.291∗∗∗ 0.160∗ 0.373∗∗∗ -0.039 0.168∗ -0.035 -0.393∗∗∗ 1.000 (10) Economic growth (pct) 0.093 0.098 0.049 0.072 0.106 0.095 0.109 0.074 0.115 1.000 (11) Public debt (pct) -0.303∗∗∗ -0.253∗∗∗ -0.308∗∗∗ -0.337∗∗∗ -0.270∗∗∗ -0.387∗∗∗ -0.032 -0.221∗∗ -0.370∗∗∗ -0.178∗ 1.000
Main regression results
(1) (2) (3) (4) (5)
Model Model Model Model Model Private electricity capacity (log) -0.019 -0.026 -0.028 -0.028 -0.013 (0.030) (0.031) (0.030) (0.030) (0.030) Public electricity capacity (log) 0.363 0.681∗ 0.470 0.483 0.467
(0.244) (0.363) (0.495) (0.497) (0.451) Fixed capital (log, interpolated) 0.239∗∗ 0.258∗∗ 0.270∗∗ 0.274∗∗ 0.279∗∗ (0.113) (0.113) (0.121) (0.122) (0.132) Election year -0.236∗∗ -0.228∗∗ -0.209∗∗ -0.214∗∗ -0.211∗∗
(0.105) (0.104) (0.101) (0.103) (0.100) Population (log, interpolated) -0.322 -0.116 -0.142 0.144
(0.276) (0.464) (0.473) (0.484) GDP per capita (1,000 rupee) (log) 0.441 0.381 1.142
(0.822) (0.847) (0.909)
Economic growth (pct) 0.004 0.008
(0.014) (0.014)
Public debt (pct) 0.032∗∗∗
(0.011)
Year Effects Yes Yes Yes Yes Yes
Zonal Fixed-Effects Yes Yes Yes Yes Yes
Observations 223 223 218 217 207
Standard errors in parentheses
Dependent Variable in Model (1) to (5): Total Number of CDM Projects.
[image:31.612.123.488.79.383.2]∗ p<0.10,∗∗p<0.05,∗∗∗p<0.01
Main regression results for renewable CDM projects
(1) (2) (3) (4) (5)
Model Model Model Model Model Private electricity capacity (log) 0.013 0.008 -0.002 0.002 0.011
(0.043) (0.044) (0.043) (0.043) (0.041) Public electricity capacity (log) 0.269 0.596 0.423 0.488 0.675
(0.355) (0.521) (0.710) (0.694) (0.520) Fixed capital (log, interpolated) 0.119 0.123 0.170 0.203 0.111
(0.155) (0.154) (0.174) (0.174) (0.152) Election year -0.373∗∗ -0.367∗∗ -0.349∗∗ -0.397∗∗ -0.390∗∗
(0.160) (0.159) (0.158) (0.165) (0.152) Population (log, interpolated) -0.300 -0.218 -0.368 0.088
(0.352) (0.682) (0.668) (0.527) GDP per capita (1,000 rupee) (log) 0.064 -0.387 0.862
(1.367) (1.338) (0.942)
Economic growth (pct) 0.027 0.038∗
(0.022) (0.021)
Public debt (pct) 0.044∗∗∗
(0.014)
Year Effects Yes Yes Yes Yes Yes
Zonal Fixed-Effects Yes Yes Yes Yes Yes
Observations 223 223 218 217 207
Standard errors in parentheses
Dependent Variable in Model (1) to (5): Number of Renewable CDM Projects.
[image:32.612.120.487.82.385.2]∗ p<0.10,∗∗p<0.05,∗∗∗p<0.01
Main regression results for non-renewable CDM projects
(1) (2) (3) (4) (5)
Model Model Model Model Model Private electricity capacity (log) -0.025 -0.026 -0.017 -0.019 -0.021 (0.033) (0.033) (0.034) (0.034) (0.035) Public electricity capacity (log) 0.614∗∗ 0.753∗ 0.527 0.495 0.526
(0.243) (0.410) (0.497) (0.499) (0.527) Fixed capital (log, interpolated) 0.212 0.223 0.234 0.223 0.274
(0.136) (0.139) (0.144) (0.144) (0.172) Election year -0.067 -0.064 -0.071 -0.061 -0.055 (0.123) (0.123) (0.125) (0.125) (0.127) Population (log, interpolated) -0.143 0.099 0.165 0.055
(0.340) (0.490) (0.498) (0.566) GDP per capita (1,000 rupee) (log) 0.451 0.574 0.340
(0.685) (0.704) (0.968)
Economic growth (pct) -0.014 -0.013
(0.016) (0.016)
Public debt (pct) 0.004
(0.013)
Year Effects Yes Yes Yes Yes Yes
Zonal Fixed-Effects Yes Yes Yes Yes Yes
Observations 223 223 218 217 207
Standard errors in parentheses
Dependent Variable in Model (1) to (5): Number of Renewable CDM Projects.
[image:33.612.137.476.81.399.2]∗ p<0.10,∗∗ p<0.05,∗∗∗ p<0.01