Rochester Institute of Technology
RIT Scholar Works
Theses
Thesis/Dissertation Collections
5-1-2005
Accurate electronic sphygmomanometer
Darshan Rane
Follow this and additional works at:
http://scholarworks.rit.edu/theses
This Thesis is brought to you for free and open access by the Thesis/Dissertation Collections at RIT Scholar Works. It has been accepted for inclusion in Theses by an authorized administrator of RIT Scholar Works. For more information, please [email protected].
Recommended Citation
Rochester Institute of Technology
Thesis submitted to the faculty of
College of Imaging Artsand Sciences
in candidacy for the degree of
Master of Fine Arts in Industrial Design.
Accurate Electronic Sphygmomanometer
Darshan Rane
School of Design
Graduate Industrial Design MFA Program
Thesis Approvals
Chief Advisor
Prof. David Morgan
Date:
Associate Advisor:
Prof. Stan Rickel
Date:
Associate Advisor:
Dr. lames Taylor
Date:
School of Design Chairperson:
Patti l. Lachance
Date:
David Morgan
Stan Rickel
James B. Taylor
1'1
AA1
LOD5
Patti J. Lachance
Thesis/Dissertation Author Permission Statement
Title of thesis or dissertation: Ac(. /,/ UJ
re
Name of author: ______ ~1<~C\~~Ke~"
__
~IK3~~~52Lhuaa¥)LL __ 2P~·~ ______________________ ___Degree: Ylobta
ti
FI'V""\e.. Ay-r~ Program: \V\cLushi
Ci I 1J)e£,(;9Y> College: C · i, A -5 ·I understand that I must submit a print copy of my thesis or dissertation to the RIT Archives, per current RIT guidelines for the completion of my degree. I hereby grant to the Rochester Institute of Technology and its agents the non-exclusive license to archive and make accessible my thesis or dissertation in whole or in part in all forms of media in perpetuity. I retain all other ownership rights to the copyright of the thesis or dissertation. I also retain the right to use in future works (such as articles or books) all or part of this thesis or dissertation.
Print Reproduction Permission Granted:
I, Darshcwl QC\ne.. , hereby grant permission to the Rochester Institute Technology to reproduce my print thesis or dissertation in whole or in part. Any reproduction will not be for commercial use or profit.
Darshan Rane
Signature of Author: ___________________________________ Date: 05 -:2 I - 05
Print Reproduction Permission Denied:
I, , hereby deny permission to the RIT Library of the Rochester Institute of Technology to reproduce my print thesis or dissertation in whole or in part.
Signature of Author: ___________________________________ Date: ________ _
Inclusion in the
RITDigital Media Library Electronic Thesis
&Dissertation (ETD) Archive
I, 1)afSVll3Y\
RaV'\e...
,
additionally grant to the Rochester Institute of Technology Digital Media Library (RIT DML) the non-exclusive license to archive and provide electronic access to my thesis or dissertation in whole or in part in all forms of media in perpetuity.I understand that my work, in addition to its bibliographic record and abstract, will be available to the world-wide community of scholars and researchers through the RIT DML. I retain all other ownership rights to the copyright of the thesis or dissertation. I also retain the right to use in future works (such as articles or books) all or part of this thesis or dissertation. I am aware that the Rochester Institute of Technology does not require registration of copyright for ETDs.
I hereby certify that, if appropriate, I have obtained and attached written permission statements from the owners of each third party copyrighted matter to be included in my thesis or dissertation. I certify that the version I submitted is the same as that approved by my committee.
Darshan Rane
Date. 'O
S-
2.1-D~
(ii)
Acknowledgments
This thesis challenged my capabilities in all terms. Standing up to this
challenge has been extreme pleasure every moment; however it would be
an ungrateful act notto thank people who have been there for me during
the time to assist me whenever I cried HELP!!!
Prof. David Morgan, thank you. You have been here every minute
during the completion ofthesis. Prof. Stan Rickel. Thank you for busting
my chops and inspiring me throughout. (I know; there is so much that
can be changed even now!) Prof. Jim Taylor. The insights you gave
were priceless. Mike Rufo of DPT Inc., for providing the super SLA
model.
But how can I forget those people who have seen the growth ofthis
process during its every breath. I thank
-Jung Guen Tak, for constantly inspiring me and instilling confidence in
me and my ideas.
Matt Abbondanzio, for answering my every question.
Pratima Bijjala, for FLASH-full insights.
Soo Jung Lee, for staying up in the studio every night with me.
Yeon Sung Yeon, for colorful insights.
Also a word ofthanks to all those people who thought I could never do
this. You have fueled me the most.
There are more names that could be added, but for the space.
(Hi)
CONTENTS
ACKNOWLEDGEMENTS ||
LIST OF ILLUSTRATIONS iv
Chapter
1. INTRODUCTION 1
How is blood pressure measured?
2. ERRORS IN BLOOD PRESSURE MEASUREMENT 5
Errors associated with the observer
Errors associated with the instrument itself
Errors associated with cuff size
3. METHODOLOGY 13
Data Collection
Design Development
Final Design
Human Interface Development
Final Design of HI
Computer Aided Design
4. HOW TO USE SPIGGY? 29
5. HOW DOES SPIGGY HELP? 31
6. OTHER ADVANTAGES OF SPIGGY 34
7. CONCLUSION 36
(iv)
LIST OF ILLUSTRATIONS
Figure Page
1 Typical blood pressure graph plotted by a human heart 2
2 Typical set-up of human blood pressure measurement 3
3 Conventional mercury sphygmomanometer 8
4 Aneroid sphygmomanometer 9
5 Electronic Sphygmomanometer 10
6 Typical cuff used during human blood pressure measurement 11
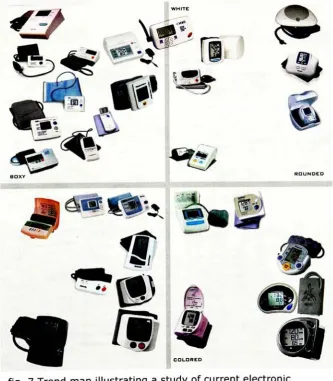
7 Trend map illustrating a study of current electronic
sphygmomanometers available in the market 14
8 Mind map that was created to develop new ideas for accurate
electronic sphygmomanometer 15
9 Preliminary rough sketches to brainstorm ideas 16
10 Preliminary rough sketches to brainstorm ideas 17
11 Preliminary rough sketches to brainstorm ideas 17
12 Preliminary rough sketches to brainstorm ideas 18
13 3D Sketch models made using yellow foam or Styrofoam 20
14 3D Sketch models made using yellow foam or Styrofoam 20
15 Sketches to illustrate form development ofthe product and its
accessories 21
16 3D sketch models developed to understand assembly of various
accessories 22
17 Sketches for developing Human Interface ofthe electronic
(v)
18 Sketches for
developing
Human Interface ofthe electronicsphygmomanometer 24
19 Final HI design 25
20 Computer generated main body of Spiggy
-the new Accurate
Electronic Sphygmomanometer 26
21 Physical model ofthe conceptual Accurate Electronic
Sphygmomanometer 27
22 Physical models ofSpiggy and its accessories demonstrating the
purpose and functions of each 28
Chapter 1
INTRODUCTION
An odyssey towards making of accurate sphygmomanometer began
with a small talk with Dr. Sagar, a resident doctor at Rochester General
Hospital, Rochester, NY. The small talk turned into a detailed question and
answer session that paved its way to the most revealing talk I ever had. The
factthat most ofthe electronic blood pressure monitors available in the
market, including the ones used in hospitals have accuracy issues related
with them, surprised me and made me think ofthe risks involved in such
cases.
This would be the right point to investigate what is blood pressure and
why is it required to measure in human beings.
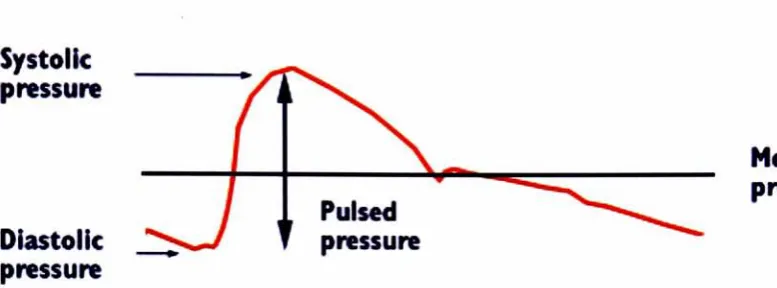
Blood pressure is the force exerted by the blood on an area of wall of
artery as it is pushed through the circulatory system. During the course of
the cardiac cycle, the arterial blood pressure is constantly changing. The
highest pressure in the cycle is recorded when the heart beats. This pressure
is also called the Systolic blood pressure. Between the heartbeats is
The systolic number is always stated first and the diastolic number listed
Systolic
pressure
Pulsed
[image:10.505.39.428.113.257.2]Diastolic
J^>/
T
pressure pressurefig. 1 Typical graphic representation ofsystolicand diastolic pressures
next. E.g.: 132/77 (132 over 77) Systolic =
132, Diastolic = 77.
Fig. 1 shows the 2 pressures graphically.
Mean
pressure
The measurement of blood pressure is one ofthe most common and most
important diagnostic procedures in the diagnosis of various heart related
disorders, hypertension being the most likely ofthem. The measurement of
blood pressure alone is the main indicatorof hypertension and the need to
start medication for a lifetime. Hypertension or high blood pressure is a
common disorder, affecting approximately 50 million Americans. According to
Dr. Mark Gelfer, Medical Director, VSM MedTech Ltd. in his article, Addressing
the Need for Accurate Blood Pressure Measurements, it is estimated as many
as 2 million people die in United States due to hypertension. Over time it has
become essential, not only to detect hypertension but also to monitor it
How is blood pressure measured?
Blood pressure is measured through the use ofa medical instrument
called Sphygmomanometer. It is a quick, painless test.
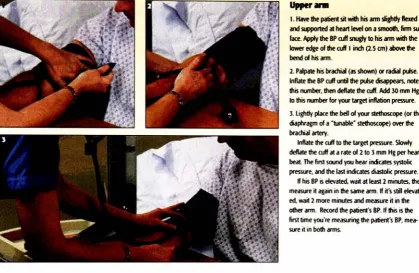
Upperam
I.Havethepatient at withhisamislightlyflexed
and supported atheart levelon asmooth,firmsur face.Applythe BPcuffsnuglytohisarmwiththe
loweredgeofthecuffIinch(2.5 cm)abovethe
bendofhisarm.
2.Palpatehis brachial(as shown)or radial pulse.
Inflatethe BPcuffuntilthepulsedisappears,note thisnumber, thendeflatethecuff.Add 30mmHg to thisnumberforyourtargetinflationpressure
S.Lightlyplacethe bellof yourstethoscope(or the
diaphragmofa
'tunable"
stethoscope)overthe
brachialartery.
Inflate thecuffto the targetpressure.Slowly
deflatethe cuff at a rateof2 to 3mmHgperheart beat The firstsoundyouhearindicatessystolic pressure,andthelastindicatesdiastolicpressure.
[image:11.505.42.462.164.437.2]If his BPs elevated, wait atleast2minutes,then measureitagainin thesame armIfit'sstillelevat ed,wait2more minutes and measureitinthe other arm.Recordthepatient'sBP. If thisisthe firsttimeyou'remeasuringthepatient'sBP.mea sureitinbotharms.
fig. 2 Typical set-upof human blood pressure measurement
A compression cuff is wrapped around a person's upper arm and
inflated. The large artery in the arm is compressed and the flow of blood is
momentarily stopped.
As the air in the cuff is released, the person measuring the blood
pressure listens with a stethoscope. When the blood starts to pulse through
the artery, it makes a sound. This sound is heard continuously until pressure
As the person listens and watches the sphygmomanometer scale, he
or she records two measurements. The systolic pressure is the pressure of
the blood flow when the heart beats (the pressure when the first sound is
heard). The diastolic pressure is the pressure between heartbeats (the
pressure when the sound changes quality). This sound is called as Korotkoff
sound as it was discovered by Dr. Korotkoff. Blood pressure is measured in
millimeters of mercury, which is abbreviated mm Hg. The harder it is for
blood to flow, the higher the numbers will be.
Diagnosis of hypertension affects the life of an individual at various
levels. A continual monitoring and treatment follows the detection of
hypertension. This has psychological and socioeconomic implications on the
patient. Thus people identified incorrectly as having hypertension may have
adverse effects of medication and have increased treatment cost and
insurance. On the other hand ifa truly hypersensitive patient is not
diagnosed, it can lead to catastrophic event. Thus these reasons result in
leaving no room for error in blood pressure measurements.
Consistently overestimating low blood pressure could increase the
number of people suffering from hypertension leading to being exposed to
inappropriate therapy. Whereas underestimating diastolic pressure could
keep people having hypertension, from life saving treatment. These factors
Chapter 2
ERRORS IN BLOOD PRESSURE MEASUREMENT
It becomes important at this point to understand in detail the various
kinds of errors associated with the measurement of blood pressure. There is
extensive literature on the sources of error encountered with blood pressure
measurement. These errors can be summarized as:
Errors associated with the observer
Errors associated with the measuring instrument
Errors associated with the cuff
Errors associated with the observer
As blood pressure is considered a routine diagnostic procedure, it is
not measured routinely by the physician; it is often performed by those with
significantly less training, such as a nurse, technician, nurse's assistant,
improper methods oftaking the readings factors enlisted below also lead to
inaccurate measurements:
Distraction and noise in a busy clinic or hospital
Position ofthe person taking the reading relative to the manometer,
resulting in improper angle ofsight for reading the measurements, also
called parallax
Detecting and recording Korotkoffsounds requires considerable clinical
expertise to obtain accurate readings
Based on these issues some guidelines have been developed that
blood pressure measurements be conduced in a standardized form using
equipment that meets certain criterion. The NIH Joint National Committee
has set up following rules:
Patients should be seated in a chair with their backs supported and their
arms bared and supported at heart level.
Blood pressure measurement should begin after at least five minutes of
rest.
The appropriate cuff size should be used.
Measurement should be taken with a mercury sphygmomanometer,
Both systolic and diastolic blood pressure measurements should be
recorded.
Two or more readings separated by two minutes should be averaged. If
the first two readings differ by more than 5mm Hg, additional readings
should be obtained and averaged.
A frequent cause for error in blood pressure measurement in the
clinical setting is the "White Coat Effect". It is described as isolated clinic
hypertension by the World Health Organization (WHO). This is a condition in
which a patient's blood pressure is consistently elevated in the physician's
office or clinic. This could happen because the patient may become anxious
in the clinic in the presence ofdoctors or clinicians in order to know if he
suffers from hypertension. The anxiousness results into hypertension. Thus
the blood pressure may be elevated in the clinic, but normal at other times.
Individuals with this condition are very likely to receive unnecessary
Errors associated with the instrument itself
There are three types of blood pressure apparatus: the mercury
gravity manometer, the aneroid gauge and the electronic devices.
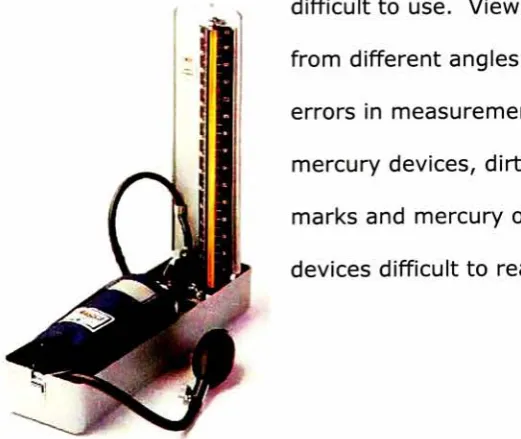
Mercury Devices:
The conventional sphygmomanometer was first introduced in 1896 and
later modified by Korotkoff in 1905. Since then, the sphygmomanometer has
been considered as the gold standard in measuring blood pressure. However
they are being phased out due to two concerns: mercury posing as a
potential biohazard and the manometer being a source of observer error.
Even though considered as a gold standard, these manometers are very
difficult to use. Viewing the mercury column
from different angles has been shown to generate
errors in measurements. Given the age of many
mercury devices, dirty columns, faded calibration
marks and mercury oxidation have made many
[image:16.505.50.311.374.593.2]devices difficult to read.
Aneroid Devices:
Aneroid sphygmomanometers have replaced many mercury devices,
but they have also been shown to be a source of error in blood pressure
measurement. The aneroid gauge consists of a metal bellows and a watch
like movement connected to the compression cuff. Variations of pressure
within the system cause the bellows to expand and contract. Movement of
the bellows rotates a gear that turns a pointer pivoted on bearings, across a
calibrated dial. The adjustment ofthe mechanical system ofthe aneroid
gauge is more easily disturbed. Forthis reason, the aneroid gauge must be
calibrated against a mercury manometer at regular intervals. Since the blood
pressure recorded with the aneroid gauge depends upon the elasticity ofthe
metal bellows, it is subjectto errors inherent in the elastic properties of
metal such as 'seasoning', hysteresis and drift.
According to Dr. Mark Gelfer, Medical Director, VSM
MedTech Ltd. in his article, Addressing the Need for
Accurate Blood Pressure Measurements, up to 60%
ofthe aneroid devices tested are inaccurate due to
improper calibration or maintenance.
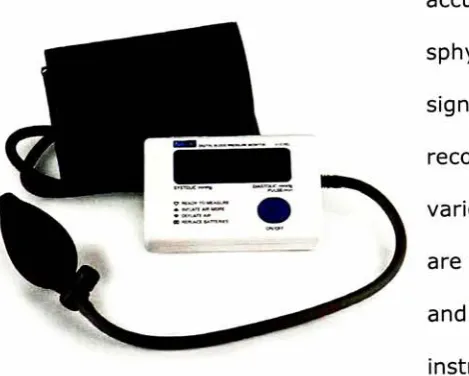
Electronic Devices:
Over the past few years, blood pressure monitoring devices have
become available for individuals to measure their blood pressure
conveniently at home. A high percentage ofthese instruments are electronic
and are popularly called Electronic Sphygmomanometers. The electronic
devices operate on the extrapolation ofdeflections ofa transducer coupled
with an algorithmic derivation of a selected oscillation. They do not use the
auscultation of Korotkoffsounds.
Despite studies purporting
accuracies ofthese electronic
sphygmomanometers, there are a
significant number of patients
recording inaccurate readings due to
various reasons. Most ofthe reasons
are related to the design ofthe device
and the method of using the
instrument.
fig. 5 Electronic Sphygmomanometer
[image:18.505.44.279.334.522.2]Errors associated with cuff size
A cuffbladder that is too wide will underestimate actual blood pressure
and one that is too narrow can overestimate the measurement. According to
Dr. Mark Gelfer, Medical Director, VSM MedTech Ltd. in his article, Addressing
the Need for Accurate Blood Pressure Measurements, the appropriate width of bladder should be at least 40% ofthe circumference ofthe arm and the
length should be at least 80% ofthe arm circumference. Other errors related to
cuff and bladder include a bladder not
centered on the arm, a cuff placed over
clothing and a cuffthat is too loose.
fig. 6 Typical cuff used during human
blood pressure measurement
This thesis aims to solve these issues by means of a newly designed, accurate electronic sphygmomanometerthat can be used in the convenience of home and at the same time be suitable for retirement homes. In
developing a solution to the problem, following conditions are important.
1. The principle task is to develop a highly functional, accurate,
economically efficient product, the visual statement of which is
distinctive enough to generate sufficient customer interest.
[image:19.505.42.229.250.378.2]2. Different materials and assembly methods will be discussed and
considered during the design phase.
3. An interface will be designed to make the product approachable and easy
to use for the consumer.
This thesis is a methodical, conscientious effort to tackle these issues and
design an Accurate Electronic Sphygmomanometer.
Chapter 3
METHODOLOGY
The process to design an accurate electronic sphygmomanometer is
methodical and involved the following steps.
Step 1: Data collection
This step was to collect data of available similar solutions, analyze them and
find existing issues. It also helped in knowing the current trends in terms of
aesthetics, functions and features. Interviews with the home users, patients,
medical personnel were integral part of information collecting process.
Step 2: Design Development
In this step new product was defined in terms offunction, form and
aesthetics. Afterthe basic configuration was established, alternate new
design concepts for the sphygmomanometer were developed. Interface
design issues were considered to assist the user in proper and easy handling.
Step 3: Final Design
As the design was finalized, fabrication and assembly methods were selected
to fully define the product in terms of its forms, features and
manufacturability. A digital and a full-scale physical model were developed to
convey the idea and define the product in totality.
Step 1: DATA COLLECTION
An extensive research about the existing solution revealed substantial
information about current trends in market and issues related to the
sphygmomanometers. A trend map as illustrated in fig. 7 was developed.
[image:23.505.106.440.228.609.2]TREND MAP
fig. 7 Trend map illustrating a study of current electronic sphygmomanometers available inthe market
Step 2: DESIGN DEVELOPMENT
Brainstorming
A mind map was developed to explore various ideas that could
possibly eliminate the issues with current monitors. Fig. 8 shows the mind
map developed to brainstorm new concepts and functions for new and
accurate sphygmomanometer.
feHTvll
\
j... _^^
j^^
..iai^^ *> ,..ji^. r . .&..<* w* i di
ifw>/
,.*") 2. / V \VliW"
,_, slwpl I I, **"J
[image:24.505.51.465.254.605.2]J..'''"1
fig. 8 Mind map that was created to develop new ideas for accurate electronic sphygmomanometer
Initial Sketches
Further 2D and 3D sketch models were developed. The following illustrations
show a sample of 2D and 3D sketches developed during this phase.
Each time a form was developed, manufacturing and assembly
methods were considered. The aim was to develop a form that was easy to
manufacture. Very simple forms as illustrated were considered.
_ pip <f*
fig. 9 Rough sketchesto brainstorm ideas
[image:25.505.48.467.259.548.2]?o
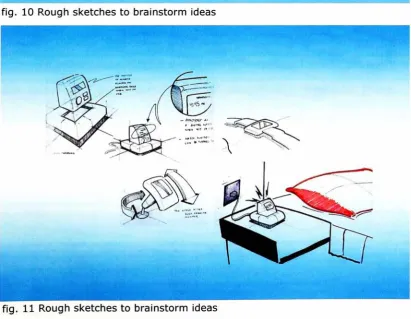
[image:26.505.49.461.360.679.2]fig. 10 Rough sketchesto brainstorm ideas
fig. 11 Rough sketchesto brainstorm ideas
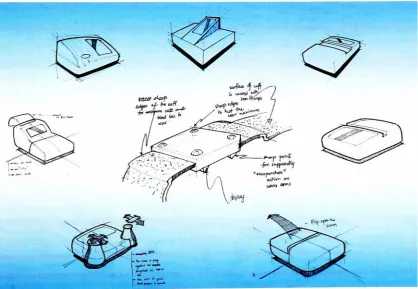
Complex organic forms as shown in fig. 12 were also considered.
fig. 12 Rough sketches to brainstorm ideas
To better understand the manufacturing process and to get a feel of
size and scale ofthe product, 3D sketch models were developed. These
models as shown in fig. 13 and fig. 14 were made using materials like clay,
putty, foam core, yellow foam orStyrofoam.
fig. 13 3D sketch models made using yellow foam or Styrofoam
fig. 14 3D sketch models made using yellow foam or Styrofoam
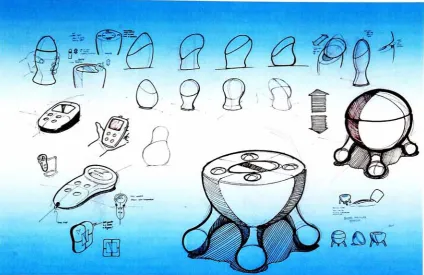
[image:28.505.38.469.371.650.2]Step 3: FINAL DESIGN
In the final stages, a form that accentuated friendliness and expressed
concern towards the user was developed. The final developed form emulated
a shape of a pet. Pets are considered friendly towards theirowners. They
provide a sense ofcompanionship and are means ofcompassion for many
people. Since the largersegment of market for blood pressure monitor is the
elderly, it was an aim to design a product that would serve more than just a
simple medical device. Most ofthe available solutions in the market arejust
devices that are meantto be used at a particular time and then shoved back
into the drawers or closets away from the user. It was the aim of the thesis
[image:29.505.43.467.378.657.2]to design a product that need not be hidden. And at the same time have a
fig. 15 Form development ofthe product and itsaccessories
conspicuous presence.
Fig. 16 illustrates 3D sketch models developed to understand the assembly of
various accessories and their function. Yellow foam and ren were used for
[image:30.505.40.467.190.465.2]mock-up models.
fig. 16 3D sketch models developed to understand the assemblyof various accessories
Human Interface Development
Interface development was also an integral part ofthis phase. Various
combinations were tried to
develop
the Human Interface ofthe device. Theinterface menu was developed in MACROMEDIA FLASH software to simulate
the working ofthe device. This menu is provided on the CD on the last page
ofthe report.
Fig. 17 and fig. 18 illustrate the various attempts to develop a Human
Interface of the device. These are preliminary sketches to understand the
placement of buttons with respect to the menu shown on the screen. Both,
the menu and the buttons and their placement on the product were
developed simultaneously.
[image:31.505.45.472.385.663.2]Q
:Qfig. 17 Developing human interface
fig. 18 Developing human interface
Final Design of HI
Along with final form ofthe sphygmomanometer, its features and
human interface were designed to ensure ease of handling and simplicity.
Fig. 19 shows the final design of human interface ofSpiggy. The first screen
is shown below. It indicates the battery charge remaining and the last
reading recorded. It also shows "WELCOME" which indicates a warm feeling
towards the user. There are 2 buttons atthe bottom that are used to execute
[image:33.505.89.381.299.702.2]functions shown on the screen.
fig. 19 Final HI design
Computer Aided Design
The next step was to develop a full scale physical model. A model with
accurate dimensions was developed in Alias Studio Tools 11.0. Various colors
were then applied before deciding the exact color for the product. Fig. 20
illustrates the main body of"SPIGGY"
-the new Accurate Electronic
[image:34.505.49.465.265.583.2]Sphygmomanometer.
fig. 20 main body ofSpiggy
-the new Accurate ElectronicSphygmomanometer
The files developed in Alias Studio Tools were transferred to
SolidWorks for 3D printing purposes. A rapid prototype was then developed
using resin
-SLA-11120 and using the process of Stereo lithography. The
prototype was provided by the courtesy of Design Prototyping Technologies,
Inc. The model was then taken to a finished level by applying the appropriate
colors. The full scale model helped to understand the form and gave a sense
of scale to the product. Since the form was complex, the process of stereo
lithography assisted in making a precise prototype.
Fig. 21 illustratesthe physical model ofthe concept after appropriate
[image:35.505.44.464.348.581.2]colors were applied to the resin model provided by DPT Inc.
fig. 21 Physical model of conceptual Accurate Electronic Sphygmomanometer
For functional reasons, accessories were developed with main body of
Spiggy. Full scale physical models were made to demonstrate the function
and purpose of each accessory. The
following
accessories were developed:1. Charging dock: The dock is used to charge Spiggy. It is also used to
connect to the internet. All the readings recorded using Spiggy are
saved on a central server when connected to the internet. These
readings can be retrieved by the user orthe user's relatives and
doctors by going online. The red LED indicates data transferstatus.
2. Cuff Clip: The clip was developed to hold the cuff securely. It snaps
[image:36.505.52.413.395.660.2]into the sides ofthe charging dock to keep the units together.
Fig. 22 shows Spiggy and the accessories designed to function with it.
Chapter 4
HOW TO USE SPIGGY?
Hit any key.
Follow the self-explanatory menu.
Measure your blood pressure.
Other than measuring blood pressure Spiggy has
features that make it unique and a better
product than the other solutions available in the
market.
Spiggy features:
Maintains records
Multi-user system
Personalized settings for each user
Uses rechargeable battery
Connects to internet
Start
Person sitting enjoying
[image:37.505.335.454.222.648.2]weather report
fig. 23 How to use Spiggy
Provides latest information regarding blood pressure
Provides information regarding weather
Chapter 5
HOW DOES SPIGGY HELP?
The NIH Joint National Committee states its first two rules as:
Patients should be seated in a chair with their backs supported and
their arms bared and supported at heart level.
Blood pressure measurement should begin after at least five minutes
of rest.
The design of SIPGGY is such that the user follows the two rules
without any special efforts.
For measurement purposes, the cuff is required to be connected to the
main body of sphygmomanometer. This length can be critical when the user
is not conscious ofthe importance of being seated while taking the
measurements. During the research it was observed that users took readings
while not being seated. This resulted into erroneous recordings. The length of
the cufftube that connects to
"belly"
ofSpiggy is kept short so that the user
has to sit down to take the blood pressure measurement. As a resultthe user
cannot use Spiggy unless he is in the appropriate position.
It is very necessary that the user has calmed down before he takes
any blood pressure readings. If the user has performed any rigorous
exercises or has just returned after doing any activity that increases the rate
of blood flow, (like running up the stairs,jogging) it is essential that he/she
waits a few minutes, so that the blood flow has returned to normal. The
electronic blood pressure monitors available in the market start the process
of measurement in a few seconds after they are switched on. This sometimes
leads to wrong measurements being recorded, ifthe patient hasn't waited for
enough time to allow his blood pressure to return to normal. Spiggy functions
in such a manner that the user has to wait before he can actually take any
measurements. This is achieved with the help of menu options. The user has
to undergo a series of menu options before he reaches a point where he/she
can actually take reading.
1. The user begins with a
"WELCOME"
screen.
2. When the user hits either ofthe two buttons, current date and time
are displayed.
3. This is then followed by the current weather conditions like
temperature and humidity.
4. The menu then comes to a point where the user has to select his
profile.
5. After the user selects his profile, the past 10 recordings are displayed.
6. Then the user is instructed through the process of blood pressure
measurement.
Thus by the time the user is actually recording a reading, a
considerable amount oftime is spent in a resting position. This reduces, if
not completely eliminates the erroneous recordings. The intuitive menu
(supplied on a CD with this report) keeps the user glued to the process
he/she is performing.
Chapter 6
OTHER ADVANTAGES OF SPIGGY
In addition to working as an accurate blood pressure monitor, Spiggy
has other advantages.
Remote monitoring
Spiggy can be used as a remote monitoring device in hospitals by
doctors or nurses to check upon their patients at regular intervals. A central
monitoring system established via means of Spiggy, to connect numerous
patients to a single nurse helps to stay in touch with and monitor a large
numberof patients.
Internet Connections
With the purchase of Spiggy, the buyer gets a user account on the
internetto keep record ofreadings. As Spiggy supports multiple user profiles,
single Spiggy can be used by different family members and respective
records can be set up on the internet. This information can be shared
amongst responsible family members and family doctors. Each user profile
on the internet is password protected for security purposes.
Visiting Nurses
Nurses who are not scheduled to visit their patients daily and take
measurements can train them to take their own blood pressure and monitor
the patients from clinics ortheir homes.
Chapter 7
CONCLUSION
The entire thesis completion process has been one ofthe best learning
experiences that I have had. The first steptaken at the start, thesis research
involved searching a lot of data and information. It involved interviewing
people and collecting relevantfacts. The World Wide Web has been a great
resource ofinformation, wherein people did not want to reveal their identity
but at the same time were glad to help and share all the information they
had.
The second phase was the design development. In this phase I was
able to use and enhance all the skills honed at RIT and my engineering
experience to come up with a solution that could potentially be an answerto
the problems discovered during the research phase. The concept of making
the user wait for a while before he/she can actually start recording any
readings could work very well for some users. The interactive menu
successfully keeps the user engaged before any readings are taken. It
provides a graphical overview ofthe past readings. In order to keep the user
occupied in a fruitful manner, Spiggy gives the current temperature. The
menu at all times engages user in the entire process.
Spiggy provides user profiles, thus giving a personal touch to the
product and process. Providing user profiles allows a multiple users to use
Spiggy. Each user can log on to his personal profile and thus access his data.
However, there are certain issues that could cause problems. The multiple
users could access each others data, thus invading privacy. This can however
be tackled by proving passwords at the login screen. Increasing the buttons
size on the human interface can provide further user comfort.
This thesis has taught me the essentials of design. The skills gained
and the experiences during the making ofSpiggy have instilled confidence in
my design skills and will be useful to me forthe rest of my design career.
Bibliography
Dr. Gelfer, Mark, Medical
Director,
VSM MedTech Ltd. 2003.Addressing
theNeed forAccurate Blood Pressure
Measurements
-A Review ofthe Evidence.
Business Briefing. Global Healthcare.
Internet Resources:
Dr. Blood Pressure.
November, 2003. AllaboutHigh bloodpressure [online];
available from
http://www.drbloodpressure.com;
Internet; accessed 5th
November 2003.
W.A. Baum Co., Inc. November, 2003. Importance ofBlood Pressure
measurement, [online]; available from http://www.wabaum.com/baum/:
Internet; accessed 14th November 2003.
Pictures:
Fig. 1, Pg. 2. Blood Pressure. November, 2003. All aboutHigh bloodpressure
[online]; available from
http://www.drbloodpressure.com;
InternetFig. 2. Pg. 3. Principle of Blood Pressure Measurement. Available from
http://www.steeles.com/catalog/takingBP.html
Fig 3. Pg. 8. Mercury Devices. Available from
http://www.medcatalog.com/images/LabtronSphy.jpg
Fig. 4. Pg. 9. Aneroid Devices. Available from
http://www.acklev-uniforms.com/images/prestiqe-79.jpg
Fig. 5. Pg. 10. Electronic Devices. Available from
http://www.orthobionics.com/rehabl/bloodpressure/index.htm
Fig. 6. Pg. 11. Cuff Size. Available from http://www.cranlea.co.Uk/bp2.8.jpq