R E V I E W
Predicting cardiorespiratory instability
Michael R. Pinsky
1,2*, Gilles Clermont
1and Marilyn Hravnak
3Abstract
This article is one of ten reviews selected from the Annual Update in Intensive Care and Emergency medicine 2016. Other selected articles can be found online at http://www.biomedcentral.com/collections/ annualupdate2016. Further information about the Annual Update in Intensive Care and Emergency Medicine is available from http://www.springer.com/ series/8901.
Background
Identification of patients with overt cardiorespiratory insuf-ficiency or at high risk of impending cardiorespiratory in-sufficiency is often difficult outside the venue of directly observed patients in highly staffed areas of the hospital, such as the operating room, intensive care unit (ICU) or emergency department. And even in these care locations, identification of cardiorespiratory insufficiency early or predicting its development beforehand is often challenging. The clinical literature has historically prized early recogni-tion of cardiorespiratory insufficiency and its prompt cor-rection as being valuable at minimizing patient morbidity and mortality while simultaneously reducing healthcare costs. Recent data support the statement that integrated monitoring systems that create derived fused parameters of stability or instability using machine learning algorithms, accurately identify cardiorespiratory insufficiency and can predict their occurrence. In this overview, we describe inte-grated monitoring systems based on established machine learning analysis using various established tools, including artificial neural networks, k‐nearest neighbor, support vec-tor machine, random forest classifier and others on rou-tinely acquired non‐invasive and invasive hemodynamic measures to identify cardiorespiratory insufficiency and display them in real‐time with a high degree of precision.
* Correspondence:[email protected] 1
Department of Critical Care Medicine, University of Pittsburgh, 15261 Pittsburgh, PA, USA
2Department of Anesthesiology, University of California, San Diego, La Jolla, CA, USA
Full list of author information is available at the end of the article
The implications of these approaches for all healthcare monitoring across the spectrum of in‐patient to chronic care is clear, even though the need may appear more pressing for the acute care setting to those of us whose daily life is centered there. The underlying assumption of these approaches is that measured changes in easily acquired physiologic variables reflect complex patient‐ specific interactions amongst multiple regulatory auto-nomic, hormonal and metabolic systems. Accordingly, simple algorithm approaches to such interactions, like the use of the existing severity scoring systems or com-puter‐based treatment protocols, are unlikely to improve outcomes other than by standardizing therapies. Poten-tially, by using functional hemodynamic monitoring principles, previously described and validated, we can predict with a high degree of accuracy volume respon-siveness and central arterial tone in all patients. But one needs to identify who is unstable or going to be unstable before applying these functional hemodynamic monitor-ing approaches.
Integrated monitoring systems improve diagnosis of cardiorespiratory insufficiency and treatment effectiveness
Current resuscitation decisions are typically made in re-sponse to a falling blood pressure (BP), persistently high heart rate (HR) or arterial desaturation [1]. Individual vital signs (BP, HR, respiratory rate, pulse oximeter oxygen sat-uration [SpO2], and end‐tidal CO2) are usually assessed as mean values and interpreted independently. These point estimates may not reach an actionable level until the pa-tient has already progressed to late (or decompensated) cardiorespiratory insufficiency. Alternatively, an integrated monitoring system can use fused data, collected and synthesized to identify physiologic patterns, which are predictive of instability in real‐time and before overt clinical deterioration [2]. To see whether such an inte-grated monitoring system could identify overt cardiorespi-ratory insufficiency earlier in its course and reduce overall patient instability, we used a Food and Drug
Administra-tion (FDA)‐approved Visensia™ monitor (OBS Medical,
Carmel, IN) that amalgamates non‐invasive vital signs (BP, HR, respiratory rate, SpO2) and derives a calculated
index score (vital signs index [VSI]) between zero and ten using an artificial neuronet approach [3]. Using our 600 step‐down unit (SDU) patient cohort as a calibration set, we recalibrated the VSI algorithm to fit our cohort, wherein VSI values of > 3.2 correlated significantly with independently estimated instability based on clinical as-sessment (r= 0.815) [4]. An example of one patient who progressively deteriorated over a 6 h period is shown in Fig. 1. Note that deterioration is not steady but phasic (blue arrows) with periods of failed recovery ending in col-lapse (black arrow). Furthermore, when the VSI alert was coupled with an effector arm of direct immediate nursing bedside activation and protocolized treatment, overall instability decreased by 150 % and the progression from mild to severe instability was reduced by 300 % [5, 6]. Importantly, the VSI alert occurred before clinic-ally‐apparent instability in 80 % of cases, with an advance time of 9.4 ± 9.2 min. Thus, such bedside‐displayed VSI data can often detect the onset of cardiorespiratory insufficiency before overt symptoms are present and when coupled to appropriate immediate treatment plans markedly reduces patient instability.
Demographic and clinical characteristics are useful in predicting mortality for groups of patients using static snapshot models such as APACHE III [7] or IV [8], and also help to predict mortality when added to intermit-tent vital sign amalgamation. Smith et al. [9] determined
that adding age to a single‐parameter instability‐concern model (RR < 5 or > 36/min, HR < 40 or > 140/min, sys-tolic BP < 90 mmHg, sudden fall in level of conscious-ness) or the intermittently determined Modified Early Warning System (MEWS) improved mortality predic-tion. Patients≥ 80 years of age with a RR of 24–25 per minute had 4 times the mortality of patients 40–64 years of age, and those≥80 years of age with a systolic BP of 90–94 mmHg had 10 times the mortality of those aged 40–64 years of age. Higher age also increased mortality prediction as MEWS score increased. We subsequently validated this improved predictive index in our SDU co-hort, wherein adding low frequency data (demographics) markedly improved the predictive value of the VSI alerts in SDU patients [10].
Advanced signal processing improves predictive value of HR for identifying impending instability
Batchinsky et al. showed that advanced signal processing R‐R intervals could be used to predict trauma survivor-ship [11]. They then showed clear differences in HR complexity in 31 pre‐hospital trauma patients during their helicopter transport to a level 1 trauma center who survived (20 survived) or died (11 died) after admission. Although mean HR was not different between groups (117 ± 9 vs. 100 ± 4/min, non‐survivors vs. survivors), their HR variability, quantified by the instantaneous R‐R
05:00 06:00 07:00 08:00 09:00 10:00 11:00 12:00 13:00
05:00 06:00 07:00 08:00 09:00 10:00 11:00 12:00 13:00
05:00 06:00 07:00 08:00 09:00 10:00 11:00 12:00 13:00
05:00 06:00 07:00 08:00 09:00 10:00 11:00 12:00 13:00
05:00 06:00 07:00 08:00 09:00 10:00 11:00 12:00 13:00
6 5 4 3 2 1 0 0 0 0 120 100 080 060 040 040
030
020 010
000
100
095 090
085 080
150
100
050 06:00 09:00 12:00
BP RR HR VSI
SpO2
V
ital Sign Index
RR
HR
BP
SpO
2
Fig. 1Screen display of physiologic data stream of a patient with progressive decompensation to overt cardiorespiratory insufficiency over 6 h.
[image:2.595.57.539.425.695.2]interval changes on a beat‐to‐beat basis were clearly differ-ent. They quantified HR variability by assessing approxi-mate entropy (ApEn), sample entropy (SampEn) and similarity of distributions. Traditionally, heart rate vari-ability, estimated, as the standard deviation of the R‐R interval, requires at least 800 beats to derive robust values. However, these authors showed that by using these de-rived parameters of variability, SampEn not only displayed clear separation of values between survivors and non‐sur-vivors, but the strength of the discrimination persisted even when the datasets were reduced from 800 to 100 R‐R intervals [11]. Furthermore, these electrocardiographic (EKG)‐derived signal differences were also associated with the need for life‐saving interventions in these same trauma patients [12]. Finally, they verified the above findings in a mixed cohort of prehospital trauma patients [13]. Thus, readily available vital sign data can be used to derive clinically‐relevant prediction parameters with precision and a markedly reduced lead time.
Advanced signal processing of physiologic variable time series identifies those SDU patients who will become unstable from those who will not
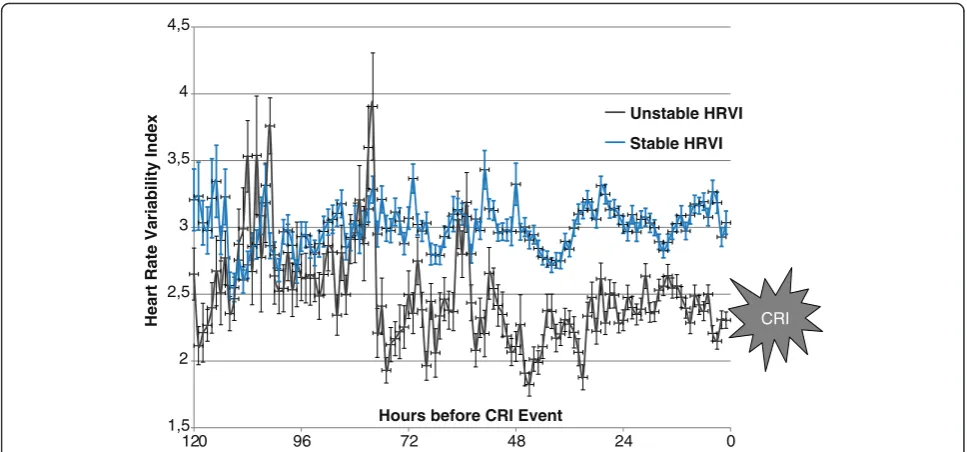
Using the above SDU patient data series [5, 6], we ana-lyzed HR variability parameters similar to those described by Batchinsky et al. [11–13]. We created a HR variability index based on HR autocorrelation, standard deviation, high frequency power of HR frequency spectrum and ApEn. The resulting fused parameter was significantly dif-ferent for the 80 patients in the 307 patient cohort who experienced at least one cardiorespiratory insufficiency episode. Importantly, when displayed as 5 min epochs moving backward from the instability event or discharge in the two groups, HR variability discriminated between the two groups > 48 h before these events (Fig. 2) [14]. Thus, advanced signal processing of clinical data can iden-tify instability before it becomes clinically apparent, often with many hours of lead time.
Advanced monitoring‐derived comprehensive libraries It is not enough to use existing data streams to predict in-stability. One must also create physiological libraries of complex and dynamic states, such as hemorrhage, sepsis, pump failure, or evolving acute lung injury (ALI). Normal physiological reflexes aggressively support blood flow to the heart and brain and thus may well obfuscate bedside assessment. We used highly instrumented animal models to define high fidelity physiologic patterns of individual animal response to disease. We studied these patterns of response in compensated trauma/hemorrhagic shock, both during the progression to cardiovascular collapse and its response to resuscitation therapies. As with the above vital sign analysis, we note not only the absolute values of measured hemodynamic variables ascertained
from non‐invasive and minimally invasive biosensors, but also their dynamic response to prescribed physiological challenges. Compensation, exhaustion and response to therapy reflect the three primary processes studied.
The experimental hemorrhage protocol is designed to simulate a dynamically changing clinical situation by modifying a Wigger’s model using several discrete bleed-ing episodes based on the animal’s physiologic response. Lightly anesthetized swine followed an arterial pressure‐ driven experimental hemorrhage protocol to a mean ar-terial pressure (MAP) of 30 mmHg, held there for a maximum of 90 min then resuscitated. The porcine trauma/hemorrhagic shock model plays into the unique nature of each test animal by having the level of bleed defined by the subsequent MAP and not by the amount of blood shed. This allowing us to examine the specific compensating mechanisms, unique measures of decom-pensation and tissue viability and response to therapy [15]. High fidelity (256 Hz) hemodynamic waveform col-lection and low frequency endocrine, metabolic and im-munologic parameters can also be recorded throughout the experiment. Instrumentation with additional biosen-sors to assess tissue O2 saturation (StO2), tissue CO2 and pH, capillary blood flow and mucosal NADH2levels were also performed as well as dynamic stress tests de-scribed below. The partial list of ‘non‐traditional’ biosen-sors we have used in this model and that can be used clinically going forward is given in Table 1.
shock similar to that reported in septic shock [23, 24].
Elevated NADH2 levels mirror hypotension but often
persist for several minutes during resuscitation despite restoration of MAP [25].
Extending biosensor utility using functional hemodynamic monitoring for prediction
Fully half of all hemodynamically unstable ICU patients are not volume‐responsive [26]. Estimates of preload (e.g., right [RV] or left [LV] ventricular volumes, intrathoracic blood volume or ventricular filling pressures) do not predict volume‐responsiveness. Functional hemodynamic monitoring overcomes this limitation of traditional hemodynamic monitoring [27, 28]. In this case, func-tional hemodynamic monitoring uses a small volume
[image:4.595.56.540.87.313.2]loading challenge to perturb the cardiovascular auto-regulatory function. Examples of preload challenges validated in multiple clinical trials include small rapid bolus volume infusions (i.e., fluid challenge), positive‐ pressure breathing [29] and passive leg‐raising (PLR) to 30° [30]. If LV stroke volume increases transiently with these maneuvers, then cardiac output will also crease with subsequent fluid infusion. The degree of in-crease is quantified as the ratio of the maximal change in pulse pressure or stroke volume over 4–5 breaths or with PLR to the mean pulse pressure or stroke volume, referred to as pulse pressure variation (PPV) or stroke volume variation (SVV), respectively. The disadvantages of a traditional fluid challenge are that it takes time, often is given too slowly, thus masking volume responders,
Table 1FDA‐approved non‐invasive non‐traditional biosensors available and previously used by us
Sensor name Parameters measured Manufacturer
Trendcare Multiparameter Tissue PCO2, PO2, pH Diametrics Medical
CritiView CRV3 Mitochondrial function (NADH2fluorescence), microcirculatory blood flow, volume and oxygenation
CritiSence Inc.
InSpectra Tissue O2saturation Hutchinson Industry
CV InSight Vascular tone iNTELOMED
Microscan Microcirculatory flow Microvision Medical
Cytoscan Microcirculatory flow Cytometrics
Clearsight finger plethysmograph Blood pressure and cardiac output Edwards Lifesciences
CNAP finger plethysmograph Blood pressure and cardiac output cnsystems
NICOM Cardiac output, stroke volume variation, thoracic fluid Cheetah Medical
Navigator‐1 Mean systemic pressure, cardiac power Applied Physiology
1,5 2 2,5 3 3,5 4 4,5
0 24
48 72
96 120
Heart Rate Variability Index
Hours before CRI Event
Unstable HRVI
Stable HRVI
CRI
[image:4.595.58.540.567.733.2]and is irreversible. Functional hemodynamic monitor-ing techniques give reliable predictions of preload re-sponse immediately and do not require fluid infusions to make this prediction. Both positive‐pressure venti-lation by physically decreasing venous return with in-spiration and leg‐raising by transiently increasing venous return fulfill these criteria [29, 30]. PPV and SVV can be easily monitored using several FDA‐ap-proved minimally invasive monitoring devices. Thus, in patients receiving positive‐pressure breathing, sim-ple inspection of the arterial PPV will continuously define volume responsiveness. The magnitude of PPV and SVV during ventilation will also be a function of the size of the tidal breath [31], thus this approach is only useful during controlled mechanical ventilation at a fixed tidal volume, which is not the case in spon-taneously breathing patients. Furthermore, PPV and SVV do not reflect volume responsiveness in patients with atrial fibrillation where R‐R intervals vary widely. However, a PLR maneuver with leg elevation to 30° displays the same predictive information in all patients [30]. We and others have extensively documented that a PPV > 13 % or a SVV > 10 % at a tidal volume of 7 ml/kg or a maximal increase in mean cardiac output > 10 % dur-ing a PLR maneuver are predictive of preload responsive-ness (> 90 % sensitivity and specificity) [32]. Several minimally‐invasive devices report cardiac output, PPV and SVV during positive‐pressure breathing or change in car-diac output with PLR using arterial waveform analysis
(e.g., PiCCO plus™ [Pulsion Medical Systems], LiDCO
plus™ and LiDCO rapid™ [LiDCO Group Plc] and
Flo-Trac™[Edwards Lifesciences]). We have previously defined the operating characteristics and reliability of all these de-vices [33, 34]. Finally, the PPV/SVV ratio reflects central arterial elastance and can be used to monitor changes in vasomotor tone [12].
Importantly, FDA‐approved non‐invasive surrogate esti-mates of arterial pulse pressure and stroke volume exist, including pulse oximetry signal, bioreactance (NICOM, Cheetah) and transthoracic ultrasound (USCom) tech-niques. Pulse oximetry density profiles derived from the unprocessed pulse oximetry plethysmographic waveform amplitude (Nonin, Nelcor and Massimo), and pressure‐ sensitive optical sensors (BMEYE, Edwards Lifesciences) can be featurized to estimate pulse pressure, stroke vol-ume and changing vasomotor tone [35]. The BMEYE pressure-sensitive, high fidelity, rapid‐response optic sen-sor has the ability to track the arterial pressure profile to measure instantaneous cardiac output [36] and, along with the pulse oximetry plethysmographic profile, reflect two real‐time waveform signals that we can use to extract pre-dictive features of the cardiovascular system. Importantly, these non‐invasive waveform data can be analyzed inde-pendent of their mean values and expand the utility of
these analyses and predictive modeling beyond invasive monitoring to less invasive monitoring environments, markedly increasing generalizability of this featurized approach.
Non‐invasive measures of oxygen sufficiency
An unanswered question in shock resuscitation is the relationship between tissue perfusion and wellness. Neither MAP, cardiac output or mixed venous oxygen sat-uration (SvO2) define tissue oxygenation. Near infra‐red spectroscopy (NIRS) permits continuous, non‐invasive
measurement of StO2. Although StO2values do not
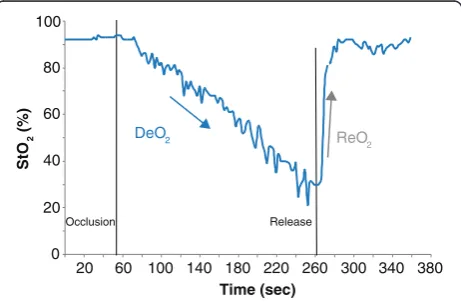
de-crease until tissue perfusion is very low, StO2 becomes more sensitive and specific when monitoring its change in response to a vascular occlusion test (VOT) (Fig. 3). If the StO2probe is placed on the thenar eminence and a down-stream arm blood pressure cuff is inflated to a pressure higher than systolic arterial pressure and held there, total ischemia occurs. The occlusion is sustained until StO2 de-creases to < 40 % and then the cuff rapidly deflated. The StO2down slope is dependent on local metabolic rate and blood flow distribution. The StO2 recovery rate assesses cardiovascular reserve, as we validated in trauma and sep-tic patients compared to normal volunteers [37].
Predicting the need for life‐saving interventions in stat medevac air transport
We assessed the predictive value of the VOT StO2 and
spot lactate levels in trauma patients during emergency air transport from an accident site. All patients were moni-tored using 3‐lead EKG, non‐invasive BP, HR, SpO2, and when intubated, end‐tidal CO2capnography. These single vital signs are not sensitive at identifying shock until ad-vanced [38]. Protocol‐based algorithms typically rely on individual vital signs or clinical parameters (e.g., cyanosis,
20 60 100 140 180 220 260 300 340 380
StO
2
(%)
Time (sec)
ReO2
Occlusion Release
0 20 40 60 80 100
DeO2
Fig. 3Graphic display of the thenar tissue oxygen saturation (StO2)
at baseline and in response to a total vascular occlusion to a minimal StO2then release, referred to as a vascular occlusion test.
Deoxygenation post‐occlusion (DeO2) and reoxygenation upon
[image:5.595.307.538.524.675.2]altered mental status) to identify the need for life‐saving interventions [39, 40] and subjective measures (mental status changes) are difficult to standardize [41]. We hypothesized that in‐flight measures of VOT StO2 and lactate would identify shock trauma subjects in need of life‐saving interventions [42, 43]. We studied 400 transported trauma patients with lactate sampling and 194 patients also with VOT StO2. Patients with pre‐hospital lactate levels > 4 mmol/l had greater need for emergent operation, intubation, and vasopressor (p= 0.02). This association persisted after adjustment for age, Glasgow Coma Scale (GCS) score and initial vital signs. The VOT StO2deoxygenation slopes were predict-ive of the need for life‐saving interventions (p = 0.007), while a delayed reoxygenation slope was predictive of
mortality (p = 0.006) [44]. These data collectively
document that the measurement of readily available physiological variables when coupled to functional hemodynamic monitoring principles (PLR and VOT) can predict clinically relevant physiological states and the subsequent need for life‐saving interventions.
Using machine learning principles to define health and disease
One never truly sees hypovolemia, sepsis, heart failure or ALI in the critically ill patients under our care, one sees the phenotypic physiological response of the host to these pathological processes. Thus, a fundamental aspect of both traditional monitoring and any novel approach is to identify normal biological variability and separate it out from adaptive/reflexive responses and pathological sequelae of these primary processes. For identification and predictive purposes this is very useful because most pathological process presenting as circulatory shock and respiratory insufficiency evolve over time. For example, hypovolemia in the setting of active intravascular volume loss starts with no measurable changes because the vol-ume loss is so small. However, with progressive volvol-ume loss by any mechanism (hemorrhage, 3rd space loss, diarrhea), adaptive processes and hemodynamic pheno-typic signatures evolve which may not be easily identi-fied early on using primary mean hemodynamic values. However, derived parameters, based on validated ma-chine learning approaches, such as the artificial neuronet of interacting variables or SampEn of time series single source data, can markedly improve the early identification of critical illness. Thus, we hypothesize that by advanced analysis of existing biological data series, one can detect adaptive and maladaptive processes earlier than we pres-ently do such that definitive therapy can be started to re-verse these processes before they become severe, induce remote organ injury or become irreversible. For example, an acute asthma attack can often be easily reversible with simple inhalational bronchodilators, whereas if the same
process is left untreated until severe status asthmaticus, much more aggressive therapies need to be given to reverse the same process. And this disease and those required therapies (e.g., steroids) markedly increase morbidity and mortality.
Thus, the process of creating accurate sensitive and specific alerts and decision support systems is both itera-tive and based on creating libraries of ‘normal’and ‘not‐ normal’ physiological interactions or ‘behaviors’, and to have a deeper understanding of the fuzziness of the boundary of normality for each of these behaviors. For example, one could use the previously described baseline porcine data prior to trauma/hemorrhagic shock to ‘train’ the model as to normal biological variability. We will then use the bleeding time, changes in endotoxin in-fusion, burn or smoke inhalation as time‐dependent pathological stressors to calibrate the‘not‐normal’states, as described below. We then use these relatively pure pathological insults to define process‐specific signatures of disease to identify both the pathological process and its severity. Inherent in this analysis is that if therapy re-verses these pathological processes, the derived measure of disease also decreases.
Three major barriers arise when iterating clinical data based on animal experimental data. First, our patient co-horts are often not previously healthy and then sub-jected to a defined relatively pure insult. They arrive in varying states of illness, preexisting co‐morbidities and ongoing therapies. Using a young trauma cohort for ini-tial model development may minimize this effect. Sec-ond, human data are typically not as rich in terms of frequency and number of variables collected given field conditions and other pragmatic reasons. Patients get dis-connected from monitoring devices for various reasons (e.g., X‐rays, turning), EKG electrodes and pulse oxim-eter probes fall off and primary signals can be inaccurate (clotted catheter). Thus, an initial data processing aspect of any model building needs to review these data streams and identify gaps in data flow and artifacts. Finally, one cannot truly define‘normal’in our critically ill patients, only normal behavior. For example, an animal in hemorrhagic shock may appear to be normal based on measured variables and derived parameters if they are also getting vasopressor therapy. Thus, the best we can do across all pathophysiological domains is to report not‐nor-mal and stability, both of which must be interpreted within the context of therapy.
Within these constraints, one must first determine the minimal data set (independent monitored signal, sampling frequency and lead time) required to identify not‐normal with an acceptable level of false alerts and long enough lead time to overt disease expression as to be clinically
relevant. We refer to this approach as “hemodynamic
between parsimony, lead time and accuracy. Initially, a 15 min advanced warning may be the minimal lead time for cardiorespiratory instability to be clinically relevant. Once an alert of not‐normal is made, one may sequentially insert additional measures to deter-mine their ability to improve sensitivity and specificity of these alerts in defining specific disease processes so as to guide therapy. The concept of monitoring parsimony extends beyond hemodynamic monitoring. As the ability to merge hemodynamic data with other clinically relevant data streams, it is expected that a parsimonious set of clinical features useful to cardio-respiratory instability detection and prediction will in-clude non‐hemodynamic data as well.
How do we put all of this together? At the mathemat-ical level there are two main problems. The first is how to predict the occurrence of events in data rich scenar-ios, such as in our porcine data, and the second is how to do the same in humans, which usually will involve only a few biomarkers. In addition, why do we need ani-mal models to predict human behavior? Cannot this analysis be done completely on the human data using only a few biomarkers such as BP, HR, respiratory, SpO2 and minimally invasive measures? Our preliminary ana-lysis of the porcine dataset, which involves many bio-markers, and VSI human data involving the four physiological variables mentioned above [4–6] suggest that our insight can be improved tremendously by using the animal data. It is possible that the variables we use now from the animal trauma/hemorrhagic shock model are not the best for human instability prediction. For ex-ample, the grouping and its variation over time is not apparent in the small human dataset we collected of trauma SDU patients [6]. The animal models that are very close to human disease will allow us to gain a much better understanding of the dynamic features and which of these are the important players at different stages of stress, compensation, resuscitation, recovery and death. These animal analyses may also suggest which variables can be omitted in certain cases, and what omission implies about disease level and adaptation, etc. We hypothesize that data‐driven prediction modeling ap-proaches will enable healthcare professionals both at the bedside and in remote settings to predict those patients most likely to develop future instability. We also hypothesize that dynamic systems modeling will further improve prediction, including the provision of various signatures for instability subtype. This is and will continue to be an amazing and informative journey.
Conclusions
Machine learning principles when coupled with a know-ledge of human physiology, pathophysiology can create highly informative displays and alerts. Such informaiot
can be in the form of anomaly detection, defining the switch from health to disease, may also be disease specific and can track responses to treatment and time. The goals of these efforts is to glean knowledge from data to improve patient care across the spectrum of patient monitoring environments. The future will need to focus on creating a common dictionary for healthcare, common data elements and methods of structuring the data and ways of sharing large data sets that retain patient confidentiality without sacrificing detail.
Competing interests
Michael R. Pinsky, MD is the inventor of a University of Pittsburgh owned US Patent: Use of complexity modelling to predict cardiorespiratory insufficiency. Gilles Clermont, MD none declared.
Marilyn Hravnak, BSN, PhD none declared.
Authors’contributions
All authors read and approved the final manuscript.
Declarations
This work and its publication was supported in part by NIH grant NR013912.
Author details
1Department of Critical Care Medicine, University of Pittsburgh, 15261 Pittsburgh, PA, USA.2Department of Anesthesiology, University of California, San Diego, La Jolla, CA, USA.3Department of Tertiary Care Nursing, University of Pittsburgh, Pittsburgh, PA 15261, USA.
References
1. Goodrich C. Endpoints of resuscitation: what should we be monitoring? AACN Adv Crit Care. 2006;17:306–16.
2. Hravnak M, DeVita M, Edwards L, Clontz A, Valenta C, Pinsky MR. Cardiorespiratory instability before and after implementing an integrated monitoring system. Am J Respir Crit Care Med. 2008;177:A842 (abst). 3. Tarassenko L, Hann A, Young D. Integrated monitoring and analysis for early
warning of patient deterioration. Br J Anaesth. 2006;97:64–8.
4. Hravnak M, Edwards L, Clontz A, Valenta C, DeVita M, Pinsky MR. Defining the incidence of cardio-respiratory instability in step-down unit patients using an electronic integrated monitoring system. Arch Intern Med. 2008; 168:1300–8.
5. Hravnak M, Edwards L, Foster-Heasley M, et al. Electronic integrated monitoring of medical emergency team calls to a step down unit. Circulation. 2007;116(II):939.
6. Hravnak M, DeVita MA, Clontz A, Edwards L, Valenta C, Pinsky MR. Cardiorespiratory Instability Before and After Implementing an Integrated Monitoring System. Crit Care Med. 2011;39:65–72.
7. Knaus WA, Wagner DP, Draper EA, et al. The APACHE III prognostic system. Risk prediction of hospital mortality for critically ill hospitalized adults. Chest. 1991;100:1619–36.
8. Zimmerman JE, Kramer AA, McNair DS, Malila FM. Acute Physiology and Chronic Health Evaluation (APACHE) IVL hospital mortality assessment for today’s critically ill patients. Crit Care Med. 2006;34:1297–310.
9. Smith GB, Prytherch DR, Schmidt PE, et al. Should age be included as a component of track and trigger systems used to identify sick adult patients? Resuscitation. 2008;78:109–15.
10. Yousef K, Pinsky MR, DeVita MA, Sereika S, Hravnak M. Demographic and clinical predictors of cardiorespiratory instability in a step-down unit: pilot study. Am J Crit Care. 2012;21:344–50.
11. Batchinsky AI, Salina J, Kuusela T, Necsoiu C, Jones J, Cancio LC. Rapid prediction of trauma patients survival by analysis of heart rate complexity: impact of reducing data set size. Shock. 2009;32:565–71.
13. Batchinsky AI, Salinas J, Jones JA, Necsoiu C, Cancio LC. Predicting the need to perform life-saving interventions in trauma patients using new vital signs and artificial neural networks. Lecture Notes in Computer Science. Berlin: Springer; 2009.
14. Ogundele O, Clermont G, Sileanu F, Pinsky MR. Use of derived physiologic variable to predict individual patients’probability of hemodynamic instability. Am J Respir Crit Care Med. 2013;187:A5067 (abst). 15. Zenker S, Polanco PM, Kim HK, et al. Threshold area over the curve of
spectrometric tissue oxygen saturation as an indicator of volume resuscitability in an acute porcine model of hemorrhagic shock. J Trauma. 2007;63:573–80.
16. Gannon TA, Britt RC, Weireter LJ, Cole FJ, Collins JN, Britt LD. Adrenal insufficiency in the critically III trauma population. Am Surg. 2006;72:373–6. 17. Porter MH, Cutchins A, Fine JB, Bai Y, DiGirolamo M. Effects of TNF-alpha on
glucose metabolism and lipolysis in adipose tissue and isolated fat-cell preparations. J Lab Clin Med. 2002;139:140–6.
18. Helling TS. The liver and hemorrhagic shock. J Am Coll Surg. 2005;201:774–83. 19. Evans DA, Jacobs DO, Wilmore DW. Tumor necrosis factor enhances
glucose uptake by peripheral tissues. Am J Physiol. 1989;257:R1182–9. 20. Chang CG, Van Way 3rd CW, Dhar A, Helling Jr T, Hahn Y. The use of insulin
and glucose during resuscitation from hemorrhagic shock increases hepatic ATP. J Surg Res. 2000;92:171–6.
21. Carey LC, Curtin R, Sapira JD. Influence of hemorrhage on adrenal secretion, blood glucose and serum insulin in the awake pig. Ann Surg. 1976;183:185–92. 22. Landry DW, Oliver JA. The pathogenesis of vasodilatory shock. N Engl J
Med. 2001;345:588–95.
23. Singer M. Mitochondrial function in sepsis: acute phase versus multiple organ failure. Crit Care Med. 2007;35:441–8.
24. Leverve XM. Mitochondrial function and substrate availability. Crit Care Med. 2007;35:S454–60.
25. Clavijo-Alvarez JA, Sims CA, Soller B, Pinsky MR, Puyana JC. Monitoring skeletal muscle and subcutaneous tissue acid-base status and oxygenation during hemorrhagic shock and resuscitation. Shock. 2005;24:270–5. 26. Michard F, Teboul JL. Predicting fluid responsiveness in ICU patients: A
critical analysis of the evidence. Chest. 2002;212:2000–8.
27. Pinsky MR. Hemodynamic evaluation and monitoring in the ICU. Chest. 2007;123:2020–9.
28. Pinsky MR. Functional hemodynamic monitoring: use of derived variable to diagnose and manage the critically ill. Acta Anaesthesiol Scand. 2009;53 suppl 119:9–11.
29. Michard F, Chemla D, Richard C, et al. Clinical use of respiratory changes in arterial pulse pressure to monitor the hemodynamic effects of PEEP. Am J Respir Crit Care Med. 1999;159:935–9.
30. Monnet X, Rienzo M, Osman D, et al. Response to leg raising predicts fluid responsiveness in critically ill. Crit Care Med. 2006;34:1402–7.
31. Kim HK, Pinsky MR. Effect of tidal volume, sampling duration and cardiac contractility on pulse pressure and stroke volume variation during positive-pressure ventilation. Crit Care Med. 2008;36:2858–62.
32. Pinsky MR. Functional hemodynamic monitoring: A personal perspective. In: Vincent JL, editor. Yearbook of Emergency and Intensive Care Medicine. Berlin: Springer; 2009. p. 306–10.
33. Marquez J, McCurry K, Severyn DA, Pinsky MR. Ability of pulse power, esophageal Doppler and arterial pressure to estimate rapid changes in stroke volume in humans. Crit Care Med. 2008;36:3001–7.
34. Hadian M, Kim HK, Severyn D, Pinsky MR. Cross-comparison of continuous cardiac output trending accuracy of LiDCO, PiCCO, FloTrac and pulmonary artery catheters. Crit Care. 2010;14:R212.
35. Cannesson M, Besnard C, Durand PG, Bohé J, Jacques D. Relation between respiratory variations in pulse oximetry plethysmographic waveform amplitude and arterial pulse pressure in ventilated patients. Crit Care. 2005;9:R562–8. 36. Benomar B, Quattara A, Estagnasie P, Brusset A, Squara P. Fluid
responsiveness predicted by non-invasive bioreactance-based passive leg raise test. Intensive Care Med. 2010;36:1875–81.
37. Gomez H, Torres A, Zenker S, et al. Use of non-invasive NIRS during vascular occlusion test to assess dynamic tissue O2 saturation response. Intensive Care Med. 2008;34:1600–7.
38. Wo CCJ, Shoemaker WC, Appel PL, et al. Unreliability of blood pressure and heart rate to evaluate cardiac output in emergency resuscitation and critical illness. Crit Care Med. 1993;21:218–23.
39. Holcomb JB, Niles SE, Miller CC, Hinds D, Duke JH, Moore FA. Prehospital physiologic data and lifesaving interventions in trauma patients. Mil Med. 2005;170:7–13.
40. Holcomb JB, Salinas J, McManus JJ, Miller CC, Cooke WH, Convertino VA. Manual vital signs reliably predict need for life-saving interventions in trauma patients. J Trauma. 2005;59:821–9.
41. Porter JM, Ivatury RR. In search of the optimal end points of resuscitation in trauma patients: a review. J Trauma. 1998;44:908–14.
42. Guyette FX, Suffoletto BP, Castillio JL, Puyana JC. Identification of occult shock using out-of-hospital lactate. Ann Emerg Med. 2009;54:S142 (abst). 43. Castillio JL, Guyette FX, Suffoletto BP, Peitzman AB, Puyana JC. The role of
prehospital lactate as a predictor of outcomes in trauma patients. J Trauma. 2009;63:S138 (abst).
![Fig. 1 Screen display of physiologic data stream of a patient with progressive decompensation to overt cardiorespiratory insufficiency over 6 h.Blue arrows mark times when the fused instability index (vital signs index [VSI]) exceeds “normal” and the black](https://thumb-us.123doks.com/thumbv2/123dok_us/8351820.310467/2.595.57.539.425.695/display-physiologic-progressive-decompensation-cardiorespiratory-insufficiency-instability-exceeds.webp)