RIT Scholar Works
Theses
Thesis/Dissertation Collections
9-29-2003
Seeing, sensing, and selection: modeling visual
perception in complex environments
Roxanne Canosa
Follow this and additional works at:
http://scholarworks.rit.edu/theses
This Dissertation is brought to you for free and open access by the Thesis/Dissertation Collections at RIT Scholar Works. It has been accepted for inclusion in Theses by an authorized administrator of RIT Scholar Works. For more information, please [email protected].
Recommended Citation
Modeling Visual Perception in Complex
Environments
Roxanne Canosa
A dissertation submitted in partial fulfillment of the requirements for the degree of Doctor of Philosophy in the Center for Imaging Science in the College of Science
Rochester Institute of Technology
September 29,2003
Signature of Author _
Roxanne Canosa
/'(J /
!fJ3
Accepted by -=.-=._ _
THESIS RELEASE PERMISSION
ROCHESTER INSTITUTE OF TECHNOLOGY
COLLEGE OF SCIENCE
Seeing, Sensing, and Selection:
Modeling Visual Perception in Complex Environments
I, Roxanne Canosa, hereby grant permission to the Wallace Memorial Library of RIT to reproduce my dissertation in whole or part. Any reproduction will not be for commercial use or profit.
Signature of Author _
Roxanne Canosa
-CENTER FOR IMAGING SCIENCE
COLLEGE OF SCIENCE
ROCHESTER INSTITUTE OF TECHNOLOGY
ROCHESTER, NEW YORK
CERTIFICATE OF APPROVAL
Ph.D. DEGREE THESIS
The Ph.D. degree of Roxanne Canosa
has been examined and approved by the dissertation committee
as satisfactory for the dissertation requirement for the
Doctor of Philosophy degree in Imaging Science
Dr. Jeff B. Pelz, Dissertation Advisor
Dr. Marc Marschark, Committee Chair
Dr. JulieA. Adams
Dr. Dana H. Ballard
Dr. Roger S. Gaborski
I would like to thank and acknowledge all those who helped to make this dissertation
possible. Thanks to Jeff Pelz for his guidance, support, and encouragement over the
many years of work that were required to bring this research to fruition. None ofthis
would have been possible without his vast knowledge ofthe subject matter, technical
expertise, and cheerful willingness to discuss and explore new ideas. Thanks also to
Jason Babcock for the countless hours spentdeveloping and fine-tuning the eye-tracker,
and for sharing his ideas on experimental design and dataanalysis. This work was built
upon earlier work conducted by Jeff Pelz, Mary Hayhoe, and Dana Ballard at the
University of Rochester, and also Roger Gaborski at the Rochester Institute of
Technolgy. Thanks for their insights and for providing the "shoulders upon which I
stand."
I am also greatly indebted to Julie Adams for her thorough review ofthis work
and her many useful and enlightening comments. The skills and ideas of Marianne
Lipps, Constantin Rothkopf, and Vishal Vaingankarhave provedto be invaluable, and I
am grateful for our many discussions that helped to form and focus this dissertation.
Also, thanks toMarc Marschark for his support. This work was supportedin partbythe
Naval Research Laboratories, the New York State Office of Science, Technology, and
Academic Research, and the Xerox Corporation. Finally, I owe mygreatest appreciation
to John, Elyse, Sandra, and Dennis Canosa, fortheir continued love and supportthrough
The author wasbom in Rochester, New York andhas spentvirtually herentire life there.
She attended college as a first-generation college student at the State University ofNew
York College at Potsdam, earning aBachelorofArts degree in Art History in 1980. She
then returnedtoRochesterand earned an Associate ofApplied Science degree in Optical
Engineering Technology from Monroe Community College in 1983, and studied
Electrical Engineering part-time at the Rochester Institute ofTechnology. While raising
three children and working at JML Optical Industries, Inc., and Eastman Kodak
Company, shereturned to school to earn yet anotherdegree. In May of 1998 she earned
theBachelor ofScience degree in Computer Science atthe State UniversityofNew York
Collegeat Brockport, andthe followingfall begangraduate studies in ImagingScience at
RIT. In October of2000 she earned the Master of Science degree in Imaging Science,
andbegan doctoral studies underthe directionofProfessor JeffPelz. She is currentlyan
Abstract
The purpose ofthis thesis is to investigate human visual perception at the level of eye
movements by describing the interaction between vision and action during natural,
everyday tasks in a real-world environment. The results of the investigation provide
motivation for the development of a biologically-based model of selective visual
perception that relies on the relative perceptual conspicuity of certain regions within the
field of view. Several experiments weredesigned and conducted that form the basis for
the model. The experimentsprovide evidence that thevisual system is notpassive, nor is
it general-purpose,but rather it is active and specific, tightlycoupledto the requirements
of planned behavior and action. The implication for an active and task-specific visual
system isthat an explicit representation oftheenvironmentcan beeschewed infavorof a
compact representation with large potential savings in computational efficiency. The
compact representation is in the form of a topographic map of relative perceptual
conspicuityvalues. Otherrecent attemptsat compact scene representationshave focused
mainly on low-level maps that code certain salient features ofthe scene including color,
edges, andluminance. This study has found that thelow-levelmapsdo notcorrelatewell
with
subjects'
fixation locations, therefore, amap of perceptual conspicuity is presented
that incorporates high-level information. The high-level information is in the form of
figure/ground segmentation, potential object detection, and task-specific location bias.
The resulting model correlates well with the fixation densities of human viewers of
natural scenes, and can be used as a pre-processing module for image understanding or
ListofFigures xvi
ListofTables xxiv
1. Introduction 1
1.1 Overview 1
1.2 Problem statement 3
1.3 Outline ofthepresented work 5
2. Background 9
2.1 Historicalperspective 9
2.2 Thehumanvisual system 15
2.2.1 Imageformation 15
2.2.2 Center-surroundorganization of receptive fields 18
2.2.3 Contrast sensitivity function 20
2.2.4 Opponentprocesses 22
2.2.5 Eye movements 24
2.3 Visualattentionandselectivity 26
2.3.1 Theinfluence of attention on neural response 26
2.3.2 Orientingofattention 29
2.3.3 Behavioraldataon selectivityandcapacity limitations 32
2.4 Task-orientedvision 35
2.4. 1 Task-dependencyof visual scanpaths 36
2.4.2 Limited memoryrepresentations 38
2.4.3 Naturaltasks 42
2.5 Computational modelingof visual attention 45
2.5.1 Hierarchicalmodels ofattention 45
2.5.2 Connectionistmodels of attention 47
2.5.3 Graphical models of attention 49
3.2 Thebenefitsofeye-tracking 58
3.3 Eye-tracking
-theoryof operation 59
3.3. 1 Bright-pupil detection 59
3.3.2 Calculationof eye position 61
3.4 The VPLportableeye-tracker 62
3.4.1 Theopticsmodule and mirror 64
3.4.2 Theeye camera 65
3.4.3 Thescene camera 66
3.4.4 The LASER 67
3.4.5 Thecontrol unit 67
3.4.6 Eye-trackersetupand calibration 68
3.4.7 Eyemovementmonitoring 71
3.4.8 Portable eye-trackerprecision,accuracy, and noise 72
3.5 The ASLmodel 501 eye-tracker 76
3.5.1 Integratingheadmovements 77
3.5.2 ASLeye-trackerprecision, accuracy,and noise 78
3.5.3 Estimationand correction ofaccuracy loss 80
3.5.4 Fixation finding 82
Modular Visual Routines 87
4. 1 Introduction 87
4.2 Method 91
4.3 Results 95
4.3.1 Meanfixation durationsoftasks-pooleddata 96
4.3.2 Varianceoffixation duration-pooleddata 101
4.3.3 Statistical differences betweensubjects 106
4.3.4 Meansaccadeamplitude oftasks-pooleddata 111
4.3.5 Varianceof saccade amplitude
-pooleddata 117
4.3.6 Statistical differences betweensubjects 119
4.4 Discussion 121
Task-dependenciesofFixation Locations 127
5.1 Introduction 127
5.2 Fixationlocations ina simple environment 133
5.2.1 Method 134
5.2.2 Results 138
5.2.3 Discussion 145
5.3 Fixationlocations inan extendedenvironment 145
5.3.1 Method 146
5.3.2 Results 150
6. TheConspicuity Map 167
6. 1 Overview 167
6.2 Model description 169
6.2. 1 Inputimage processing 1 69
6.2.2 The low-levelsaliencymap 175
6.2.3 High-level proto-objectmap 187
6.2.4 Expected locationmask 1 89
6.3 Verificationofmodelusing eye-trackingmethods 191
6.3.1 Datacollection 191
6.3.2 Comparisonoffixationdensitiestomodel predictions 192
6.3.3 Determinationofmap weights 196
6.4 Natural-task images 206
6.4.1 Comparisontoextended environment 206
6.4.2 Free-viewand multi-view 213
6.4.3 Estimationoflocation bias 215
6.4.4 Expected locations 22 1
6.5 General discussionand conclusion 224
7. Conclusion 227
References 239
Figure2-1 Cross-section ofthehuman
eye, depictingimage formationcomponents...1 6
Figure 2-2 Spectralsensitivities ofthe threetypes of cones. Measurements include
light loss duetoabsorptionfromthecornea, lens, and other pigments inthe eye 17
Figure 2-3 Receptive fields oftwo types of retinal neurons: on-center/off-surround and
off-center/on-surround. Yellowareas indicate locations oflight stimulus 19
Figure 2-4 Contrast sensitivity functionwith example spatialfrequencies and
on-center/off-surroundneurontuned to thepeak response 21
Figure 2-5 Studyshowingthat scan paths aretaskdependent. Original paintingofI. E.
Repin's Unexpected Return isat upperleft, withfive examplescanpaths fora single
subject who viewedthepaintingwhilebeingaskedtoformulate answersto the
various questions 38
Figure 3-1 Imageofthepupil(white)and corneal reflection(black)as detectedbythe
eye camera. Centersareindicatedbycrosshairs. A slight offsetbetweentheactual
centers ofthe images andthedisplayedcenters is due toatimingoffsetduringdata
capture, anddoesnot affectcalculationof eye movementamplitude anddirection...60
Figure 3-2 Calculation oftheline-of-gaze 61
Figure 3-3 Portable eye-tracking headgearandbackpack 63
Figure 3-4 Topview ofheadgear 64
Figure 3-5 Opticsmodule 64
Figure3-6 Diffractionpattern usedforcalibration 69
Figure 3-7 Eyemovementtraceaftercalibration. Thesubjectwasinstructedtolookat
seconds each 71
Figure 3-8 Verticaleye position 73
Figure3-9 Horizontaleye position 73
Figure3-10 ExpandedviewofFigure 3-8 73
Figure3-1 1 Expandedview ofFigure 3-9 73
Figure 3-1 2 Eye-tracker
noise, noaveraging 74
Figure 3-13 Eye-trackernoise, two fieldave 74
Figure 3-14 Eye-trackernoise, four fieldave 74
Figure 3-15 Eye-trackernoise, eightfieldave 74
Figure 3-16 Average angulardeviation foreach ofthenine calibration points atthe
start ofthe experiment,acrosseight subjects 75
Figure 3-17 Average angulardeviation foreach of eight subjects atthe start ofthe
start oftheexperiment, across nine calibration points 75
Figure 3-18 Average angulardeviation foreach ofthenine calibration points at
mid-experiment, across six subjects 76
Figure 3-19 Average angulardeviation foreach of six subjectsatmid-experiment,
across nine calibrationpoints 76
Figure3-20 ASLmodel501 eye-tracker 77
Figure 3-21 Deviations from calibrationtargetpointsatthe start ofthe experiment,
beforeandafter correctionacross elevensubjects 80
Figure 3-22 Deviations fromcalibrationtargetpoints atthe end ofthe experiment,
before andaftercorrection,acrosseleven subjects 80
Figure3-23 Deviations fromcalibrationtargetpoints atthe start ofthe experiment,
beforeandaftercorrection,acrossnine points 80
Figure 3-24 Deviations from calibrationtargetpointsatthe end ofthe experiment,
beforeand aftercorrection,across ninepoints 80
Figure 3-25 Raw ASLeye-headdata 85
Figure 4-1 Relativefrequency offixation durations forsubjectsJB andJP forReading,
[image:13.511.44.466.147.439.2]Search,and Manipulationsduringrocket-building 89
Figure 4-2 Fixationsequences forthree sub-tasks inthe rocket-buildingtask
-Reading, Search, andManipulation. Bars indicateperiods offixation, spaces indicate
gaze changesbetween fixationpoints 90
Figure 4-3 Walkingalongahallway 92
Figure 4-4 Havingaface-to-faceconversation 92
Figure 4-5 Telephone conversation 92
Figure 4-6 Sortingcards 92
Figure 4-7 Sortingblocks 92
Figure 4-8 Readingposter 92
Figure 4-9 Readingform 93
Figure4-1 0
Countingchange 93
Figure 4-1 1 Countingredblocks 93
Figure 4-12 Meanfixation duration foreach oftheninetasks,pooled across all
eight subjects 97
Figure 4-13 95%confidence intervalofthemeanfixation durations foreach ofthe tasks. A statisticallysignificantdifference betweentwo tasks existsifthereis no overlap of thecorresponding confidence intervals. Center dotsrepresentthemeanvalues 99
Figure 4-14 Thegammadensityfunctionwith a=2and |3 1 103
Figure4-1 5 Walkhallpooleddata 103
Figure4-16 Talkconversationpooled data 103
Figure4-17 Talktelephonepooled data 104
Figure4-18 Sortcards pooleddata 104
Figure4-1 9 Sortblocks pooleddata
1 04
Figure4-2 1 Read formpooleddata 1 04
Figure 4-22 Countchange pooleddata 1 04
Figure4-22 Countblocks pooleddata 104
Figure 4-24 Relationshipbetweenmeanandstandarddeviationforall ofthetasks. From
left, tasksare: RF, CC, RP, SC, SB, TT,WH, CB,TC 104
Figure 4-25 Mean fixation duration foreachsubject, alltasks 107
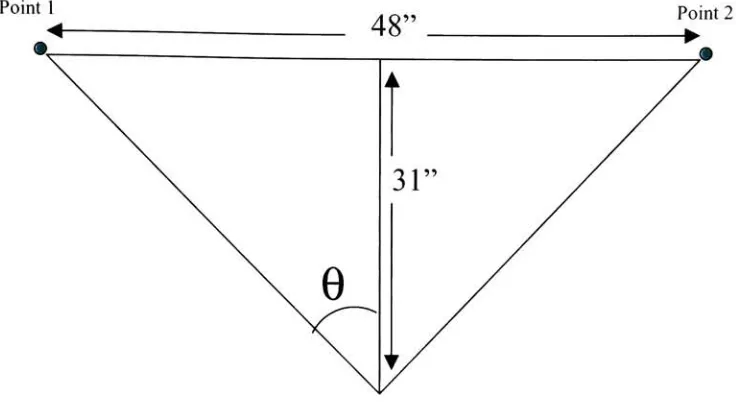
Figure 4-26 Calculationof visual anglefromfieldof view 1 13
Figure 4-27 Meansaccade amplitude foreach oftheninetasks, pooledacrossall
eightsubjects 1 13
Figure 4-28 Meansaccade amplitude foreachsubject, alltasks,with standard
errorbars 114
Figure 4-29 95%confidence intervals ofthe mean saccade amplitudesfor each ofthe
ninetasks. An overlap betweentwoor moreintervals indicatesthat there isno
statisticallysignificantdifference betweenthecorrespondingmean values 115
Figure 4-30 Walk hallpooleddata 117
Figure 4-3 1 Talkconversation pooleddata 117
Figure 4-32 Talktelephonepooled data 117
Figure 4-33 Sortcards pooleddata 117
Figure4-34 Sortblockspooleddata 117
Figure 4-3 5 Readposter pooleddata 117
Figure 4-36 Read formpooleddata 117
Figure 4-37 Countchangepooleddata 117
Figure 4-38 Count blocks pooleddata 117
Figure 4-39 Relationshipbetweenthemean andthestandarddeviationof saccade
amplitude. Fromtheleft, tasksareRP, CC,CB (lower), RF, SB(lower), TC,
Figure 5-1 Block copyingtask. This is thedisplaythatwas shown on thecomputer
screen. Thedisplaysubtendedan area of17x 13visual angle. A traceoftheeye
movement andofthehandmovementis shownasarrows connectingthedifferent
regions 1 29
Figure 5-2 Eye movementstrategies usedfor block copyingtask. Relative frequencies
ofeachstrategy fromasamplecontainingapproximatelyfiftyblockmoves foreach of
seven subjects 130
Figure 5-3 Fixation durationas afunctionoftaskdifficultyforadrivingtask 131
Figure 5-4 SortingCards 135
Figure 5-5 SortingBlocks 135
Figure 5-6 Copy-model-same-room 135
Figure 5-7 Model fromcopy-model-different-room 136
Figure 5-8 ResourceandWorkspacefromcopy-model-different-room 136
Figure 5-9 Amountoftime takenbyeach subjecttocompleteeach ofthefourtasks.
Thetasksalongthex-axis are orderedaccordingto the order of performanceby Group
1 (subjectsB, D, F, and H). Thefirst four bars foreachtaskcorrespondto theGroup
1 subjects,andthesecondfour bars correspondto the Group2subjects (A, C, E,and
G)who performedthe tasks inthereverse order 138
Figure5-10 Divisionoftimebetweenthe twodifferentregions
-sorting blocks and
sortingcards 142
Figure5-11 Divisionoftimebetweenthree differentregions
-copymodel sameroom
and copy-modeldifferentroom 1 43
Figure 5-12 Depictionoffourextended environments usedfortheportableeye-tracking
study. Clockwise fromthetopleft, Washroom, Hallway, Office, andVending 149
Figure 5-13 Relativeamounts oftimespentondifferentobjects intheWashroom
environment,pooledacross allfixationsandallsubjects 151
Figure5-14 Washroomenvironment. Time spentfixatingobjectsasthe tasksprogress
for Subject T. Tasks are, from thetop,"Washyour
hands,"
"Fill acupwith
water,"
and"Comb your
hair."
Figure 5-15 Relativeamounts oftimespent ondifferentobjects intheHallway
environment,pooled across allfixationsand all subjects 155
Figure 5-16 Relativeamountsoftimespentondifferentobjects intheOffice
environment,pooled across allfixations and all subjects 157
Figure 5-17 Relativeamounts oftime spent ondifferentobjects intheVending
environment, pooled across all fixations,and all subjects 158
Figure 5-18 Hallwayenvironment. Timespentfixatingobjects as the tasksprogress for Subject T. Tasksare, fromthetop,"Throw something inthe
garbage,"
"The fire
alarmjustwent
off,"
and"Findabathroom." 160
Figure 5-19 Officeenvironment. Time spentfixatingobjects asthetasksprogressfor Subject U. Tasksare, fromthetop, "Getsupplies fromthe
closet,"
"Workatthe
computer,"
and"Makea
photocopy."
161
Figure 5-20 Vendingmachine environment. Time spentfixating objects asthe tasks
progress for Subject U. Tasksare, fromthetop, "Checkfor Skittles,"
"BuyaSnickers
bar,"
and"Checkforchange."
1 62
Figure 5-21 Comparisonoffixationtypes 1 64
Figure 6-1 Constructionofthe Conspicuity Map 170
Figure 6-2 Creationofthecolormap fromphotoreceptor responses. Upperleft is input
image,upper right is CI (red/green) signal, lower left is C2 (blue/yellow) signal,and lowerright istheresultingcolor map. Darkblue areas inthesignal maps correspond
tolowsignal values, yellow correspondstomedium signalvalues, andred
correspondstohigh signal values 1 76
Figure6-3 Intensitymap forexample input imageofFigure 6-2 177
Figure 6-4 The sevenlevels ofthemulti-resolution Gaussianpyramidforthe example
input image 178
Figure 6-5 The sevenGaussianconvolutionkernelsofthe Laplacianpyramid. They
are usedto createthebandpass filtersthatdetect a specific range offrequenciesinthe
inputimage. The spatialdomainrepresentationisshowninthetoprow,andthe
correspondingfrequencydomainrepresentationisshown inthebottomrow 1 80
Figure 6-6 Sixbandpass filters usedtodetect frequencies of aparticular rangeinthe
input image. F1-F2 isellipticalin shapebecause fl isodd-sized(5x5) andf2 is
Figure 6-7 One-dimensionalfrequencyresponsecharacteristicsofthesixbandpass
filters shownin Figure 6-6. Notethat only therighthalfoftheresponse curves are 181 shown, i.e., theyaresymmetrical aboutthe origin 1G1
Figure 6-8 Six levels ofthe Laplacianedge cube (difference-of-Gaussians) derived
fromtheseven levelsofthe Gaussianpyramid(labeledLO
-L6)afterweighting each
Laplacian levelbytheresponse fromthecontrast sensitivity function. Toprowfrom leftL0-L1, L1-L2,andL2-L3. Bottomrowfrom leftL3-L4, L4-L5, andL5-L6....183
Figure 6-9 Basis functionsoftheGaborfiltersused tomodelthetuningofreceptive
fields inareaVI ofstriatecortex. Fromleft, 0, 45, 90, and 135 184
Figure 6-10 Fouroriented edge signals andresultingorientededge map. Toprow from
left, 0, 45. Middlerow,fromleft, 90, 135. Bottomrow,false-coloredoriented
edge map 185
Figure6-1 1 Low-level featuremaps andresulting low-level saliencymap. Toprow,
fromleft,colormapandintensitymap. Bottomrow fromleft, oriented edge mapand
saliencymap 186
Figure 6-12 Creationofthebinaryproto-object map. Toprow fromleft, inputimage,
estimation ofbackground,andforeground segmentation. Bottomrowfromleft, after
thresholdingtheforeground image andCanny edgedetection, afterdilation, and after
holefilling and erosion 188
Figure6-13 ComparisonofF/Mratiosfor 76 images insetA,free-viewcondition.
Threemaps were generated foreachimage, as givenin Equations 6-15 through 6-17.
images numbered44-47, 64-66, 69-71,and 80-83 areduplicateimages, and not
shownhere 195
Figure 6-14 Comparison F/Mratios for 76 images insetB,free-viewcondition. Three
maps were generated foreachimage, as givenin Equations 6-15through 6-17.
Imagesnumbered 1-4, 44-47, 67,68, and80-84are duplicate images,and are not
shownhere 196
Figure 6-15 Mean F/Mratios forthe threedifferentmaps,averagedacross all 152
images 200
Figure 6-16 Exampleimages andoverlaidfixationplotforwhichtheoptimal weights
werefound usingtherandom weight generationmethod. The correspondingweighted
conspicuitymap (C-Map)is shownbeneatheachimage. Fromleft, Al, A28,
B17 200
Figure 6-1 7 F/MratioforsetA images,free-view
condition,usingthe C-Map. The
F/Mratios fortheotherthreemaps arethesame as showninFigure6-13,andare
74isoffthe chart andhas a valueof6.89 204
Figure 6-18 F/Mratio forset B images,free-view condition,usingthe C-Map. The F/Mratiosforthe otherthreemaps arethe sameas shownin Figure6-14,and are
included forcomparisonto the C-Map 205
Figure 6-19 Mean F/M ratiosforall 152 images using four differentmaps 206
Figure 6-20 Fournatural-taskimageswith overlaidfixationplotsfromonesubject, free-viewcondition, andcorrespondingmaps. Fromleft,Washroom(Al), Hallway
(A2),Office(A3), andVending(A4). Maps are,from toptobottom, theCIEmap,
the Pmap, theCIEPmap, andthe C-Map 208
Figure 6-21 Fixationdensityplots for free-viewandthreemulti-viewconditionsfor four images. Imagesare fromtop, Washroom, Hallway,Office, andVending
Machine 210
Figure6-22 F/M ratiosfor free-viewand multi-view conditions forthe fournatural-task images. Acomparison isshownbetweenthelow-level CIE map andthehigh-level
perceptual conspicuityC-Mapforeachimage 214
Figure 6-23 F/Mratiosfor 1000 randomlygeneratedfixation locations 215
Figure 6-24 F/M ratioscomputedformixedimageand fixation data. Eachchartis for
one ofthefour images forwhichtwomaps werecomputed, CIE map (saliency)and
C-Map(conspicuity). The free-view fixation data is indicated alongthex-axis 217
Figure 6-25 Histogramsoffixation distances fromthe centerof eachimage 219
Figure6-26 F/M ratiosforrandomfixations restrictedto lA imagesizedistance from
center, and i/i6 image sizedistance fromcenter 220
Figure 6-27 Ninegrid locationsusedtocompute theexpectedlocation map 22 1
Figure 6-28 F/Mratiosfor different locations inthe C-Map,foundbyturningon asingle
List
ofTables
Table 3-1 Newell'stemporalhierarchyofbrain organization 58
Table 4-1 Time inseconds and number offixations (inparenthesis) pertaskforthe
eightsubjectswho performedtheexperiment 94
Table 4-2 OrderoftasksforGroup 1 and Group2 94
Table 4-3 Taskabbreviations 96
Table4-4 Pairwisecomparisons forsignificantdifferences infixation durations
betweentasks. An Xindicatesthatastatisticallysignificantdifference exists
betweenthecorrespondingtasks intherow and column 98
Table 4-5 Hallway Walking (WH) 107
Table 4-6 Conversation(TC) 107
Table 4-7 TelephoneTalking(TT) 107
Table 4-8 SortingCards (SC) 107
Table 4-9 SortingBlocks(SB) 107
Table 4-10 ReadingPoster(RP) 107
Table 4-11 ReadingForm(RF) 107
Table4-12
CountingChange(CC) 1 07
Table 4-14 SubjectAtaskdifferences 109
Table 4-15 Subject Ftaskdifferences 109
Table 4-16 Subject C taskdifferences 109
Table 4-17 Subject Htask differences 109
Table 4-18 Subject Etaskdifferences 109
Table 4-19 Subject Gtaskdifferences 109
Table 4-20 Subject B taskdifferences 109
Table 4-21 Subject D taskdifferences 109
Table 4-22 Pairwisecomparisons forsignificantdifferences insaccade amplitude
betweentasks. An X indicatesthatastatisticallysignificantdifference exists
betweenthe correspondingtasks intherow and column 114
Table 4-23 Hallwaywalking(WH) 119
Table 4-24 Conversation (TC) 119
Table 4-25 Telephone talking(TT) 120
Table 4-26 Sorting cards(SC) 120
Table 4-27 Sortingblocks (SB) 120
Table 4-28 Readingposter (RP) 120
Table 4-29 Readingform(RF) 120
Table 4-30 Countingchange(CC) 120
Table 4-31 Countingblocks (CB) 120
[image:20.511.41.468.300.633.2]Table 4-32 Summaryofresults from studyof naturaltasks 122
Table 5-1 Statistical comparisonofcompletiontimes forthesubjects ofGroup 1 and
Group 2. Ineach casethe nullhypothesis isrejected (h=0), indicatingthat thereisno
statisticallysignificantdifference betweentheorderingofthe tasks interms of
Table 5-2 Orderofinstructions forGroupAand GroupB duringextended
environmentstudy 1 47
Table 6-1 MaximumF/M ratiosand associated weightsforthree exampleimages usingtherandom weight generationmethod. 10,000 trials 200
Table 6-2 MaximumF/M ratios andassociated weights forthree example images usingthe genetic algorithmmethod. 2,400trials. #Gensrefersto the actualnumber
oftrialsrequiredbeforeasolutionconverged. Images A30,A32, A76, B30, andB88 arenotincludedintherangedata becausethe weights were greaterthan 50,dueto
manymutations 203
Table 6-3 Instructions formulti-view part oftheexperiment 207
Table 6-4 Threemost frequentlyfixatedobjects and percentage oftime spentlooking atthoseobjectsfor each ofthe tasks intheextended environment studyfrom Section
5.3,overall subjects 212
Table 7-1 Classification oftasksinto featurevectorcorrespondingtoboththe level of visual engagement withtheenvironment and amount of strategicplanning
Introduction
1.1 Overview
Visual perception is an inherently active and selective process. As an individual goes
about performing daily activities, the visual system is constantly monitoring the
environment to provide the individual with information about the scene that will enable
meaningful interactions or contemplative study. The outcome is usually a change in the
cognitive state ofthe individual that leads to the realization ofa plan ofaction. In this
sense, vision is not a passive process whereby information is merely collected and
processed or perhaps stored for later retrieval, but rather it is an active process that
integratesspecific, localaspects ofthe scene with goal-orientedbehavior. Consequently,
thepurpose of visionisto servetheneeds ofthe individual asthoseneeds arise.
An essential component of active visual perception is a selective mechanism.
from the retina to the cortex. The advantage of selecting less information than is
available isthat themeaningof aparticular scene or imagecanberepresentedcompactly,
thusmakingoptimal use oflimitedneural resources.
Currently, it is uncertain exactly what use the study of eye movements is for
understanding human behavior (Viviani, 1990). Recent studies support the ideathat eye
movements are an external manifestation ofselective attentionand canplayan important
role in indicating which attributes of the scene carry the most pertinent information.
Patterns of visual fixations overtimeas well as space canreveal cognitive strategies that
are not amenable to conscious control or verbalization, and as such can be thought ofas
providing a windowinto pre-consciousthought. The locations offixationsas well asthe
particular sequence have beenshowntobe dependent uponnotonlythe characteristics of
the scene, but also upon the goals of the observer. The results of an eye movement
analysis can yield important insights into the nature ofdecision-making and reasoning
underavarietyof environmental andtask-specific situations.
Thepurpose ofthis thesis isto developabiologically-plausiblemodel of selective
visual perception for individuals who are engaged in realistic, everyday tasks such as
walkingdownahallway, filling acupwithwater, or makingacopy at a copier machine.
The model is in the form ofheuristics gleaned from eye-tracking studies conducted on
subjects navigating in natural, extended environments, and is combined with a
computational simulation of low-level properties of the primate visual system. The
computational aspects ofthe model augment the heuristics to provide a detailedaccount
Manystudieshave beenconductedshowingthateye fixationsarenottorandomlocations
in the field, but rather to regions in the image or scene that rate high in information
content, such as edge density, colorfulness, or luminance contrast. Presumably, a
random selection processwould notbean efficient means ofgatheringvisualinformation
forsomeonewhoisengagedina visual task,whetherthe taskrequires formulatinga plan
of action orjust contemplative thought. Thus, strategic planning of saccades plays an
importantrole in extractingusefulinformation. Anunresolvedquestionis howthe visual
system determines what strategy to use when deciding where in the scene to look next.
More specifically, what is the role of context in determining oculomotorbehavior? The
central hypothesis ofthis thesis is that it is the subjective, orperceived, conspicuity of
context-relevant objects in the scene that guides the fixation strategy, in addition to the
objective amount ofinformation inherent inthesceneatthepotentialtarget offixation.
Recent attempts at computational modeling of the human visual system have
focused mainly on bottom-up, or stimulus-drivenprocessing, in other words, processing
that begins with pixel counts from the digitized image and proceeds upward through
successive layers of increasing abstraction. The idea is to detect luminance differences
directly from the digitized image, and from those differences locate edges, boundaries,
homogeneous regions, surfaces, and eventually objects and their 3D representations.
Scene semantics arrive last in the chain of processing, ifat all. An advantage ofthis
approach is that the scene is represented in its entirety
computationallyprohibitiveanddoes not make optimal useoflimitedneuralresources.
An alternative to bottom-up processing is top-down, or task-dependent
processing. With top-down processing, one might begin with a conceptualized object
described in abstract terms, such as "a chair has four legs"
and proceed downthrough a
hierarchy of increasing detail, eventually reaching a scene description in terms of
primitive features. The disadvantage here is the difficultyofconceptualizing abstract, or
non-representational items, however the advantage is a compact representation of the
scene semantics.
A model based on selective perception and perceived conspicuity combines
aspects ofboth bottom-up and top-down information in a unique way. The degree to
whichbottom-up ortop-down is employed is largelyafunction ofthe goals ofthe system
and its current state. The result is a computational model of visual perception and
processingthat isa reflection ofthe ongoing interaction between an active visual system
andtheenvironment.
This thesis is devoted to the goal of showing that the perceptually significant
information content ofany particular region in an image or scene must ultimately take
intoaccountthe implicit semantics ofthat image or scene
-that is, the "meaningfulness"
ofthe scene forthe viewer. This approach implies that specific objects, as well as their
relative and expected locations play an important role in determining meaningfulness in
natural scenes, especially when combined with action-implied imperatives. The
low-level,bottom-upfeatures such as edges, colors, andluminancecontrast cannotbeignored
willbe shownthatsuccessfullypredicting fixation densities innatural imagesand inreal,
extended environments requires computational algorithms that combine bottom-up
processing with top-down constraints in a way that is context-sensitive and ultimately
mostmeaningfulfortheviewer.
1.3 Outline ofthe presented work
The remainder of this thesis is organized as follows: Chapter 2 highlights background
material that is essential for a complete understanding of the issues involved in
computational modeling of selective visual perception and human visual behavior in
natural, unrestricted environments. This chapter includes a detailed historical account
andreviewofthe literature showing howprevious workhas led to the present state ofthe
field. Issues relating to the physiology of the human visual systems, attentional
mechanisms, task-oriented vision and natural tasks are discussed, as are variations in
approachesthathave beenappliedto thecomputationalmodelingof visual attention.
Chapter 3 is an outline ofthe experimental method that was applied in order to
extractdataonhumanvisual behavior innaturalenvironments,as well as inthe restricted
environment of2D imageviewing. Studying eye movements outside oftheconfines of a
restricted laboratory setting is a topic of current interest, yet this research area remains
largely unexplored and undocumented in the literature. Novel hardware and software
were developed by the Visual Perception Laboratory at the Rochester institute of
Technology to enable a thorough data collection and analysis procedure. The results,
hardware, as well as the software that was developed for the eye-tracking sessions and
dataanalysis, is included in Chapter 3.
Chapter 4 describesa result gleaned fromevaluating eye-tracking data inthe real
world:thatvisual routinesaresomewhat
"modular"
innature. Thatis,when metrics such
as fixation duration, saccade amplitude, and gaze-change interval are used to describe
certain
"primitive"
visual behaviors such as reading text or having a face-to-face
conversation, stereotypical patterns of oculomotor behavior result. This evidence
supports thehypothesisthat thehumanbrain isorganizedin sucha wayas tomake use of
pre-determined low-level visual routines in order to enhance functioning in a complex
and constantly changing environment. Pre-determined routines may affect perceived
conspicuitybyrestrictingthefocus of attentiontoexpectedusefullocations.
Chapter 5 is an extended study into the high-level visual strategies employedby
people that either enhance or detract from perceptual conspicuity in the environment.
For example, when walking along a corridor after a high-cognitive load task has been
imposed (memorization of a random block pattern), fixations tend to be longer, more
centrally located in the scene, andhave shorter saccade amplitudes than whenthere has
beenno cognitive load imposed. This impliesthat objects inthe environment thatwould
have attracted attention when the task is not cognitively challenging do not do so when
thesystem isotherwiseoccupied.
Chapter 6 outlines thecomputational model that is developedandused to predict
fixation densities on natural-task images and in the real world. The model is a
andtop-down, task-orientedconstraints. Themodeltakes the formofatopographic map
of perceivedconspicuity values, where the value at a coordinate in themap is a measure
ofhow important thatcoordinate is for perception. The model is a partial adaptation of
thestimulus-driven approachtakenbyothers (as discussed in Chapter2), yet it is original
in the sensethat ituses anovel method to take into account context-sensitive information
about the sceneatboth the higher levelsand the lower levels. A novel algorithm isused
toinhibitregions inthe scene thatarenotlikelytobe perceptually importantand enhance
those regions that are. The resulting model is shown to correlate well with the fixation
densities ofhuman subjects.
Chapter 7 is a summaryand conclusion ofthe work presented in this thesis, and
Background
2.1 Historical perspective
One ofthe earliest theories of spatial attention, the attentional spotlight, originates from
the psychophysical work of Herman von Helmholtz (1867). The spotlight metaphor
capturesthe concept ofan"internal eye"
i.e., an implicit foveawhich localizes an object
in space and focuses all ofthe processing on that one object before moving to another
location in the field. Any information that is not centered on the implicit fovea is
diminished.
The idea ofusing a spotlight as a metaphor for attention was further developed
later in the 20th century (Crick, 1984; Treisman, 1982). Within the spotlight objects
whicharebeingattended to arehighlighted, orilluminated, sothatinformationaboutthat
object will be processed more efficiently and at ahigher level than other objects in the
existence of an attentional spotlight (Sagi and Julesz, 1986), however most current
thinking considers the metaphor to be too simplistic to capture all of the nuances of
selective attention. The early evidence points to observations made during
psychophysical studies offilteringtasks. Forexample, Sagi andJulesz (1986) studiedthe
ability ofsubjects to discriminate the orientation ofbriefly presentedbar targets located
in the periphery. On some trials a small light was flashed close to theperipheral target,
on other trials the light was flashed near a peripheral non-target. Subjects were able to
detectthe light onlywhenitwasflashedwithina certain area nearthetarget, eventhough
in both cases the light was located at the same foveal eccentricity. The authors suggest
that the area aroundthe target at whichthe light couldreliablybe detected delineatedthe
contour ofthespotlight of attention.
Other studies have demonstrated that the area covered by the spotlight does not
necessarily cover contiguous regions in the field (Pylyshyn and Storm, 1988). Duncan
(1980) showed subjects a circular display containing eight characters from which they
were to locate the target letter, Q. Distractor letters were either O's and C's, or O's and
K's,placedat random circular positions inthe display. Subjectsweretoldahead oftime
which four ofthe eight positions the target could be located in (the relevant positions).
Theotherfourpositions wereirrelevantand couldbe ignored.
The study found that the O and C distractors had little effect on the subjects'
ability to locate the target, regardless of whether they were located in the relevant or
irrelevant field. When the O and K distractors were in the relevant field search times
were slowed, presumable because of feature interaction (Treisman and Gelade, 1980).
field search times were not slowed, presumably because the subjects were able to attend
to the non-contiguous relevant locations while ignoring the also non-contiguous
irrelevant locations. The abilityto attend to non-contiguous areas when the demands of
the task so require is evidence that high-level processes can mediate the acquisition of
visual stimuli.
Another study found that the spotlight does not end abruptly at one location
before it moves to the next, nor does it sweep continuously across the field of view
(Sperling and Weichselgartner, 1995). Processing is completed in a select area, fades,
and then moves to a new area to resume building strength there. An extension ofthe
spotlightmetaphor forattentional capture is thezoom lens metaphor, which suggests that
the area under consideration is examined with variable spatial extent (Eriksen and St.
James, 1986). In this case the amount of detail available for processing is inversely
relatedtothe sizeoftheareabeingprocessed.
The theories mentioned thus far have assumed a serial mechanism for selection,
i.e.,the focus ofprocessing iscompleted at a single select regionbefore movingonto the
next region. An alternative to focused, serial processing of attention is dispersed, or
parallel processing, originating with the work of James (1890). With dispersed
processing, the focus of attention is spread uniformly across the field of view. Neisser
(1967) was the first to show that the two theories need not be mutually exclusive, but
rathermay bethought ofas part ofthe same process existingattwo distinctphases. The
pre-attentive phase isthe earlier stage interms ofprocessing, andis consideredrelatively
attentivestage integrates information fromaparticularareaofthe field, andis considered
slow, voluntary,and progresses serially fromone regionto thenext.
Much ofthe work that has been conducted on the 2-phase theory of selective
perception has been under the experimental paradigm known as visual search. In this
paradigmthe amountoftime it takes to complete a searchis plotted as a function ofthe
total number ofitems in the display. A flat response indicates a fast, parallel process,
whereas a linear response indicates a slower sequential process. The feature integration
theory of selective visual attention (Treisman and Gelade, 1980; Treisman, 1988) is an
attempt to define the purpose of focused attention using the visual search paradigm.
According to feature integration theory, elementary features such as color and shape are
processedbeforeobjectsthatrequire a conjunction ofseveralfeatures, such as abluebox,
or a gray kitten. Focused attention is necessary to conjoin the separate features, which
thenenables properidentification oftheobject.
A series of experiments were designed to distinguish between features that are
elementary (also called integral) and features that are separable and require focused
attention for integration. The hypothesis was that an integral feature would elicit a flat
response time and exhibit
"pop-out"
in a field of distractors, whereas an object with
separable features would require a sequential (conjunctive) search and elicit a linear
response time. The results showed that when the elementary features were chosen to be
colors or shapes (for example a green object in a field of red distractors), search times
were constant with the number ofdistractors. When separable featureswere chosen as a
conjunction oftwo elementary features (a green disc in a field of green squares and red
A hallmark of the theory is that the pre-attentive stage extracts the primitive
features in parallel across the visual field, and the attentive stage is required for binding
the separable features within a small part ofthe field. As evidence againstthe theory, it
has been shownthat itis possible to perform some conjunctive searches in parallel ifthe
separable features consist ofcolor, motion, or depth (Nakayama and Silverman, 1986).
Also, recent studies have shown that reaction times for conjunctive searches can range
from close to 0 seconds per item (pop-out) to 30-50 milliseconds per item, depending
upon the degree ofsimilarity between the target and the distractors (Deco, Pollatos and
Zihl,2002).
Two-phasetheoriesof visual attentiondonot explicitly describe howthe selection
process is controlled. Questions such as "what is the region ofinterest?" and "where
should the next fixationbe?" can be approached by considering the purpose offocused
attention.
Thenotion ofasaliency mapwas proposedto definetherelationship betweenthe
components of a scene according to their relative importance to the observer (Koch and
Ullman, 1985; MahoneyandUllman, 1988). The essential components of asaliency map
include a priority map for rating the relative components of the scene, and a gating
mechanism whereby the selected regions are processed and the non-selected regions are
inhibited. According to the theory, the visual system performs an initial low-frequency
parsing ofthe environment to identify potential regions ofinterest, and assigns to each
region a weight according to the computed saliency. For example, bright colors, high
assignedaheavyweight. This information isrecordedinatopographic mapofthe scene,
which indicatestheweightofeveryelementinthatscene.
The map is dynamic in the sense that the gatingmechanism chooses the element
with the highest current weight to be the target of focused processing, and then
suppresses this element when processing is complete. An inhibition-of-return (Posner
and Cohen, 1984) mechanism is used to reduce the saliency at the current focus of
attention sothat thenext highestregionmay beselected forprocessing. This mechanism
isthought tobiastheattentional resources towardnovel stimuli thatappearinthe fieldby
reducingthesalience of an itemthathas beenviewedforat least 300msec.
The guided search model (Wolfe, Cave, and Franzel, 1989; Wolfe, 1994) is an
adaptation of the visual search paradigm that uses the concept of a salience map to
prioritize potential items of focused attention. The basic idea is that a parallel-feature
computation stage guides a later serial attentive stage. The highly salient targets should
be detected more quickly thannon-salienttargets, givingrise toconstant searchtimes for
elementary features. Slower, conjunctive search times are the result ofthe contribution
of noise from competing feature dimensions during the parallel feature computation
stage.
Alternatives to the guided search model are the search via recursive rejection
model (Humprhreys and Miiller, 1993) andmodels basedon signal detection theory (see
Verghese, 2001, for a review). The search via recursive rejection model (SERR) is a
connectionist model that recursively rejects regions where clearly defined grouping of
distractors occur. In other words, if stable groupings occur everywhere at the lowest
(differently grouped) distractors. Search is slowed when groupings contain elements of both target and distractors. Signal detection theory uses a variable threshold to distinguish between fast search and slow search. The threshold is usually described as a decision rule that depends upon distractor discriminability rather than a parallel/serial dichotomy. Accordingly,the decisionruletakes intoaccountawide range offactorsthat
might contribute to search response times, and does not assume a parallel pre-attentive stageis followedbyaserialattentivestage.
Insummary, the historyofthoughtonthe topicof selective visual perception
begins with the earliest metaphors of an internal eye, and a spotlight or zoom lens of
focused attention. From there, the visual search paradigm has produced theories describing apre-attentive and attentive processing ofintegrated features, and progressed to the more current concepts of atopographicmap ofsaliencyvalues or signal detection.
What remains is a means of incorporating context sensitivity and task-relevancy into theories of selectivevisual perception.
2.2 The human visual system
2.2.1 Image formation
Light fromthesurroundingareaenters theeye and undergoes severaltransformations that enable the brainto make use ofinformationfrom that surrounding. The transformations are both optical and neural in nature, and begin with the transformation oflight energy
Cornea
Retina
Optic nerve
55* M' 4tf 70
Xf llf 0' Wc 2CM
<Kf W 6f 7<f SO Visual Angle{degrees fromfovea)
Figure 2-1 Crosssection ofthehumaneye,depictingimageformationcomponents. Adapted
fromPalmer, 1999
The retina is a layer of neural tissue approximately 0.4mm thick and is the
repository of over 100 million light-sensitive photoreceptors called rods and cones
(approximately 100million rods and 5 million cones ineach eye). Figure 2-1 shows that
the distribution of rods and cones across the surface ofthe retina is highly uneven, with
most ofthe cones located ina small central area oftheretinacalledthe fovea. The cones
are responsible for bothcolorperception andhighvisual acuity; thus,the eyes mustmove
in order to obtain detailed, high-resolution information from different regions in the
visual field. The area of the field covered by the fovea is approximately 2
of visual
angle, whichis approximatelythewidthofathumbextended an arm'slength.
Retinal cones canbe classified into oneofthree different types, dependingupon
the wavelength sensitivity ofthe cell's photopigment
(for short, medium, and long wavelength response). Figure 2-2 shows the spectral
sensitivities ofthe threeconetypes.
1.0
B 0.8
G ii c/j -a <u
"3
o
0.6
0.4
0.2
0.0
sco/ie\ M-copeX
/
N L-conesA
/\
\
/
\
1\
/
/'\
'
400 500 600
Wavelength,nm
700
Figure 2-2 Spectralsensitivities ofthe three typesof cone photoreceptors. Measurements
include light loss duetoabsorptionfromthe cornea,lensand other pigmentsintheeye. From StockmanandMacLeod,1993.
The absorption ofphotons by the S-cone photoreceptors is significantly different
fromthatofthe M- and L-cone photoreceptors. The S-conesare particularlysensitive to
short-wavelengthphotons and arethe primary detectorswhen short-wavelengthlight is at
the threshold ofdetection. Both the M- and L-cones will detect longerwavelength light
since there is a greater amount ofoverlap in those response curves. Also, S-cones are
knowntobe relativelyrare inthe retina and are not present at all inthe centralpart ofthe
fovea (Wandell, 1995). S-cones are spaced relatively far apart in the fovea, with a
spacingof 10arc minutes,whereasthe spacing forthe L- andM-cones is0.5 arc minutes.
The consequence of wide spacing is that the sampling frequency is reduced for the
mosaic is that the visual system will encode only relatively slowly varying spatial and
temporal signalsoriginating intheshortwavelength regionofthespectrum.
2.2.2 Center-surround organization ofreceptivefields
Retinal neurons and cortical neurons develop fromthe same bio-chemical processes, and
as such the retina can be considered to be part ofthe central nervous system (Wandell,
1995). Muchofthephysiological andorganizational propertiesofthecortex applyto the
retina as well. Similar to the cortex, the retina is amulti-layered surface, with the first
few layers ofthe retina consisting of ganglion cells that exhibit spatial interaction with
neighboring cells. Neurons in each layer excite corresponding neurons at a higher layer
and inhibit neighboring neurons in the same layer. The result of the network of
connections is called lateral inhibition. The network projecting from any particular
neurontoneighboringneuronsis calledthe projectivefieldofthatneuron. Thepatternof
connections in the opposite direction, from the receiving neuron to those neurons that
influenceit, iscalledthe receptivefield ofthatneuron.
As mentioned earlier, visual perception can be described as a series of
transformations that begins with the input ambient light array and proceeds through
higher levels of cortical processing. Since the receptive field ofa retinal neuron is the
area in which light influences the neuron's response, lateral inhibition and receptive
fields canbe thoughtof asthetransformationproperties of retinal neurons.
The receptive field of a neuron in the retina can be described as having a
of action potentials results. However, if light activates only the central part of the
receptive field and not the surroundingarea, an elevated response interms ofthe
firing-rate with respectto therandom response willresult, andthe neuronis saidto havean
on-center/off-surround organization. For this case, light activating only the inhibitory
surround will cause a significant decrease in the firing rate. A neuron exhibiting the
opposite pattern of activation is said to have an off-center/on-surround organization.
Figure 2-3 depictsa schematic ofthe differentresponse properties of retinal neurons.
Stimulus Response Stimulus Response
O^O
On-center/off-surround Off-center/on-surround
Figure2-3 Receptive fieldsoftwo typesof retinal neurons: on-center/off-surround and
off-center/on-surround. Yellowareasindicate locationsoflightstimulus.
The receptive field structure of neurons continues along the central nervous
system from the retina to the lateral geniculate nucleus (LGN) ofthe thalamus and onto
area VI (primary visual cortex), with some qualitative differences. For example, the
have elongated shapes and are orientation anddirection selective. Also, cortical neurons
can be classified into two broad categories: simple and complex (Hubel, 1988). Simple
cells have response properties that conform to linearity and superposition principles,
whereas complex cells donot.
2.2.3 Contrast sensitivity function
The contrastsensitivityfunction (CSF) is typically defined as the sensitivityof observers
to sinusoidal gratings ofvarying frequencies. Thetechnique used to measure the CSF is
to askobserverstoadjust athresholduntil ajust-noticeable difference betweena uniform
gray fieldandasinusoidal pattern is detected. Whenthresholds are measuredforarange
offrequencies, acontrast threshold function is plotted showing the minimum contrast at
threshold as a function of spatial frequency. The reciprocal ofthe contrast threshold
function is the contrast sensitivity function. A typical contrast sensitivity function is
depicted in Figure 2-4, showing that frequencies inthe range of4-5 cycles perdegree of
o
high
o
o
E0 s *u
sn
83
u
S
o U
low
llllllll
10 100
Spatial frequency(cpd)
Figure 2-4 Contrast sensitivity functionwith example spatialfrequenciesand
on-center/off-surround neurontuned to thepeak response. Adapted fromWandell,1995.
The CSF can also describe a retinal ganglion cell's receptive field. The most
effective frequency for any ganglion cell is a measure ofthe size ofthat cell's receptive
field (Wandell, 1995). For example, Figure 2-4 depicts an on-center/off-surround
ganglion cell whose peak response is at the peak sensitivity of the contrast sensitivity
curve, i.e., the most effective spatial frequency for this cell is the intermediate
frequencies. At lower spatial frequencies, light falling on the surround reduces activity
from the center, and at high spatial frequencies, light falling on the center is averaged
over severalcycles, again, loweringthe overall activity.
In general, contrast patterns such as sinusoidal gratings at afixed luminance level
providean effectivemeasure ofthe input/output behavior of neurons. Adaptation effects
operating over a very large range ofluminance levels make direct comparisons difficult
because of the highly non-linear response characteristics of neurons. Therefore, a
response can then be characterized by cumulative comparisons over a range of mean
luminance levels.
2.2.4 Opponentprocesses
In 1867 Helmholtz described what has come to be known as the trichromatic theory of
color vision (Helmholtz, 1867/1925). Essentially, this theory describes colorperception
as the result ofthe three photoreceptors response to photons of a particular wavelength.
Any single photoreceptor cannot distinguish between different colors - it
is the overlap
among the three spectral response curves that contributes to the unique perception of
color.
Trichromatic theory explained much about color perception, such as the
psychophysical observationthatanyperceived color canbe matchedbya combination of
the threeprimary colors ofred,blue, and green. It cannot explainmany subjective color
experiences, however, such as theobservationthat certain color combinations such as red
and green, or blue and yellow are not easily imagined as a single color. In addition it
does not explainwhycolor visiondeficiencies are always theresultofthe loss of pairs of
colors
-red and green,orblueand yellow. Also, psychologically, yellowappears tobea
primary color and not the combination of red and green as would be predicted by
trichromatic theory.
In 1878 Ewald Hering proposed the opponent process theory ofcolor perception
to explain the perceived, or subjective, experience of color (Hering, 1878/1964).
Opponent process theory describes color perception as the result of four chromatic
primaries that are arranged in polar pairs
and yellow form the other polar pair. Each of the three retinal receptor types are
responsible for detecting photons of the proper wavelength range along one polar
dimension
-the R/G dimension, the B/Y dimension and an achromatic dimension of
black/white that detects luminance levels. Physiologically, Hering theorized that the
experience of red could be the result ofa sufficient amount of a certain chemical in the
R/G photoreceptor, andthe experience ofgreen couldbe the result ofadepletion ofthat
chemical on the same photoreceptor. Hurvich and Jameson (1957) conducted
psychophysical experiments to verify predictions of opponent-process theory, using hue
cancellation techniques. The central idea was that the if blue and yellow are polar
components ofthe same mechanism, then one should be able to cancel the amount of
"blueness"
in a light by adding a certain amount of "yellow". The results ofthose
experiments showedstrongevidence supportingthe opponent-processtheory.
In 1905 von Kries laid the foundation for a dual-process theory of color
perception that consists oftwo sequential stages of color processing
-a trichromatic
stage atthelevelof retinal photoreceptors and an opponent-process stage at ahigher level
(von Kries, 1905). More recent physiological studies have shown that color opponent
cells exist in the LGN of macaque monkeys and that both processing stages are
performed intheretina(DeValois, 1965,andDeValois, AbramovandJacobs, 1966).
The implicationofdual-processtheoryforvisual perception at ahigher, conscious
level of awareness is that the re-parameterization of responses from the three
photoreceptors to a more psychological color appearance is that it is more ecologically
useful. Separating luminance from chromaticity is advantageous because it allows the
fallingover a surface (ameasurement alongtheluminance axis) andchanges in the scene
that result from encountering a new surface (a measurement along one of the
chrominance axes).
2.2.5 Eyemovements
In general, eye movements fall under two broad categories
-smooth and saccadic.
Smooth eye movements, such as smooth pursuit, vergence, and the vestibular-ocular
reflex (VOR) enable the tracking ofmoving objects, whereas saccadic eye movements
are swift and abrupt, and allow the eyes to shift fixation from one object in the fieldto
another. The optokinetic response (OKR) is a combination of both a smooth and a
saccadic movement, and is characterized by a slow, smooth phase followed by a swift,
saccadic snap ofthe eyes back in the direction opposite the movement of the tracked
object. From a cognitive point ofview, a saccadic eye movement isthe more interesting
oculomotorbehavior primarily because it is an external manifestation of a pre-conscious
choice, i.e., the eyes must move in orderto obtain detailed, high-resolution information
frominterestingareas intheenvironment.
Saccades are high velocity, ballistic eye movements that have the function of
bringing retinal images of objects ofinterest from the periphery to the fovea for closer
inspection. Atypical saccade takes approximately 150
-200msec to plan and execute
-planning takes about 150 msec on average and the duration of the eye movement is
approximately 20 msec plus 2 msec per degree of visual angle (Carpenter, 1988).
Saccades can reach up to 900 degrees per second, and individuals typicallymake 3 or4
Studies on eye movements during reading have shown that saccades during
reading are typically seven letters long, which results in a saccade length ofbetween 1
and 2 for reading standard size text at a distance of40cm (O'Regan, 1990). There is
also a wide distribution of within-word target landing for reading text, i.e., there is no
precise position withinthe wordthat is the saccadic landingtarget
-anywhere withinthe
wordis sufficient forcomprehension(Morgan, etal, 1990). Fixationsare definedas the
timebetween successive saccades. Atypicalfixation duration for reading textis between
200and 300msec.
It should be noted that saccadic eye movements are one example of overt
manifestation of visual selectivity and orienting of attention - head
movements and
posturaladjustments are amongthe others. Covert orientingof attention and inneracts of
selection are not necessarily accompanied by any overt signs. It is possible, though
unusual, to attend to one area ofthe visual field while fixatinganother (Corbetta, 1998;
KustovandRobinson, 1996).
Recent studies have suggested that the classification of eye movements into sub
categories such as smooth-pursuit, vergence, and VOR ignores the behavioral
significance ofeyemovements,and reflects thesimpletasksofthe earlystudies thatwere
performed in a constrained and sparse visual environment (Steinman, Kowler, and
Collewijn, 1990). The claim is that the experimental results of such early studies reflect
low-level and involuntary aspects of oculomotor control that do not surface in a
te