MINISTRY OF EDUCATION, SCIENCE AND SPORTS
TRAINING AND WORKING MANUAL
ADEOP 2007-2009 NEW FORMAT
FOR DISTRICT AND REGIONAL EDUCATION PERSONNEL
DEVELOPED BY
POLICY PLANNING UNIT, PBME DIVISION
TABLE OF CONTENTS
PAGES
LIST OF ACRONMYS 4
LIST OF TABLES AND FIGURES 4
PREFACE 5
MODULE 1: PLANNING AND THE EDUCATION STRATEGIC PLAN 7
1.1 Educational Planning 7
1.2 The Education Strategic Plan 2003 – 2015 8 1.2.1 The Education Sector Mission Statement 9 1.2.2 The ESP and Strategic Policy Objectives 9 1.3 Group Work (Module 1.1) – District Mission Statements 12
MODULE 2: DISCUSSION OF ADEOPs PREVIOUSLY SUBMITTED 13
2.1 Status of Submission 13
2.2 Appraisal of District Plans 13
2.3 Outcomes, Outputs, Strategies, Activities, Responsible
Units and Collaborators 13
2.4 Proper Linkage Between DESP and ADEOP 13
2.5 General Comments 14
2.6 Suggestions 14
MODULE 3: THE NEW ADEOP FORMAT AND PROCESS 15
3.1 What is the Importance of the ADEOP? 15
3.2 Who are the Key Players in the ADEOP Process? 15 3.3 What are the Competencies to be Achieved by Participants? 16
3.4 The ADEOP Rationale and Process 16
3.5 Format for Sub-Sector Work Plans 17
3.6 Prioritisation 17
3.7 Linking to Other Processes 18
MODULE 4: INDICATORS 19
4.1 What are Educational Indicators? 19
4.2 Why are Educational Indicators important? 19 4.3 Why should we use educational indicators? 20 4.4 How can the tracking of Educational Indicators improve
the quality of education 20
4.5 Key Questions 20
4.5.1 How to track Educational Indicators 20
4.5.2 How to Set Targets 20
4.6 How to get Baseline Data 21
4.6.1 Before Implementation has Begun 21 4.6.2 If Implementation has Already Begun 21
4.6.3 Quantitative Data 22
4.6.4 Qualitative Data 22
4.6.5 Tips for Quantitative and Qualitative Data 23
4.7 Summary Notes 23
Inputting Targets 23
MODULE 5: TARGET SETTING 24
5.1 What are Targets 24
5.2 Setting Targets 24
5.3 Group Work (Module 5.1) – Setting Targets in the ADEOP 25
MODULE 6: PROBLEM ANALYSIS IN EDUCATION 26
6.1 What is Problem Analysis? 26
6.2 Why Undertake Problem Analysis? 26
6.3 Advantages of Problem Analysis 26
6.4 The Problem Tree 26
6.4.1 Some Tips for Constructing a Problem Tree 27 6.4.2 Suggested Questions for Focus Group Discussion 28 6.5 Group Work (Module 6.1) – Creating a Problem Tree 28
MODULE 7: COSTING 29
7.1 Costing 29
7.2 How to Undertake Costing 29
7.3 Group Work (Module 7.1) – Costing the ADEOP 30
MODULE 8: ANNUAL DISTRICT PERFORMANCE REPORT ANALYSIS 31
MODULE 9: ACTION PLANS 34
9.1 Rationale 34
9.2 Key Stakeholders 34
9.3 Creating the ADEAP 35
MODULE 10: EXAMPLE OF AN ADEOP 36
APPENDIX I: EXAMPLE OF NEW ADEOP FORMAT 37
APPENDIX II: GROUP WORK – MODULE 1.1 – WRITING DISTRICT
MISSION STATEMENTS 42
APPENDIX III: PROGRESS REPORT ON DISTRICT LEVEL PLANNING 45
APPENDIX IV: MODULE 5 – TARGETS – EXAMPLE: GPI 49
APPENDIX V: GROUP WORK – MODULE 7.1 – COSTING 50
APPENDIX VI: ADEAP FORMAT 57
APPENDIX VII: FORMULAE FOR KEY INDICATORS 59
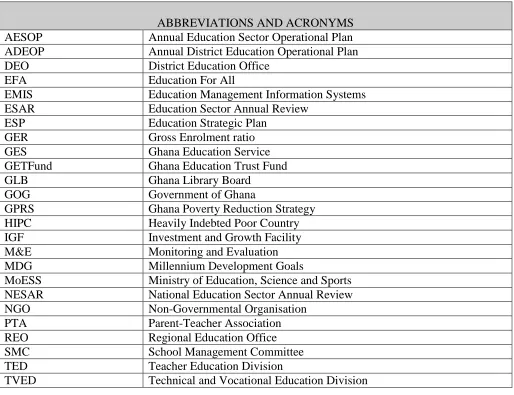
LIST OF ACRONYMS
ABBREVIATIONS AND ACRONYMS AESOP Annual Education Sector Operational Plan ADEOP Annual District Education Operational Plan
DEO District Education Office
EFA Education For All
EMIS Education Management Information Systems
ESAR Education Sector Annual Review
ESP Education Strategic Plan
GER Gross Enrolment ratio
GES Ghana Education Service
GETFund Ghana Education Trust Fund
GLB Ghana Library Board
GOG Government of Ghana
GPRS Ghana Poverty Reduction Strategy
HIPC Heavily Indebted Poor Country
IGF Investment and Growth Facility
M&E Monitoring and Evaluation
MDG Millennium Development Goals
MoESS Ministry of Education, Science and Sports NESAR National Education Sector Annual Review
NGO Non-Governmental Organisation
PTA Parent-Teacher Association
REO Regional Education Office
SMC School Management Committee
TED Teacher Education Division
TVED Technical and Vocational Education Division
LIST OF TABLES
PAGE
[image:4.612.46.560.98.493.2]PREFACE
The Ministry of Education, Science and Sports (MoESS) is under increasing pressure to use a results-oriented approach to reach targets that will improve the quality of the delivery of education, especially in the Public Basic Schools in the country. Imperative to reaching this goal is a clear and consistent set of policies and goals that the entire Education Sector understands and can work towards.
The Annual Education Sector Operational Plan (AESOP) is a three-year rolling plan and is the primary annual policy document that the Ministry produces that guides the sector for the upcoming year. Each division and agency contributes to this document, and each District in the country develops an Annual District Education Operational Plan (ADEOP). The documents are very much related and should inform one another. As such, it is essential that these documents be consistent across all parties involved in the Education Sector so that all are aware both of what other divisions and agencies and districts are doing, and so that all activities are linked to the documents that guide the education sector such as the Education Strategic Plan (ESP) 2003-2015, the White Paper, and others.
In the past, the AESOP and ADEOPs have been activity-based. This presented a number of problems in tracking progress towards goals. As such, the format of the AESOP and ADEOPs for 2007-2009 has been amended so that it is instead, results-based. Specifically, rather than the plans being organized by activity, they will now be organized by the four Focus Areas and Ten Policy Goals outlined in the ESP. Activities will be listed according to the goals they are meant to achieve. This will ensure that progress can be better tracked and measured, and will also assist in setting targets for future years. The new Operational Matrix shows at a glance:
• The ESP targets for 2015 (and 2012 as in white paper) under each of the focal areas;
• The baseline indicators (where we are);
• The indicative targets for the following year;
• The output /activities necessary for achieving the stated targets;
• Budget allocation;
• Responsible agency;
• Means of verification.
This training manual is intended to describe and explain the new format so that all parties that will use it are able to use it most effectively.
capacity of the district education officials. This workshop is one of the important steps in this process.
MODULE 1: PLANNING AND THE EDUCATION STRATEGIC PLAN
1.1. Planning
The definition of planning includes the following aspects:
• Planning is part and parcel of developmental process of any organisation or individual;
• Planning is the process of identifying the means, resources and actions necessary to accomplish an objective;
• Planning is a continuous process, concerned with where to go, how to get there and by what best route.
Planning deals with the future, having regard to past trends. This involves choices and decision-making. The process of planning involves the following:
• Goals – overall aims of the organization/sector. • Ex: Equitable access to education
• Objectives – measurable targets that quantify the objectives and define things to work towards.
• Ex: GER of 100%
• Policies – broad measures that will aid in the realization of the goals. • Ex: Reducing the costs of education
• Strategies – more narrow measures that work together to form the strategy. A strategy could be a set of policies.
• Ex: Making education free (capitation grants), making basic education compulsory
• Inputs – things that are required to undertake activities to reach the goals • Ex: money for capitation grants, people to administer them
• Activities – specific measures that are meant to implement the policy. Many activities could comprise one policy. Transform inputs into outputs.
• Ex: Planning and administration activities of the capitation grants, scholarship programs, etc.
• Outputs – measurable results that demonstrate whether the goals have been achieved. These can be controlled.
• Outcomes – meeting the overall aims, demonstrate whether the objectives have been achieved. These cannot be controlled directly by the organization.
• Ex: Increase in the GER.
National Goal
Achievement of sustainable and equitable economic growth accelerated poverty reduction and protection of the vulnerable and the excluded within a decentralised environment.
Sectoral Goal
Ensure holistic development of all individuals through quality education and sports.
Educational Planning is the application of rational and systematic analysis to the process of educational development with the aim of making education more effective and efficient to satisfy the aspirations of the nation/society and all stakeholders including pupils/students and parents (Coombs, 1970).
Educational Planning has many advantages, it:
Identifies problems;
Promotes target setting and policy making;
Strengthens efficient management and deployment of resources;
Prioritise objectives, policies, outputs, and activities;
Facilitates budgeting process;
Promotes transparency and accountability;
Facilitates monitoring and evaluation of programmes.
As such, it is a very important tool, and it is essential that all parties involved in the Education Sector partake in the planning process so that a holistic and consistent approach can be followed.
1.2. The Education Strategic Plan 2003-2015
The Education Strategic Plan (ESP) 2003-2015 guides education sector development. As a long-term plan it is concurrent with and in support of the Ghana Poverty Reduction Strategy. The ESP serves as the framework by which Ghana meets its commitment to achieve the Millennium Development Goals (MDGs) and other international development goals on education. It is a sector-wide approach (SWAP) to education sector development, with a focus on primary education and the Education For All (EFA) tenets.
For instance, the Gross Admission Rate for entry into Primary One, which originally in the ESP was to reach 100% by 2010, is now to be achieved in the 2006/2007 academic year. Similarly, the Primary 6 Completion rate, which was to reach a level of 100% by 2015, is now to be achieved by 2012. Gross Enrolment for Primary education is now scheduled to reach 107.4% by 2012, in order to achieve Universal Basic Completion by the end of 2015.
1.2.1. The Education Sector Mission Statement
The ESP also sets out a mission for the Education Sector. A mission statement describes what the overall aims are and briefly outlines the strategies that will be used to attain them.
1.2.2. The Education Strategic Plan and Strategic Policy Objectives
The strategic framework of the ESP is based around four focus areas and ten policy goals.
The four areas of focus are:
1. Equitable Access to Education (EA) 2. Quality of Education (QE)
3. Educational Management (EM) 4. Science, Technology and TVET (ST)
These areas of focus are related to the policy goals that were identified for the purposes of the Medium Term Expenditure Framework (MTEF) preparation, and are consistent with the findings of a number of significant reports and papers that were published during 2002 including:
1. Ghana Poverty Reduction Strategy 2002 – 2004 (GPRS, February 2002);
2. Education Sector Policy Review Report (ESPRR, August 2002);
3. Education Sector Review (ESR, October 2002);
4. Meeting the Challenges of Education in the 21st Century. (The report of the President’s Commission on Review of Education Reforms in Ghana, ERRC, October 2002);
5. Education for All (EFA, UNESCO, Dakar, 2000). BOX 1
Mission Statement for Education
The mission of the Ministry of Education is to provide relevant education to all Ghanaians at all levels to enable them to acquire skills that will assist them to develop their potential, to be productive, to facilitate poverty reduction
The 10 policy goals of the ESP are as follows:
1. Increase access to and participation in education and training;
2. Improve quality of teaching and learning for enhanced pupil/student achievement; 3. Extend and improve technical and vocational education and training;
4. Promote good health and environmental sanitation in schools and institutions of higher learning;
5. Strengthen and improve educational planning and management;
6. Promote and extend the provision of science & technology education and training; 7. Improve the quality of academic and research programmes;
8. Promote and extend pre-school education;
9. Identify and promote education programmes that will assist in the prevention and management of HIV/AIDS;
10. Provide girls with equal opportunities to access the full cycle of education.
The Growth and Poverty Reduction Strategy (GPRS) II represents an update of Ghana’s Poverty Reduction Agenda, with a new emphasis on growth and wealth creation as a means of reducing poverty over the period 2006-2008.
The following are the prioritised policy objectives for the education sector under the GPRS II:
• Increase access to and participation in education and training;
• Bridge gender gap in access to education;
• Improve quality of teaching and learning;
• Improve quality and efficiency in delivery of education service;
• Promote and extend the provision of science, maths, technology and ICT education and training;
• Mainstream issues of population, gender, health, HIV/AIDS/STI, fire safety, road safety and environment in the curricula of schools and institutions of higher learning.
These policy objectives are carefully selected to inform the thematic areas of the Education Strategic Plan, namely – Access and Participation, Quality, Education Management and Science and Technology & TVET. Under the GPRS II, the sector has four strategic policy objectives and five key policies.
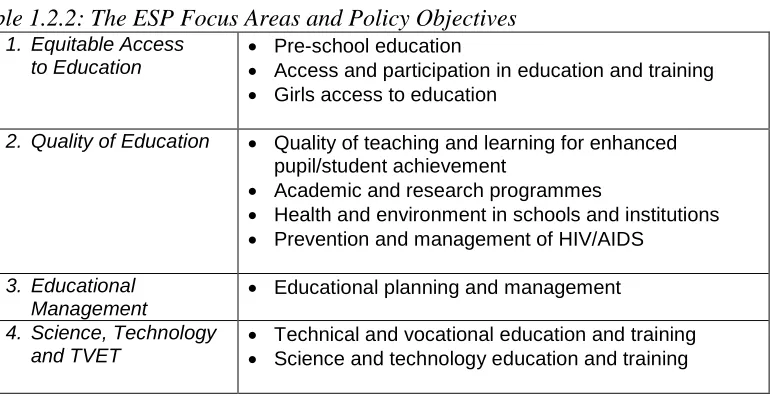
Table 1.2.2: The ESP Focus Areas and Policy Objectives
1. Equitable Access to Education
• Pre-school education
• Access and participation in education and training
• Girls access to education
2. Quality of Education • Quality of teaching and learning for enhanced pupil/student achievement
• Academic and research programmes
• Health and environment in schools and institutions
• Prevention and management of HIV/AIDS
3. Educational Management
• Educational planning and management
4. Science, Technology and TVET
• Technical and vocational education and training
• Science and technology education and training
White Paper Reforms
The White Paper Reforms outline a portfolio of reforms and objectives spanning the entire education sector, which, according to the recommendations, are to be implemented from 2007 at the latest, and have major targets identified for 2015 and 2020.
The key objectives of the White Paper reform are twofold. First and foremost to build upon the ESP commitments and ensure that all children are provided with the foundation of high quality free basic education. Secondly, to ensure that second cycle education is more inclusive and appropriate to the needs of our young people in order that they develop both demand-driven and market-responsive skills, which are more able to meet the needs of a growing and diversifying Ghanaian economy.
Basic education will be expanded to include 2 years of Kindergarten as well as the existing 6 years of primary and 3 years of Junior High Schools. The entire basic cycle will be free and compulsory and will receive the highest priority of all the sub-sectors. Overall funding for this sector will be supported in full by the government. The overarching target is 100% completion rates for male and female students at all basic levels by 2015. Moreover, in order to significantly improve quality and relevance, the basic school syllabus will be streamlined to focus on the core areas of literacy, numeracy and life skills, with ICT courses being introduced in all 6,300 public junior high schools.
There will be a radical reform of second cycle education, which, with effect from 2007, will last for 4 years, and will serve as a terminal point of entry into work or tertiary education and will be universal by 2020. The major initiatives and sector policies proposed in the reforms include:
• Senior high school, which will consist of general, vocational, technical and agricultural education, with an emphasis on technical, agricultural and vocational education as a credible alternative to the general grammar education.
1.3. Group Work (Module 1.1) – District Mission Statements
MODULE 2: DISCUSSION OF ADEOPS PREVIOUSLY SUBMITTED
2.1. Status of Submission
In 2005, UNICEF held training sessions for all Districts in order to formulate the DESPs, the ADEOPs and the ADEAPs (Annual District Education Action Plans). In sum:
119 districts benefited from training on District Education Planning;
So far, 92 districts have submitted their plans to the PBME Division of the MoESS;
It means 27 districts have defaulted.
2.2. Appraisal of District Plans
The formats recommended at the training were correctly followed by the majority of the districts. Almost all the districts were able to correctly classify their district problems under their thematic areas, policy goals and related policy objectives. Only a few districts were able to write appropriate introductions to their plans and made statements of the mission of their District Directorates of Education. Few districts with introductory passages to their plans were able to bring out the collaboration among the stakeholders in preparing the district plans. Some districts were superfluous in their introductory passage by reproducing a lot of what was included in their school mapping reports. Few districts confused their district plans with their Annual District Performance Reports.
2.3. Outcomes, Outputs, Strategies, Activities, Responsible Units and Collaborators
There was a fairly good attempt at stating the expected outcomes correctly, but in a number of cases, they were stated as outputs and vice versa. The same applied to the statement of strategies. They were correctly stated for some problems but not differentiated between for other problems. In a number of cases, activities were not stated using active verbs. The responsible units in the majority of cases were correctly identified. In some cases however, there was multiple responsibility which could result in no definite unit being held accountable. Collaborating units, agencies and organizations were correctly identified in most cases.
2.4. Proper Linkage between DESP and ADEOP
Some districts presented their district plans in one volume comprising the District Education Strategic Plan (DESP), the Annual District Education Operational Plan (ADEOP) and the Annual District Education Action Plan (ADEAP);
Other districts presented the plans in three volumes; the DESP, the ADEOP and the ADEAP, each in a separate volume.
Of the districts that presented the plans in one volume, there were various sequencing approaches. After picking one district problem, some districts prepared the strategic, operational and action plans for addressing that specific problem before picking another problem and doing same. Others prepared the strategic plan for all the problems identified, followed by the annual operational plans before the action plans. Apart from (3) above there is the need to repeat the district problem being addressed by the operational and action plans so as not to lose the linkage between the strategic plan on the one hand and the operational and action plans on the other hand.
2.5. General comments
Some of the plans were very scanty. The districts could not identify enough problems to address. Some districts seemed to have ‘carved’ their district problems out of the given related policy objectives, creating hypothetical problems instead of what might actually be happening in the district. Few districts did not follow strictly the formats given to them.
2.6. Suggestions
In the ADEOP and ADEAP, it would have been more appropriate to repeat the district problems instead of the policy goals. That would make linkage of the activities with strategies in the DESP easier without having to flip back the pages to link to what was stated in the DESP. The DESP, ADEOP and ADEAP should be conveniently put into separate volumes. There is the need to take the districts through problem analysis.
MODULE 3: THE NEW ADEOP FORMAT AND PROCESS
The Annual District Education Operational Plan (ADEOP) places the strategies and activities identified in the DESP within a three-year rolling work-plan for implementation. The ADEOP:
Combines all the initiatives of all stakeholders in a District and organizes them so that a unified direction can be established;
Influences decisions on resource allocation using information on the actual situation at local levels;
Provides justification for spreading or replicating successful programmes or activities;
Is part of the decentralization process to give Districts ownership of their development.
3.1. What is the Importance of the ADEOP?
The ADEOP is the primary annual policy planning tool regarding education at the District level. It guides the development of the Education Sector in achieving the goals set out in the DESP and the National ESP, as well as other initiatives such as Education For All (EFA). It lists the activities and strategies by which the targets will be reached, i.e. how what we want to achieve will be operationalized. It is specifically geared towards the pre-tertiary portion of the education sector, since this is what the Districts have a mandate over.
3.2. Who are the Key Players in the ADEOP Process?
There are several stakeholders in the ADEOP process and each one contributes an essential part. Each has distinct responsibilities, but all also require coordination and consistency in order that the planning process be as coherent and efficient as possible.
Planning Unit, PBME – uses ADEOPs to strengthen the decentralization process and monitor Districts’ progress.
Regional Education Office – plays a coordination and supervision role between all the Districts and the HQ.
District Education Office – prepares the ADEOP in order to plan for implementation of the DESP.
District Assembly – oversight responsibility at the District level.
Schools (esp. Head Teachers) – should be aware of the ADEOP and work towards it.
3.3. What are the Competencies to be Achieved by Participants?
• Understand the process and implementation of the new ADEOP format;
• Follow the new format in the future and tie it to other processes;
• Teach all staff at divisions and agencies and at the Regional and District levels that use the ADEOP or contribute a list of activities to it how to use the new format;
• Work with other REO /DEO staff to identify questions, issues and problems peculiar to the district and local levels;
• Meet with local level representatives (head teachers, teachers, SMC/PTA executives etc) to elicit input on questions, issues, problems and challenges at the school level;
• Use the new format as a basis for preparation of plans and for resource management.
3.4. The ADEOP Rationale and Process
In previous years, the ADEOP has been very much activity-based. This was meant to enhance the monitoring and evaluation process by displaying progress on each activity, and also to ensure that the ADEOP was a true reflection of the planned work programme.
However, it was recognized that this process resulted in an extremely long and complex matrix that made it difficult to see overall progress towards the DESP and National ESP goals. Consequently, it was decided that the ADEOP and AESOP 2007-2009 would adopt a different format and be results-based instead of activity-based. The approach taken will be as follows: the ADEOP will now state what the National and District ESP goals are, the progress achieved in the District so far, what the National targets are for this year, what the District targets are for the next three years, how the targets will be achieved, and which agency/division is responsible for achieving them. Furthermore, the budget, means of verification, and priority level will be indicated. In this way, progress can be better tracked on an annual basis, and it is a much clearer means of verification towards specific targets. Instead of listing each activity undertaken, the ADEOP will directly measure progress towards measurable goals.
This will result in the final version of the AESOP in September, in time for the budget process in October.
3.5. Format for Sub-Sector Work-Plans
As mentioned previously, this year, the ADEOP 2007-2009 will be organized according to ESP targets instead and will be grouped according to the four thematic areas and ten policy goals.
Under the new structure, the table is organized as follows. The first row will contain the
‘Focus Area’, or main thematic groups from the ESP. The second row will state the
‘Policy Objective’, grouped under the four focus areas as listed above on Page 9. Column one, ‘National Indicative Targets 2015’, contains the targets listed in the ESP to be achieved by 2015 (unless another date is specified). This column specifies a numerical indicator so that it is measurable. For example, the target value of the GER or GPI, or number of classrooms built, number of teachers trained, etc. Column two,
‘District Indicative Targets 2015’ contains the DESP targets for that particular district. They are also numerical. Column three, ‘District Base-line Indicators 2005-2006’, contains the achievements made in the district towards the DESP goals. It will be the current value of the indicator. For example, the current value of the GER or GPI, or number of classrooms built, number of teachers trained, etc. Column four, ‘National Indicative Targets 2007’ contains the national targets that have been set for the indicator for the upcoming year. Column five, ‘District Indicative Targets’, which is split into three (2007, 2008 and 2009) lists the goals to be achieved in the respective year. Column six, ‘District Activities/Output 2007 - 2009’, lists the activities that will be undertaken in order to achieve the goals listed in the previous columns. Column seven, ‘District Budget 2007’, indicates the costing for each activity. This will be the opportunity to link the goals and activities very clearly to the budget. This will be an estimate of the cost of the activity/activities and should also indicate the source of funding. Column eight,
‘Responsible Unit’ lists those bodies responsible for carrying out the activities and achieving the targets. These responsibilities form the basis for defining lines of accountability. It should be noted that at this level of action-planning these are broad responsibilities. Specific responsibilities for activities will be assigned by the designated line managers to appropriate officers within the ministry, its agencies, the regions and the districts. Column nine, ‘Monitoring and Evaluation’, lists the document that will measure progress towards the targets, both for that year and for the overall 2015 goal. This will avoid the repetition of activities that caused previous AESOPs to become so lengthy. Finally, Column ten will indicate the priority level of each activity. Please see Appendix I for a printed example of the new format.
3.6 Prioritisation
activities are undertaken and implemented successfully. The District will judge which activities are most important to them. For example, if a particular district has plenty of textbooks, but the GPI is very low, it might decide to give higher priority to girls’ enrolment than aquiring textbooks. This recognizes the fact that Districts have their own particular circumstances and that they should be able to plan for them. However, the priorities must also be cognizant of the national priorities of the education sector and of the Government.
In accordance with the pro-poor aims of the Ghana Poverty Reduction Strategy (GPRS) and the ESP 2003-20015 the highest priority has been awarded to primary education, and particularly those strategies that will assist the achievement of the MDG of Universal Primary Completion. All other EFA activities also receive high priority – but only after primary education activities have implemented. This will inevitably mean that at all levels, especially within the 'non-EFA' sections, some development activities may be incomplete at the end of a year. In such cases, these will be rolled forward into subsequent years, with some targets receding in time.
The suggested prioritization method is as follows: - Urgent
- High - Medium - Low
3.7. Linking to Other Processes
It is hoped that the new ADEOP and AESOP format will help not only to make the planning process more efficient, but all Ministry processes. The AESOP format can be used as a basis for linking planning more coherently to the budgeting and the M&E processes. If they were to adopt a similar format, or one that easily conforms to one another, then the Ministry can plan, budget, and track the progress of activities and goals in a much more efficient manner. All documents will keep in mind the information needs of other documents and divisions and this streamlining will result in much less grappling for information, as everyone will know what is needed and will be able to use the same information.
All Districts will be given a hard copy and an electronic copy for the ADEOP 2007-2009 with all the goals listed so that it can easily be filled out. In this way, all Districts will have the same format, and the format will be the same as the national AESOP so that they can be easily followed and compared.
MODULE 4: INDICATORS
4.1. What are Educational Indicators?
The new results-based ADEOP format is centered around indicators. The target indicators describe the ultimate goals and the goals for the upcoming years, and the baseline indicators describe the current situation and progress made thus far. Since all activities will, from now on, be aligned to indicators, understanding indicators is very important.
An educational indicator is a quantitative or qualitative measure used to track progress toward a strategic objective. The indicators tell us specifically what to measure to determine whether an objective has been achieved. The tracking of indicators is a vital management tool for making performance-based decisions about strategies and activities to improve teaching and learning.
Indicators are often referred to as being of four types: input, process, output, or outcome.
Input indicators measure what is being added or provided (training, materials, funds) at the activity level. Process indicators measure behavior change, which is hypothesized from the inputs (e.g., teachers incorporating new teaching methods). Output indicators measure direct results of the behavior changes (e.g., students reading levels). Outcome
indicators measure indirect results of the behavior change or collective results of a variety of behavior changes (e.g. improved student performance on standardized tests).
4.2. Why are educational indicators important?
Educational indicators:
• Measure the progress of an educational activity against stated targets;
• Serve as a vital management tool for making performance-based decisions about strategies and activities to improve teaching and learning;
• Are used to measure behavior change, which is hypothesized from education inputs (e.g., training).
4.3. Why should we use educational indicators?
Tracking educational indicators can be very useful for the ADEOP. The outcome and output indicators show us where we are and where we want to go, as well as what we must do next. The input and process indicators can measure progress in between, and are the intermediate measures of progress towards the ultimate targets. Since many activities carried out by different agencies and divisions contribute to the same outcome indicators, it is important that all parties be aware of progress so far and of what others are doing to contribute to various targets so that all activities can be consistent.
The baseline indicators in the ADEOP describe what has already been achieved. They must be measurable (and preferably numeric). This means they are quantitative. They should also be aligned to the national and district target indicators.
The ADEOP shows both the National targets and the District targets. The District targets are those derived from the DESP. They should also be aligned to a Focus Area and Policy Objective and be measurable (preferably numerical).
4.4. How can the tracking of educational indicators improve the quality of education?
Keep district officers informed of progress towards stated targets and objectives.
Provide incentive for stakeholders to maintain good performance or improve bad performance.
Encourage reform of educational programmes where necessary.
4.5. Key Questions:
4.5.1 How to track educational indicators?
Set target indicators to track progress of our educational activities.
Train circuit supervisors to use indicators to track progress of our educational activities.
Collect data and analyze.
4.5.2 How to set Targets?
An important part of the ADEOP is the three columns that delineate the targets for the next three years. The Districts are responsible for setting targets for themselves. Ideally, targets should be set after a baseline measure has been collected or approximated/estimated. The target should be set based on the following factors:
The baseline value;
The time period available to reach the target.
Target values are very important because if they are properly set they can motivate people to succeed in their goals. Targets also provide a means for assessing whether or not the activities that are being undertaken are sufficient to produce the desired changes.
4.6. How to get baseline data?
As stated above, a baseline measure is needed if an indicator is going to be used to legitimately track progress. However, due to bad timing or a lack of resources in some cases, a true baseline data collection activity can not always be carried out. The following are some suggestions on how to obtain baseline figures in different situations.
4.6.1. Before Implementation has Begun
Do the actual data collection, the exact way that it will be done for all subsequent data collection activities. This is the only way to obtain a true baseline figure and the preferable method. If finances or timing is going to be a problem, consider using
sample instead of collecting data for the entire population.
Compute the indicator from existing data that has been collected for some other reason. For example, if the indicator relates to percentage of trained teachers, the most recent school census data could be used to compute the baseline value. The data must be reasonably close to the data that will be collected later in order to be a valid estimate of the baseline. If this option is going to be used, it makes sense to consider using the previous data collection strategy for all future data collection, assuming that the data can adequately measure the indicator.
Use a proxy measure to represent the baseline, meaning another measure that is similar enough to the indicator to provide a reasonable estimate. For example, if the indicator relates to pupils ability to solve simple math problems, some items from the last School Education Assessment or Continuous Assessment might be analyzed to get a proxy measure of the indicator. In reporting the results, it is important to be clear that the baseline is a proxy and to make the appropriate interpretations.
4.6.2. If Implementation Has Already Begun
If activities intended to influence the value of the indicator have already begun, it is not possible to undertake a true baseline data collection activity. In this case, the following options are available.
used, the control sample can continue to be tracked along with the target population to give a better understanding of whether changes in the indicator are a result of the activities or of some other factor (See Topic on Selection of a sample: Module 8, Page 58)
Compute the indicator from existing data that has been collected for some other reason. For example, if the indicator relates to percentage of trained teachers, the most recent school census data could be used to compute the baseline value. The data must be reasonably close to the data that will be collected later in order to be a valid estimate of the baseline. If this option is going to be used, it makes sense to consider using the previous data collection strategy for all future data collection, assuming that the data can adequately measure the indicator.
4.6.3. Quantitative Data
Findings from quantitative data tend to have numerical values. Data collection instruments can be based on any of the following approaches:
• Sample surveys which can be based on interviews, using a standard questionnaire. All respondents are asked the same set of questions;
• Direct observation using service statistics and other programme documents;
• Self-administered questionnaire-Not ideal for a less educated population and tends to have a low response rate;
• Secondary data sources (official records, census, official statistics, etc).
4.6.4. Qualitative Data
Thus qualitative data can be collected using the following key approaches:
• In depth Interviews-Usually there is a guide or a set of questions to facilitate collection of information from respondents. The guide helps to standardize the questions being asked so that there is uniformity in analyzing the responses;
• Focus Group Discussions-Respondents are brought together for open discussions on a set of issues prepared in advance. There is a facilitator who helps to guide the discussions as well as a rapporteur who takes notes. It is recommended that focus group discussions involve 8-10 participants, however, at the outer limits there should be no less than 5 and no more than 12;
• Direct Observation-This is often used to assess service delivery points to determine quality of service provision. It requires highly skilled observers and analysts such as ethnographers;
• Content Analysis of written materials-this is useful for analyzing training materials.
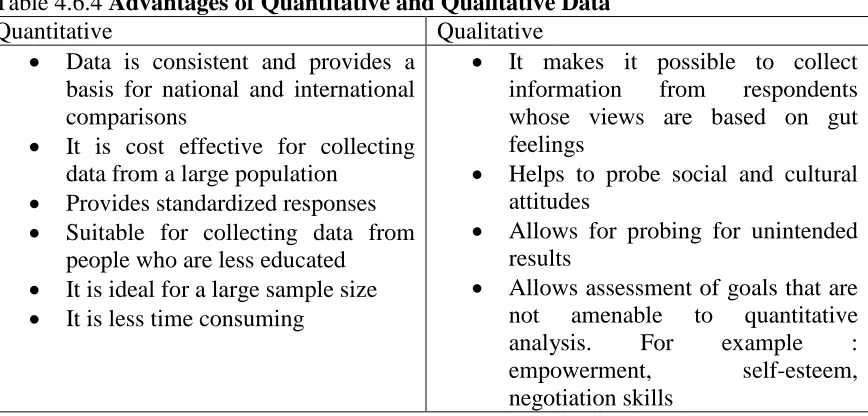
Table 4.6.4 Advantages of Quantitative and Qualitative Data
Quantitative Qualitative
• Data is consistent and provides a basis for national and international comparisons
• It is cost effective for collecting data from a large population
• Provides standardized responses
• Suitable for collecting data from people who are less educated
• It is ideal for a large sample size
• It is less time consuming
• It makes it possible to collect information from respondents whose views are based on gut feelings
• Helps to probe social and cultural attitudes
• Allows for probing for unintended results
• Allows assessment of goals that are not amenable to quantitative analysis. For example : empowerment, self-esteem, negotiation skills
4.6.5. Tips for Quantitative and Qualitative Data
To ensure high quality of data, prepare written guidelines for data collection. The guideline will ensure some degree of standardization in the data collection process. Also pilot-testing should not be done in an area where the questionnaire will be administered.
4.7. Summary Notes:
Indicators are not necessarily an exact measure of the objective, but rather are intended to give a reasonable idea about whether or not the objective is being achieved. Often it is necessary to have more than one indicator to sufficiently measure against an objective. Generally, in deciding on indicators, you must ask the question ‘What do we need to know to decide if the objective has been met?’
4.8. Group Work (Module 4.1) – Obtaining a Baseline and Setting Targets
Using your DESP:
Fill in the District Target Indicators 2015 column.
Using the data for your district for 2005-2006:
Fill in some Baseline Indicators for your district into the blank format.
MODULE 5: TARGET SETTING
5.1. What are Targets?
Targets are an essential part of the planning process. Targets:
Define our ultimate goals and define where we want to go and what we want to achieve;
Are generally numeric so that they can be measured and tracked;
Allow us to measure progress made and determine what should be done to achieve our ultimate goals.
That is why we set targets in the ADEOP. There are five columns in the ADEOP pertaining to targets:
• National Indicative Targets 2015 – this column outlines the targets that have been set at the national level for 2015. These include targets from the ESP, the White Paper, Education For All (EFA) and others. They have been organized according to the four Focus Groups and ten Policy Goals.
• District Indicative Targets 2015 – this column outlines the targets that have been set by the District for 2015 in the District Education Strategic Plan (DESP). These are personalized goals for the specific District and should be aligned with the national goals, but can be different according to the special circumstances of the District.
• District Targets 2007, 2008, 2009 – these three columns set out targets for the District over the next three years that will enable the District to achieve its 2015 targets. They show what progress should be in order to reach the ultimate goals.
All of the targets in the ADEOP are aligned under the focus areas and policy goals. They should all follow from one another. For example, if there is a national target for the GER, the next column should have the District target for the GER for 2015, and the same row should have all the targets for the GER for the next three years.
5.2. Setting Targets
Setting targets can be done in different ways. For the District Targets for 2015 that have been established in the DESPs, the targets may have been set using the national ones, or they may take into account the specific circumstances of that particular District.
The ultimate goal;
What has already been achieved;
How much time is left to achieve the goal.
Then, one must take the ultimate goal and subtract what has already been achieved, and then divide that amount by the time that is left to achieve the goal.
A reasonable target is one that is realistic. Furthermore, a target can be changed and should be updated as progress is made. For example, if a target is surpassed, then the target for the following years should be adjusted. Finally, targets should be easily measurable, otherwise, they will not serve their purpose of allowing us to track progress and may be a cause for misunderstanding or miscalculation.
Please see Appendix III for an example of how to calculate targets for the GPI.
5.3. Group Work (Module 5.1) – Setting Targets in the ADEOP
MODULE 6: PROBLEM ANALYSIS IN EDUCATION
6.1. What is Problem Analysis?
It is a technique used to identify and structure the hierarchy of problems that affect a system – the educational system. It is also called Situational Analysis when all the identified problems affecting education in a district (community, country) are analysed. It is the analysis of existing conditions to clarify what are the problems of education in the district and what causes the problems, based on the results of school mapping.
6.2. Why Undertake Problem Analysis?
In order to find appropriate solutions to problems and not to tackle only the effects of problems.
In order to find an appropriate solution to a problem, a thorough diagnosis of the problem must be carried out.
6.3. Advantages of Problem Analysis
The problem can be broken down into manageable and definable chunks. It enables a clearer prioritisation of factors and helps focus objectives.
There is more understanding of the problem and its often interconnected and even contradictory causes. This is often the first step in finding a win-win solution.
It defines the constituent issues and arguments, and can help establish who and what the political actors and processes are at each stage.
It can help establish whether further information, evidence or resources are needed to make a strong case or build a convincing solution.
Present issues - rather than apparent, future or past issues are identified and dealt with.
The process of analysis often helps build a shared sense of understanding, purpose and action.
6.4. The Problem Tree
6.4.1. Some Tips for Constructing a Problem Tree
Form a focus group by bringing together the major stakeholders.
List on paper or flipchart all problems that come to mind. Problems need to be carefully identified. They should be existing problems, not possible, hypothetical, imagined or future ones. Describe only one problem in a sentence.
Identify a core problem (this may involve considerable trial and error before deciding on one). The core problem becomes the trunk of the tree.
Determine the causes of the problem. These become the roots of the tree.
Arrange in hierarchy both “Causes” and “Effects “and identify how the causes relate to each other.
Determine the effects of the core problem which become the branches of the tree.
Take time to allow people to explain their feelings and reasoning and identify how the causes relate to each other.
Example
The quality of Education is low
Management of School is poor
Quantity of usable Facility is Not enough
The heart and essence of the exercise is the discussion, debate and dialogue that is generated as factors are arranged and re- arranged, often forming sub-division of the roots and branches. Record related ideas and points that come up on flipchart/paper under titles such as solutions, concerns and decisions.
6.4.2. Suggested questions for discussion at the focus group meeting
Does this problem represent the reality?
Are the economic, political and socio-cultural dimensions to the problem considered?
Which are the most serious consequences?
Which are of most concern?
Which causes are easiest/most difficult to address?
What possible solutions or options might be there?
Where could a policy change help address a cause or consequence or create a solution?
What decisions have we made and what actions have we agreed to take?
6.5. Group Work (Module 6.1) – Creating a Problem Tree
List four core problems identified by your school mapping exercise.
Do problem analysis of two core problems and come out with their problem trees.
Suggest solutions to the two core problems analysed.
Increased drop-out and out-of-school children
Inefficient use of resources due to high school attrition rate
High rates of repetition and drop-out
Low level of learning achievement
Low school attendance and0 frequent absenteeism
Poor educational conditions
Absence of pro-poor policy High number of unqualified teachers
Effects
Core Problem
Causes of the problem
MODULE 7: COSTING
7.1. Costing
Costing is the process of determining how much an activity or event will cost. It is essential to the planning process because an important part of any plan is the budget. The costing of activities and events determines the budget for various strategies and policies. Once the performance requirement (activities) to accomplish a given solution strategy are identified and listed the planner is ready to quantify the plan or numerise the plan by making budgets -linking development plan and financial plan.
Definition of a Budget:
Once the performance requirement (activities) to accomplish a given solution strategy are identified and listed the planner is ready to quantify the plan or numerise the plan by making budgets -linking development plan and financial plan.
The MTEF approach to budgeting focuses on achieving greater results from existing levels of resources. This approach matches resources and requirements (activities) to achieve government objectives in the most efficient and effective manner.
In order to match requirements with resources in achieving goals it is necessary to develop information on the cost of achieving government objectives in a directorate thus estimating the actual costs of programme of activities to be performed to achieve a particular objectives.
In the ADEOP, costing is required for the ‘Budget 2007’ column. This column will indicate the estimated required budget for the activity or set of activities listed under a particular indicative target. The purpose of having this column is to get an indication of how much is planned to be spent on various levels of education and on various policy objectives. It is also important in linking the budgeting and planning processes. Planning is currently done after the budget has been released, and this should not be the case. Planning should inform the budget; we should be asking what we want to do and how much it will cost before proposing a budget. Furthermore, this format will promote transparency and accountability in tracking the release and use of public and donor funds.
7.2. How to Undertake Costing
In costing an activity, one must ask themselves a series of questions. Each activity is different and will require different inputs. The following questions should be asked:
1. What inputs will be required to undertake the activity? 2. How many of each item will be needed?
3. Will you need to budget for contingencies?
needed. Another useful tool is the costing format, which provides a list of all potential costs that could be incurred in an activity. It is a good idea to consult this comprehensive list to see if anything has been forgotten. Finally, taking a look at past activities that have been similar and speaking to those that have planned them is also useful. In doing this, one can determine whether things went wrong or could have been done better, and thus can plan and budget for those things. Please see Appendix V for the Costing format.
How many of each input will be required depends both on the type of activity and on the item under consideration. For example, investment activities (such as building of classrooms) will require different inputs than service activities (such as awareness campaigns about the importance of education). Similarly, items such as pens/paper will depend on the number of people that are attending the activity (for example, the number of teachers at a training session) and items such as fuel will have to be measured per gallon. Generally, one would take the item and determine the unit cost, and then multiply this unit cost by the number required, to get the total cost for that item for the activity. Then, the totals for all the items are summed to get the total cost for the activity.
In planning for contingencies, one must ask, ‘what are the potential problems that could arise?’ For example, more people could show up than were expected, or more fuel may be needed unexpectedly. A good budget also accounts for contingencies.
In the ‘Budget 2007’ column, the expected total cost for the activity or set of activities listed under the specific Indicative Target should be included. Furthermore, the source of funding should also be specified. If the funding source is a donor, the name of the donor should also be included.
Please see Appendix V for an example of a filled in Costing sheet for various activities.
7.3. Group Work (Module 7.1) – Costing the ADEOP
Cost some of the most important activities in your District using the blank format for costing
Take the blank format and fill in the Budget 2007 column
MODULE 8: ANNUAL DISTRICT PERFORMANCE REPORT ANALYSIS
The objectives of the Annual District Performance Reports were to assist in comparing district performance as against national norms and policies stipulated in the Education Strategic Plan and the Growth and Poverty Reduction Strategy.
Analysis of the districts reports took the following structures:
On Equitable Access:
Over the period Gross Enrolment Rate, (GER), Gender Parity Index (GPI) marked significant improvement. GPI in some districts in the UWR and UER for example have shown remarkable increase and in some cases the girls enrolment exceeded that of the boys. Main reason especially in 2005/6 for the increases was the introduction of the Capitation Grant.
The increase in enrolment has put serious stress on teachers, teaching and learning materials and classrooms. In 2005/6 for example it was reported that 4276 KG classrooms, 17403 primary classrooms and 4839 JSS classrooms needed major repairs. Non-formal Education and School for Life have also increased numbers in the formal schools by absorbing a good number of learners from the alternative education system.
Non-Governmental Organizations have also made significant contributions to improvement of the education system. Contributions of NGOs in some districts are identified. One of these contributions is the School for Life Programme which serves as complementary model that mainstreams out of school children into formal system after nine months education and training.
On Quality Of Education:
Indicators such as PTR, BECE Result, Pupil Textbook Ratio and Percentage of trained teachers were analyzed. PTRs in districts vary and reasons of increase or decrease PTR are identified. Textbook situation in primary schools had improved tremendously in 2005/6 through government interventions.
There has also been a mixed situation of trained teachers in the districts. On the one hand, increase in the number of trained teachers as a result of incentive packages, teacher retention drive, distance learning to untrained teachers etc. Decrease because of lack of accommodation, unwillingness of new teachers to be posted to rural areas and regional and district transfers.
On Science, Technology And TVET:
Technical/Vocational Education and Training (TVET), which has been marginalized over the years is being provided largely by the private sector. Out of 172 TVET institutes in the districts, 73% were privately owned and only 27.0% were public. Out of 21.250 student population 72.1% were males and 27.9% were females. Districts have also provided recommendations by which the sub-sector can be improved.
On Education Management:
The following areas are considered: Annual District Education Operational Plans, District levies, school Management Committees, School Improvement Plan (Capitation Grant), Monitoring visits to schools, and Capacity Building in the Districts.
The analysis revealed that 95% of the Districts have developed their operational plans. Nevertheless, the districts vary in terms of their priority activities in the plans even though prioritization fundamentally depended on policy objectives outlined in the Education Strategic Plan towards achieving Universal Primary Completion.
On the Capitation Grant, 79% of the districts felt that the ¢30,000 was woefully inadequate. According to 90% of the districts, the guidelines of the Grant are clear and understanding enough. The Capitation Grant however has brought stress on the existing facilities – classrooms, teachers, other teaching and learning materials because of the overwhelming enrolment.
Monitoring visits to schools by circuit officers were done at least once to a school in a term. Among the common issues reported were: inadequate staff in schools; inadequate classrooms; lateness and absenteeism of teachers and pupils and lack of vital records (Attendance registers, lesson notebooks, etc.).
On Capacity Building, the districts request for training in book keeping and basic accounting as well as providing computers and computer training to staff.
On District Finances:
Recommendations:
1. The capacity at the district level is still weak. There is the need to continuously train district personnel to be able to collect and analyses data and write good reports.
2. Computers with accessories should be supplied to all districts since all districts are expected to produce Annual District Performance Reports.
3. Logistics particularly fuelled motorbikes should be given to district data collectors so that they can move to the remotest schools to gather data.
MODULE 9: ACTION PLANS
9.1 Rationale
The Annual District Education Action Plan (ADEAP):
Is carved from the ADEOP
States details of inputs and activities together with budgets that are required to attain set annual targets in the current year
It gives reference to annual strategies/activities that are required to attain specifies annual targets in the three-year rolling plan
It gives attention to the time frame within which specified inputs ought to be made available as per quarterly release of funds
It enables the Directorate/implementing unit of a specified activity to keep track of when to get that activity done
Allows the Directorate to access and plan the disbursement of the quarterly release of funds
9.2 Key Stakeholders
These are units that have key responsibilities to play in the attainment of outcome/output indicators at the grass root level:
District Education Directorate;
District Assembly;
NGOs/Development Partners;
Heads of schools;
SHEP;
Community Leaders.
District Education Directorate
Spearheads the delivery of quality education in the district. It comprises the following units:
Administration & Finance
Human Resource
Planning & Statistics
Budget
Inspectorate
Girls Education Unit
District Assembly
The Assembly has an oversight responsibility over the sectors in the district. Provides the needed basic infrastructure like classroom construction, furniture, etc. for the education service.
NGOs/Development Partners
These support the delivery of education at the grass root level. They collaborate with the District Directorate in the provision of education service. Some include:
DFID
UNICEF
USAID
UNESCO
JICA
WFP
Other NGOs
9.3 Creating the ADEAP
Please see Appendix VI for a Blank Format of the ADEAP. The following is a description of each of the columns of the ADEAP:
Column 1: Priority – indicate the priority level of the activity (Urgent, High, Medium, Low). This will come from the Priority column in the ADEOP
Column 2: Activity – list all the activities that are indicated in the ADEOP
Column 3: Implementing Unit/Personnel – indicate who has responsibility for the activity. This will enable accountability.
Column 4: Inputs/Items Required – state what will be needed for the activity. Refer to the costing sheet for the activity.
Column 5: Cost – Indicate the total cost of the activity. This will come from the costing sheet for the activity.
Column 6: Funding Source – Indicate where the funds will come from to undertake the activity. If it is a donor, state whom.
MODULE 10: EXAMPLE OF AN ADEOP
Please see the Appendix IX for an example of a filled ADEOP. It is actually an AESOP but since the formatting is almost the same it can still be used. Please look for things that are wrong with the AESOP submitted. We will discuss them as a group and in this way, the same mistakes will not be made!
Good Things:
- Good baseline indicators – they match the targets - Good target setting
- Good budgeting
- Good responsible agency and good priorities
Things to be Improved:
- When there is no baseline, should indicate, ‘not yet undertaken’ or ‘no baseline’
- The numbering – should be 1. a), b) etc. rather than 1, 2, 3, within each indicative target
- Source of funding not indicated
APPENDIX II. Group Work – Module 1.1 – Writing District Mission Statements
Every organization has a mission, a purpose, a reason for being. Often the mission is why the organization was first created – to meet a need identified years ago. Sometimes, the same problem that the organization initially tried to address continues to haunt generation after generation. In that case, the organization’s purpose doesn’t change – although how it does business has probably evolved. Other times, even 10 or 20 years can change the landscape so markedly that the original mission must be updated, altered, or changed dramatically in order to address those new realities.
That your organization’s mission is current, alive, and well, however, doesn’t necessarily mean that the organization has translated that purpose into a clear, concise mission statement. A good mission statement should accurately explain why your organization exists and what it hopes to achieve in the future. It articulates the organization’s essential nature, its values and its work.
This should be accomplished in a brief paragraph that is free of jargon and ‘terms of art’. In other words, it should avoid the kind of shorthand that you may be in the habit of swapping with others who work in the field, but is unfamiliar to anyone who is outside the organization or the field in which it works.
Another important consideration is how recently your mission statement was reviewed by board or staff members. If it has been more than five years or if it is not up to par with some of the recommendations here, now is probably a good time to review and if necessary, fine-tune or even rewrite your mission statement. All too often an organization’s mission statement which has been handed down over the years, loses relevance and ceases to speak to staff, board members, or supporters.
An effective mission statement must resonate with the people working in and for the organization, as well as with the different constituencies that the organization hopes to affect. It must express the organization’s purpose in a way that inspires commitment, innovation, and courage – not an easy task!
At the very least, a mission statement should answer three key questions:
1. What are the opportunities or needs that we exist to address? (the purpose of the organization)
2. What are we doing to address those needs? (the business of the organization)
3. What principles or beliefs guide our work? (the values of the organization)
Here are three mission statements that do attempt to answer these questions. Lets see what they have in common.
1. The mission of the Big Brothers/Big Sisters of America is to make a positive difference in the lives of children and youth, primarily through a professionally-supported, one-to-one relationship with a caring adult, and to assist them in achieving their highest potential as they grow to become confident, competent and caring individuals, by providing committed volunteers, national leadership and standards of excellence.
The purpose: to make a positive difference in the lives of children and youth so that they achieve their highest potential.
The business: providing and supporting committed volunteers who have one-to-one relationships with children and youth.
The values: individuals who are confident, competent, and caring; leadership and standards of excellence.
2. The National Conference, founded in 1927 as the National Conference of Christians and Jews, is a human relations organization dedicated to fighting bias, bigotry, and racism in America. The National Conference promotes understanding and respect among all races, religions and cultures through advocacy, conflict resolution, and education.
The purpose: to fight bias, bigotry, and racism in America.
The business: advocacy, conflict resolution, and education.
The values: understanding and respect among all races, religions, and cultures.
3. Planet 3000 is committed to healing the earth. Using research into natural ecosystems, Planet 3000 develops policy recommendations and pilot projects that apply these underlying principles to human ecosystems that are in harmony with other life on the planet. By bringing the human social order into balance with ecological principles, diversity of all living things can be sustained and the evolutionary process that has guided and nurtured life on this planet for millions of years can continue unabated.
The purpose: to ‘heal’ the planet.
The business: advocacy, research and demonstration projects.
Your Mission Statement Should…
- Express your organization’s purpose in a way that inspires support and ongoing commitment;
- Motivate those who are connected to the organization; - Be articulated in a way that is convincing and easy to grasp; - Use proactive words to describe what you do;
- Be free of jargon;
- Be short enough so that anyone connected to the organization can readily repeat it. Worksheet District Name: Region Name: Purpose: ________________________________________________________________________ ________________________________________________________________________ ________________________________________________________________________ Business: ________________________________________________________________________ ________________________________________________________________________ ________________________________________________________________________ Values: -________________________________________________________________________ ________________________________________________________________________ ________________________________________________________________________
District Mission Statement:
APPENDIX III. PROGRESS REPORT ON DISTRCT LEVEL PLANNING
Introduction
As part of the implementation of the Education Strategic Plan 2003 – 2015, Regional Training Workshops on Projections and Preparation of District Education Plans were organized for officers from all districts in Ashanti, Upper West, Upper East and the Northern regions in November, 2005.
The workshops were organized in collaboration with the financial and technical support from UNICEF and JICA.
The districts were expected to submit their plans latest by 31st December, 2005.
UNICEF had earlier organized regional training for selected officers from all districts in the Brong Ahafo, Central, Eastern and Volta regions, which were also expected to submit their District Education Plans by 31st December, 2005.
Regional training on planning and actual district planning in the Greater Accra Region was scheduled for the 1st quarter of 2006 after School Mapping had been
conducted.
No date was fixed for the planning exercise for the Western Region because the status of the School Mapping reports for the districts in the region was not yet known. School Mapping was regarded as the environmental scan that brought to the fore the district problems to be addressed by the district plans.
After consultations among PBME, EMIS and UNICEF, it was decided that the Greater Accra Region did not need to conduct school mapping since the proposed time table for the Education Sector Planning and Management was quite crowded with similar activities to be undertaken by the same personnel who had to conduct school mapping. These activities included school census data collection and report writing, and preparation of annual district performance reports for the Annual Education Sector Review in June.
Support however was to be sought for districts in Greater Accra Region to develop district education plans just as the districts in other regions. This was to be done after the Education Sector Review in June.
Status of Submission and Appraisal of District Plans