promoting access to White Rose research papers
White Rose Research Online
Universities of Leeds, Sheffield and York
http://eprints.whiterose.ac.uk/
This is an author produced version of a paper published in
European Journal of
Medicinal Chemistry.
White Rose Research Online URL for this paper:
http://eprints.whiterose.ac.uk/3574/
Published paper
The EVA Spectral Descriptor
David B. Turner
*and Peter Willett
Krebs Institute for Biomolecular Research and Department of Information Studies, University of
Sheffield, Western Bank, Sheffield, S10 2TN, U.K.
Abstract − The EVA descriptor is derived from fundamental IR- and Raman range molecular
vibrational frequencies. EVA is sensitive to 3D structure but has an advantage over field-based
3D-QSAR methods inasmuch as it is invariant to both translation and rotation of the structures
concerned and thus structural superposition is not required. The latter property and the
demonstration of the effectiveness of the descriptor for QSAR means that EVA has been the
subject of a great deal of interest from the modelling community. This review describes the
derivation of the descriptor, details its main parameters and how to apply them, and provides an
overview of the validation that has been done with the descriptor. A recent enhancement to the
technique is described which involves the localised adjustment of variance in such a way that
enhanced internal and external predictivity may be obtained. Despite the statistical quality of
EVA QSAR models the main draw-back to the descriptor at present is the difficulty associated
with back-tracking from a PLS model to an EVA pharmacophore. Brief comment is made on the
use of the EVA descriptor for diversity studies and the similarity searching of chemical structure
databases.
Keywords - 3D-QSAR, alignment-free, descriptor sampling, GA, IR/Raman vibration, PLS
1. Introduction
The advent in the late 1980's of three-dimensional QSAR [1,2] based upon the comparison of
steric, electrostatic and subsequently hydrophobic [3,4] molecular “fields” addressed one of the
key deficiencies of the otherwise extremely successful classical QSAR techniques [5,6]. The
CoMFA (Comparative Molecular Field Analysis) [1] and related methods [7,8] have since proved
to be extremely popular and effective complements to classical QSAR [6]. However, one of the
main difficulties associated with (and potential benefits of) field-based techniques is that of
aligning the structures concerned [9,10] where the term alignment covers both conformation
selection and the superposition of the chosen conformers in such a way as to provide both
internally descriptive and externally predictive regression models of high quality. There has thus
been much interest in either tackling the alignment issue head-on [9, 11-15] or in seeking
alternative molecular descriptors that are both sensitive to 3D-structure but that do not require
structural superposition [11,13,14]. EVA [18-23] is one example of such a descriptor, based as it
is upon molecular vibrations the characteristics of which are, in the absence of an external
modifying influence such as a receptor, invariant to rotation and translation of the structures
concerned. However, whilst EVA removes the need for superposition the method is sensitive to
3D structure although not to such an extent as a “true” 3D method such as CoMFA. This reduced
sensitivity is a consequence of the use of a Gaussian smearing function to develop the descriptor
(as described below) and as a result EVA might be described as a “2½D” descriptor.
Nonetheless, it has been demonstrated that it is beneficial to “match” conformations across a
dataset where possible rather than using randomly or arbitrarily selected 3D structures [21].
2. Calculation of the EVA descriptor
EVA, and its associated data standardisation technique described below, was originally
developed by workers at Shell Research Limited [18, 19]. The rationale behind the use of such
information as a molecular descriptor was “that a significant amount of information pertaining to
molecular properties, in particular biological activity, might be contained within the molecular
vibration wave-function, of which the vibrational spectrum is a fingerprint” [19]. It is also the
case that there is a close, albeit complex, relationship between molecular 3D structure and the
corresponding IR spectrum, a characteristic that has made IR spectroscopy an extremely powerful
tool for determining and identifying chemical structures.
The descriptor is derived from IR- and Raman-range molecular vibrations typically obtained
through the application of a classical normal co-ordinate analysis (NCA) to an appropriately
energy minimised structure. For a compound with N atoms there are 3N−6 (or 3N−5 for a linear
structure such as acetylene) normal modes of vibration, each of which has a characteristic
frequency of vibration; the latter is more usually expressed (in cm-1) as a vibration wave number
(vwn). The EigenVAlues from the NCA correspond to the vwns. Once determined, from
whatever source, the set of vwns for a given structure is projected onto a linear bounded
frequency scale (BFS) typically covering a range from 1 to 4,000 cm-1. The use of this range
means that all fundamental vibrational normal modes are included in the analysis – should a vwn
exceed 4,000 cm-1 then either the BFS can be extended or all vwns from all molecules can be
scaled according to scale factors such as those described by Scott and Radom [24]. Next a
Gaussian kernel of fixed standard deviation (σ) is placed over each and every frequency value.
The BFS is then sampled at fixed increments of L cm-1 and the value of the resulting EVA
descriptor, EVAx, at each sample point, x, is the sum of the amplitudes of the overlaid kernels at
that point: 2 2 / 2 ) f x ( e 6 N 3 1 i 2 1
EVAx i σ
π σ − − ∑− =
= (1)
where fi is the i th
normal mode frequency of the compound concerned. This procedure is repeated
for each dataset compound and then combined to provide a matrix with M rows (compounds) and
4,000/L (columns) descriptor variables. Typically a descriptor set has been derived using a σ of
10 cm-1 and an L of 5 cm-1 giving 800 descriptor variables [19, 20]. Thus, for a QSAR dataset of
typical size the number of variables is very much larger than M and a method such as Partial least
squares to Latent Structures (PLS) in conjunction with crossvalidation [25] is required to provide
a robust regression analysis.
It is important to note that the purpose of the EVA smoothing procedure is not to simulate an
experimental IR spectrum (transition dipole data is discarded and overtones etc. are not
considered) but rather it is to apply a smearing function such that vibrations at slightly different
frequencies in different compounds can be compared with one another. As such the results
obtained with EVA QSAR are usually dependent upon the chosen kernel width (σ) [20-22] since
this parameter determines whether or not, and the extent to which, proximal kernels overlap. A
general approach for choosing an appropriate Gaussian σ is described below together with a
detailed explanation of how the sampling resolution (determined by L) should be selected. It
should be noted that the use of a fixed Gaussian standard deviation (kernel height, width and
shape) means that each frequency (i.e., each part of the spectrum) is equally weighted prior to
regression analysis.
Finally, the smearing procedure described can be applied using functions other than the
Gaussian such as, for example, a Lorentzian, triangular or box function; in-house, and rather ad
hoc, experience suggests that these shapes provide no advantage in terms of QSAR statistical
scores. Alternatively, the smearing technique has been applied to other non-standard spectral and
3. Selection of parameter values
As noted above the purpose of applying the Gaussian kernels to the vwns is to smear them out
such that vibrations at slightly different frequencies in different compounds can be compared to
one another. The univariate variance of each EVA variable thus depends upon the chosen
Gaussian σ and the relative disposition of the vwns both inter- and intra-structurally. Given that
the descriptor variance depends upon these factors it follows that any variance-based method such
as PLS is sensitive to the chosen Gaussian σ. It is indeed the case that optimal σ (as judged by
the resulting PLS scores) can be identified for particular data sets [20, 21] although the sensitivity
to σ is a data set-dependent feature. The much discussed “benchmark” steroid data set [26], for
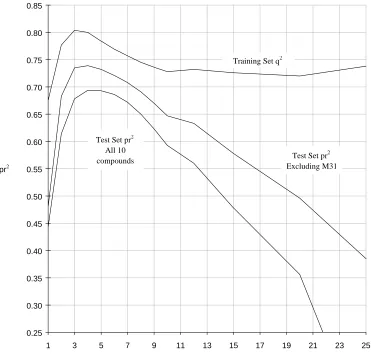
example, is particularly sensitive to σ (as demonstrated in Figure 1) [21]. In this example,
models were obtained for a range of σ from 1 to 25 cm-1 and LOO crossvalidation, fitted
modelling and prediction performed for each descriptor set; PLS model dimensionality was
chosen on the basis of the first SEcv-minimum. It is clear that the best internally predictive
models (judged by q2) are obtained where σ = 3-4 cm-1 and, gratifyingly, test set (i.e., external)
predictivity is also clearly optimal for this σ. For a set of melatonin receptor ligands [22, 27]
there is no such clear optimal σ for q2 (Figure 2); any value of σ in the range 1 to 10 cm-1 gives a
q2 of ~0.47 while the q2 drops off where σ > ~ 10 cm-1. The corresponding test set predictivity on
the other hand shows an optimum at around 4 cm-1 but this peak is not nearly so pronounced as it
is for the steroid set. The overall conclusion from a wide range of analyses [21] was that a default
σ of 10cm-1 is a useful starting point but that it is definitely worth exploring models derived using
alternative σ values.
Care also needs to be taken when selecting an appropriate value of L, the sampling increment
for the BFS. For both EVA and CoMFA the descriptors used for regression are obtained by a
sampling of the descriptor space for each molecule, respectively the Gaussian smeared vwns and
the steric/electrostatic/hydrophobic distance potential functions (loosely referred to as “fields”).
With CoMFA the properties of a particular molecular descriptor sample are determined by the
grid resolution and, at coarse resolutions (see below), by the relationship of the grid-sample
points to the molecules. With EVA such properties are determined by the sampling interval (L)
and, at coarse resolutions, by the "reading frame" (determined by S, the point at which sampling
of the BFS is initiated – default 1 cm-1). Thus, a key issue in extracting these descriptors is the
resolution required to obtain a sample with properties that reflect as closely as possible those of
the population as a whole. Theoretically, this can be done by using an infinitely small sampling
between computational resource/time available for analysis and the stability of the derived PLS
models. However, it is possible to identify a sufficient resolution for both EVA and CoMFA
modelling. In the latter case this amounts to choosing a grid-resolution for which the resultant
PLS scores are invariant (at a given significance level) to the aggregate reorientation/translation
of the aligned structures relative to the bounding 3D-grid. Where the grid-resolution is
insufficient, crossvalidation q2 scores can vary significantly [28] and, as recent studies have
shown [21,22], the test set predictivity can exhibit even greater variance. Only once a sufficiently
descriptive grid resolution has been established (typically, ≤ 1 Å [22]) does it make sense to apply
rational or systematic variable selection techniques to try and obtain simplified models with
enhanced predictivity.
With EVA an entirely analogous situation exists – the sampling interval (L) (the resolution)
must be such that the sample of descriptor space obtained (prior to any systematic variable
selection) is truly representative of the underlying population. Thus, for a given choice of
Gaussian σ, critical values of L (denoted LσCrit) can be estimated based upon examination of the
PLS scores obtained over a range of L. The results of applying this procedure at various Gaussian
σ have been described previously [20, 29] and a general rule-of-thumb is to choose L so that it is
< 2σ. Further examples of such evaluations are given in Figures 3 and 4 using a set of phenolic compounds with log10 (1/MIC) for the oral bacteria P. gingivalis [30,31]. There is an additional
factor to be considered here in as much as the “reading frame”, determined by the point (S)
chosen to initiate sampling of the BFS, provides an alternative source of descriptor variation.
Thus, Figures 3-4 respectively illustrate the range of LOO CV q2 or test pr-r2 scores obtained
where the Gaussian σ = 1 cm-1 and the sampling interval L is varied from 0.2 to 6 cm-1 in 0.2 cm-1
increments; each line represents results obtained where S has a value taken from the range 1.0
(the default) to 1.9 cm-1 in 0.1 cm-1 increments. It is clear that where L < 2 cm-1 the PLS scores
are stable but that once L > ~ 2cm-1 this stability is lost, indicating that the signal-to-noise ratio in
the descriptors is varying. Similar analyses can be done for alternative Gaussian kernel widths
from which the rule-of-thumb noted above has been established.
In general terms it is useful to keep L as large as possible so as to minimise computational and
storage requirements which may be important where a small σ term (and hence L value) is
utilised or where a very large dataset is to be modelled. All models reported here are those for
4. The effectiveness of the EVA descriptor
EVA was originally developed as a descriptor for QSAR [18, 19] and it has been shown to
perform well with a wide range of datasets [19-21]; Table 1 lists a summary of EVA QSAR
modelling statistics with data from various sources taken both from the literature and unpublished
in-house analyses. Many of these analyses were done without a test set, and for these internal
validation statistics only are available. A number of the reported QSARs have been further
validated both with test sets and using data scrambling techniques [21, 22]. This wide range of
successful analyses attests to the general usefulness of EVA as a QSAR descriptor.
In terms of similarity/dissimilarity-based diversity analyses the Tripos neighbourhood
behaviour criterion [32] provides a useful base-line from which to proceed. In essence a
descriptor exhibits neighbourhood behaviour where small differences in a descriptor value tend to
produce only a small difference in biological activity; i.e., high similarity in descriptor space
implies similar biological activity. The converse, that dissimilar molecules will have dissimilar
biological activities, need not be and, fortunately for diversity-based lead discovery is not, a
requirement. Put another way, similarity in descriptor space is a sufficient, but not necessary,
condition for similar biological activity. The EVA descriptor has indeed been shown to exhibit
neighbourhood behaviour [33] thus providing support for its use in diversity analysis/compound
selection protocols.
EVA has also been evaluated for use in similarity searching of structure databases, using
simulated property-prediction methods. Two evaluations have been performed. The first made
use of the Pomona Starlist database with high-quality experimentally determined log P values as
the property to be predicted [23]. Performance here was as only as good as conventional
2D-bit-string descriptors, specifically those in the UNITY chemical information management package
[34]. However, detailed examination of the nearest-neighbour “hits” indicated that EVA tended
to return quite different structures to those obtained with the 2D descriptor, suggesting that
EVA-based similarity searching may be useful as an “ideas generator” for the browsing chemist. A
second, unpublished study has been made using subsets of the World Drugs Index. In these
analyses similarity searching performance was assessed according to how many compounds of
the same activity class were found in nearest-neighbour lists for various selected targets. The
results were compared to those obtained using UNITY 2D bit-strings, and it was again found that
EVA provides similar performance to bit-string-based searching but tend to return different sets
The main obstacle to the utilisation of EVA descriptors in similarity and diversity-studies is
the overhead required to calculate the vwns for which a geometry optimisation step is a
pre-requisite; even with a molecular mechanics approach such as MM3 [35] the time required is at
least an order of magnitude higher than that needed for 2D fragment bit-string descriptors, for
example. The extent to which geometry optimisation can be relaxed, and the time required to
determine vwns thus reduced, without significantly affecting descriptor performance has yet to be
assessed.
5. A modification to the EVA methodology - EVA_GA
In “classical” EVA described above the Gaussian kernels have a uniform fixed σ (i.e., equal
width, height and shape) for all frequencies in all compounds being analysed. This is important
because it means that each frequency (i.e., each part of the spectrum) is equally weighted prior to
regression. In the EVA_GA method [22] the kernel standard deviation (σ) is permitted to have
localised values at different regions on the BFS. This approach permits the determination of an
optimal or near-optimal overlap of kernels across the spectrum, where the quality of this overlap
is judged by the scores from subsequent PLS regression with the derived descriptor matrix. Equal
weighting of frequencies prior to analysis is ensured by scaling the kernels such that they have
unit maximum amplitude; the main difference between the kernels is thus their width and to a
lesser extent shape.
For EVA_GA the BFS is divided up into NBINS bins of equal size and a localised σ
associated with each bin. A frequency value falling within a bin range is thus expanded using the
associated local σ. A GA is used to drive the search for optimal combinations of localised σ,
with the GA chromosome consisting of a vector of NBINS σ values. A typical value of NBINS
is 100 giving a bin width of 40 cm-1. PLS LOO or LNO CV regression scores (i.e., q2) have been
used as the fitness function to be optimised by the GA and the final solution(s) validated using
previously unseen, test sets of compounds. Results with EVA_GA have thus far been extremely
promising with substantial improvements in both q2 and test set predictive-r2 (pr2) scores with a
set of melatonin ligands (Table 2) and a set of phenolic compounds with oral bacteria inhibition
data; when applied to the benchmark steroid dataset (not shown) an improvement in q2 but no
change in pr2 was obtained.
Whilst these results are very promising it has been found that a great deal of care is required to
prevent training set overfit, even where LNO CV q2 is used as the GA fitness score. The GA
when a localised σ of zero is permitted. Such variable selection provides simplified models
which in turn may provide greater opportunity to back-track effectively to structure from an EVA
QSAR. Model interpretation is one of the most appealing features of the CoMFA method while
at present such ready back-transformation is not available within EVA. We are hence also
investigating the use of alternative techniques such as continuum regression [36] and various
variable selection procedures [37-39] that in combination may provide better or more appropriate
reduced-variable models.
6. Related descriptors
As indicated previously [19,20,40] the Gaussian smearing methodology is not restricted to
vwns but can in fact be applied to any suitable non-standard property. The method has since been
applied to other spectral properties [41] − the so-called Comparative Spectra Analysis (CoSA) −
including experimentally determined 1H NMR, Mass and IR spectra as well as simulated IR and
13
C NMR data. The various descriptors were tested using a single set of 45 progestagens, both
with all compounds as a training set and where the compounds were divided into a training and
test set. With the exception of experimental IR descriptors, results with individual spectral
descriptors were generally better than analogous CoMFA analyses; combining the descriptors,
including the molecular fields, in various ways tended to improve the PLS scores obtained.
The Gaussian smearing technique has also been applied to molecular orbital (MO) energies
[42]. The MO energies were obtained semi-empirically and are thus the Electronic EigenVAlues
(EEVA). EEVA has been tested on seventeen data sets with LOO crossvalidated q2 > 0.4 in all
cases except two and some very high q2 scores (up to 0.94) in many cases; external test set
predictivity was not considered here. In the authors’ opinion some of these results are
over-optimistic in as much as models are reported with large numbers of PLS LVs relative to the
number of data-points (compounds). Nonetheless, there are sufficient numbers of significant
results presented to suggest that EEVA is a promising descriptor. Furthermore, an in-house
EEVA analysis using the aforementioned steroid dataset [1,26] has however provided models
with both good internal and external predictivity (Gaussian σ = 9 eV, q2 = 0.75 (4); r2 = 0.97; pr
-r2 = 0.59).
7. Conclusion
EVA has proved to be an effective and robust descriptor for use in QSAR studies as evidenced
by the large number of successful analyses documented herein. EVA has been found to perform
EVA’s main limitation is that PLS regression models are very difficult to interpret in terms of
(contra)-indicated molecular features. However, efforts are underway to simplify regression
models through variable selection techniques such that back-tracking from a model may be
facilitated. The descriptor has also been validated for use in diversity/compound selection
protocols through the demonstration of its neighbourhood properties and through
nearest-neighbour based simulated property-prediction studies.
Acknowledgements. We thank Shell Research Limited, the Science and Engineering
Research Council and the Biotechnology and Biological Sciences Research Council for funding,
Tripos Inc. for software support and Trevor Heritage and Allen Ferguson for their contributions
to this work. This paper is a contribution from the Krebs Institute for Biomolecular Research,
which is a designated Biomolecular Sciences Centre of the Biotechnology and Biological
Sciences Research Council.
References
1 Cramer, R.D., Patterson, D.E., Bunce, J.D., J. Am. Chem. Soc. 110 (1988) 5959.
2 Oprea, T.I., Waller, C.L., Theoretical and Practical Aspects of Three-Dimensional Quantitative Structure-Activity Relationships. In Lipkowitz, K.B., Boyd D.B. (Eds) Reviews in Computational Chemistry, Vol. 11 Wiley-VCH, New York, 1997.
3 Kellogg, G.E., Semus, S.F., Abraham, D.J., J. Comput.-Aided Mol. Design, 5 (1991) 545. 4 Carrupt, P.-A., Gaillard, P., Billois, F., Weber, P.C., Testa, B., Meyer, C., Perez, S., In
Lipophilicity in Drug Action and Toxicology, Pliska, V., Testa, B., Van de Waterbeemd, H., (Eds), Methods and Principles In Medicinal Chemistry series, VCH Publishers, Weinheim, 1996, Vol. 4, pp 195-217.
5 Hansch, C., Fujita, T., J. Am. Chem. Soc., 86 (1964) 1616.
6 Hansch, C., Leo, A., Exploring QSAR. Fundamentals and Applications in Chemistry and Biology. ACS Professional Reference Book, American Chemical Society, Washington, DC, 1995.
7 Cruciani, G., Clementi, S., In van de Waterbeemd, H., (Ed.) Methods and Principles in Medicinal Chemistry, Vol. 3, Advanced Computer-Assisted Techniques in Drug Discovery, VCH, Weinheim, Germany, 1995, pp. 61-88.
8 Goodford, P. J. Chemometrics, 10 (1996) 107.
9 Klebe, G., Abraham, U., Mietzner, T., J. Med. Chem., 37 (1994) 4130. 10 Kubinyi, H. (Ed.) 3D QSAR in Drug Design. ESCOM, Leiden, 1993. 11 Cho, S.J., Tropsha, A., J. Med. Chem., 38 (1995) 1060.
12 Kroemer, R.T., Hecht, P., J. Comput.-Aided Mol. Design, 9 (1995) 205. 13 Kroemer, R.T., Hecht, P., J. Comput.-Aided Mol. Design, 9 (1995) 396. 14 Silverman, B.D., Platt, D.E., J. Med. Chem., 39 (1996) 2129.
15 Muresan, S., Sulea, T., Ciubotariu, D., Kurunczi, L., Simon, Z., Quant. Struct.-Act. Relat., 15 (1996) 31.
17 Todeschini, R., Vighi, M., Provenzani, R., Finizio, A., Gramatica, P., J. Chemosphere, 32 (1996) 1527.
18 Jonathan, P., McCarthy, W.V., Roberts, A.M.I., J. Chemometrics, 10 (1996) 189.
19 Ferguson, A.M., Heritage, T., Pack, S.E., Phillips, L., Rogan, J., Snaith, P.J., J. Comput.-Aided Mol. Design, 11 (1997) 143.
20 Turner, D.B., Willett, P., Ferguson, A.M., Heritage, T., J. Comput.-Aid. Mol. Design, 11 (1997) 409.
21 Turner, D.B., Willett, P., Ferguson, A.M., Heritage, T., J. Comput.-Aid. Mol. Design, 13 (1999) 271.
22 Turner, D.B., Willett, P., J. Comput.-Aid. Mol. Design, in press.
23 Ginn, C.M.R., Turner, D.B., Willett, P., Ferguson, A.M., Heritage, T.W., J. Chem. Inf. Comput. Sci., 37 (1997) 23.
24 Scott, A.P., Radom, L., J. Phys. Chem., 100 (1996) 16502.
25 Wold, S., Ruhe, A., Wold, H., Dunn III, W.J., SIAM J. Sci. Stat. Comput., 5 (1984) 735. 26 Coats, E.A., In Kubinyi, H., Folkers, G., Martin, Y.C. (Eds.) 3D QSAR in Drug Design:
Recent Advances. Perspectives in Drug Discovery and Design, Vols. 12/13/14. Kluwer/ESCOM, Dordrecht, The Netherlands, 1998, pp.199-213.
27 Sicsic, S., Serraz, I., Andrieux, J., Brémont, B., Mathé-Allainmat, M., Poncet, A., Shen, S., Langlois, M., J. Med. Chem., 40 (1997) 739.
28 Cho, S.J., Tropsha, A., J. Med. Chem., 38 (1995) 1060. 29 Turner, D.B., PhD Thesis (1996) Sheffield University, UK.
30 Shapiro, S., Guggenheim, B., Quant. Struct.-Act. Relat., 17 (1998) 327. 31 Shapiro, S., Guggenheim, B., Quant. Struct.-Act. Relat., 17 (1998) 338.
32 Patterson, D.E., Cramer III, R.D., Ferguson, A.M., Clark, R.D., Weinberger, L.E., J. Med. Chem., 39 (1996) 3049.
33 Clark, R.D., Brusati, M., Jilek, R., Heritage, T., Cramer, R.D., Validating QSAR Descriptors for Use in Diversity Analysis. In Molecular Modeling and Prediction of Bioactivity, Gundertofte, K., Jorgensen, F.S., (Eds.) Plenum Press, NY; in press.
34 UNITY is available from Tripos Inc. at http://www.tripos.com/
35 MM3(94) Manual (Version 1.0). Tripos Associates Inc., 1699, South Hanley Road, St. Louis, MO 63144, U.S.A. This contains numerous references to the MMx series of programs developed by Norman Allinger and co-workers at the University of Georgia.
36 Stone, M., Brooks, R.J., J. Royal Stat. Soc. Series B - Methodological, 52 (1990) 237.
37 Cruciani, G. and Clementi, S., In van de Waterbeemd, H., (Ed.) Methods and Principles in Medicinal Chemistry, Vol. 3, Advanced Computer-Assisted Techniques in Drug Discovery, VCH, Weinheim, Germany, 1995, pp. 61-88.
38 Lindgren, F., Geladi, P., Rannar, S., Wold, S. J., Chemometrics, 8 (1994) 349.
39 Clementi, S. and Wold, S., In van de Waterbeemd, H., (Ed.) Methods and Principles in Medicinal Chemistry, Vol. 2, Chemometric Methods in Molecular Design, VCH, Weinheim, Germany, 1993, pp. 319-338.
40 Heritage, T.J., Ferguson, A.M., Turner, D.B., Willett, P., In Kubiny, H., (Eds.) 3D QSAR in Drug Design, Volume 2, pp. 381-398.
41 Bursi, R., Dao, T., van Wijk, T., de Gooyer, M., Kellenbach, E. and Verwer, P., J. Chem. Inf. Comp. Sci., 39 (1999) 861.
43 Winn, M., von Geldern, T.W., Opgenorth, T.J., Jae, H.-S., Tasker, A.S., Boyd, S.A., Kester, J.A., Mantei, R.A., Bal, R., Sorenson, B.K., Wu-Wong, J.R., Chiou, W.J., Dixon, D.B., Novosad, E.I., Hernandez, L., Marsh, K.C., J. Med. Chem., 39 (1996) 1039-1048.
Table 1: Summary of published and in-house EVA QSAR analyses. EVA descriptors were not scaled (NS) unless stated otherwise. On the whole
autoscaling (AS) the descriptors either did not improve or produced a deterioration in PLS model statistics. Test set performance is indicated where available.
Dataset1 n2
Biological End-point / Property
Best σ = 10 cm-1
q2 (ONL) σ q2 (ONL)
Test Set pr-r2
Best σ / σ = 10 cm-1
β-Carboline [20] 41 benzodiazepine receptor inverse agonists and antagonists (log
IC50)
0.66 (7) 22 0.50 (6) - -
BCDEF [19] 135 + 68 Experimental log P - - 0.68 - 0.65
Biphenyls (BIP) [20] NS AS
14 Ah (Dioxin) Receptor Binding Affinity (pEC50)
0.14 (3) 7 ≤ 0
0.45 (3) 16 0.28 (2)
- -
- -
Cain/Cometto-Muniz 52
44
Odour thresholds (ODT)3 Log( 1 / ODT)
0.57 (5) 25 0.54 (5)
0.71 (7) 15 0.62 (5)
- -
- -
Dibenzo-p-dioxins (DPD) [20] 25 Ah (Dioxin) Receptor Binding Affinity (pEC50)
0.70 (2) 18-40 0.65 (2) - -
Dibenzofurans (DBF) [20] 39 Ah (Dioxin) Receptor Binding Affinity (pEC50)
0.74 (4) 7-9 0.73 (4) - -
DPD + BIP + DBF combined [20]
78 Ah (Dioxin) Receptor Binding Affinity (pEC50)
0.64 (3) 14-21 0.62 (3) - -
Endothelins Abbott [43] 55 ETA receptor (1/logIC50) 0.49 (2) 50 0.58 (3) - -
BMS [44] 36 ETA receptor (1/logIC50) 0.54 (3) 1 0.71 (5) - -
Melatonin Receptor Ligands [22]
44 + 9 pKi for chicken brain melatonin receptors
0.46 (2) 10 as best 0.66/0.814 as best
Nitromethylene heterocycles [20]
17 1/log LC50 values for the pea
aphid
0.66 (3) 4 0.49 (3) - -
Oxadiazoles [20] NSg AS
23 toxicity index (TI) for red spider mite eggs (1/log TI)
≤ 0 - ≤ 0
≤ 0 - ≤ 0
- -
- -
Phenols [30,31] P. gingivalis5 62 + 62 Log( 1/MIC ) 0.81 (3) 10 as best
0.69 (3) 10 as best
0.75 as best
0.83 as best
Str. Sobrinus5 56 + 55 Log( 1/MIC ) 0.85 (3) 10 as best
0.83 (6) 10 as best
0.78 as best
0.89 as best
S. artemidis5 55 + 55 Log( 1/MIC ) 0.68 (3) 10 as best
0.74 (6) 10 as best
0.61 as best
0.69 as best
Piperidines [20] 137 1/log IC50 for U. Maydis 0.78 (3) 2-4 0.76 (4) - -
Steroids (TBG) [20] 21 testosterone- and corticosterone-binding globulin (TBG and CBG) binding affinity (log [K]).
0.70 (4) 8-11 0.70 (4) - -
Steroids (CBG) [20] 21 + 10 As above 0.75 (1) 3 0.70 (2) - -
Steroids (CBG) [21] 21 + 10 As above 0.80 (2) 3/4 0.73 (2) 0.69 0.59
Steroids (CBG) Design_1 [22] 11 + 20 As above 0.55 (1)6 4 0.55 (2)6 0.51 0.34
Design_2 [22]
10 + 18 As above 0.69 (2) 4 0.63 (2) 0.69 0.63
Sulphonamides [20] 100 log 1/IC50 for acetolactate
synthase inhibition
0.55 (3) 2 0.56 (7)
0.57 (7) 7- 8
- -
- -
Tropanes [20] 13 cocaine binding site (1/log IC50) 0.68 (3) 65 (+) 0.49 (2)
0.55 (3) 13
- -
1
Citations refer either to papers where the relevant EVA QSAR analyses are described (within which further references are given) or, where such is not available, the original literature reference is given.
2
n – number of training set compounds (+ number of test set compounds where available).
3
Minimum vapour concentrations that human subjects can detect in ppm.
4
Test set pr-r2 excluding two outliers.
5
These datasets were split into two equal-sized groups and models developed for each group were used to predict the activities of the compounds in the other group.
6
Table 2: Some EVA_GA results: melatonin receptor ligands [22] and bacteria inhibiting phenolic compounds: see Table I for equivalent “classical” EVA results and further details.
Training Set Test Set
Dataset n LOO q2 ONL RAND_PERM
1
p for q2
r2 Predictive-r2
Melatonin 44 0.65 3 3.0 ×10⁻⁵ 0.90 0.72 / 0.89
Phenols / P. gingivalis
62 0.89 3 3.2 ×10⁻⁷ 0.93 0.77
Phenols / S. sobrinus
56 0.90 3/4 6.7 ×10⁻⁶ 0.97 0.79
Phenols / Str. Artemidis
55 0.77 2 1.3 ×10⁻⁸ 0.95 0.64
1
RAND_PERM: training set random permutation (Y scrambling) tests: p gives an estimate of the probability that the observed model may have occurred by chance.
2
Figure 1:
Steroid dataset: PLS
q
2or test set
pr
-
r
2vs. Gaussian
σ
(see main text for
further details).
q2/pr2
0.25 0.30 0.35 0.40 0.45
1 3 5 7 9 11 13 15 17 19 21 23 25
Gaussian Standard deviation (cm -0.50
0.55 0.60 0.65 0.70 0.75 0.80 0.85
1
)
Test Set pr All 10 compounds
2
Training Set q2
Test Set pr Excluding M31
Figure 2: Melatonin receptor ligands: PLS q2 or test set pr-r2 vs. Gaussian σ (see main text for further details).
Figure 3: P. ors derived where
the BFS is sampled starting at S cm
gingivalis phenolic inhibitors: Training set LOO CV q2 vs. sampling increment (L) where Gaussian σ = 1.0 cm-1. Each line represents descript
-1
. The q2 is stable only where L < ~2σ.
0 0.1 0.2 0.3 0.4 0.5 0.6 0.7 0.8
0 2 4 6 8 10 12 14 16 18 20 22 24 26 28 30
Test Set pr-r2
PLS Model Dimensionality
σ <= 16 ⇒ ONL = 2
σ > 16 ⇒ ONL = 1
0.775 0.800
Training Set q2
Gaussian Standard Deviation, σ (cm )-1
[image:18.595.106.704.496.587.2]Figure 4: P. gingivalis phenolic inhibitors: Test set pr-r2 vs. sampling increment (L) where Gaussian σ = 1.0 cm-1. Each line represents descriptors derived where the BFS is sampled starting at S cm-1. The pr-r2 is stable only where L < 2σ.
0.53 0.54 0.55
pr-r
0.56 0.57 0.58 0.59
2

![Table 2: Some EVA_GA results: melatonin receptor ligands [22] and bacteria inhibiting phenolic compounds: see Table I for equivalent “classical” EVA results and further details](https://thumb-us.123doks.com/thumbv2/123dok_us/8095758.232708/16.595.80.516.128.359/melatonin-receptor-bacteria-inhibiting-phenolic-compounds-equivalent-classical.webp)