Article
Test and Finite Element Analysis of Gravity Load
Designed Precast Concrete Wall Under Reversed
Cyclic Loads
Preeda Chaimahawan
1,a,*, Chayanon Hansapinyo
2,b, and Punlop Phuriwarangkhakul
1,c1 School of Engineering, University of Phayao, Maeka, Muang, Phayao 56000, Thailand
2 Department of Civil Engineering, Faculty of Engineering, Chiangmai University, Huay Kaew Road,
Muang, Chiang Mai 50200, Thailand
E-mail: apreeda.ch@up.ac.th (Corresponding author), bchayanon@eng.cmu.ac.th, cpunlop.8328@gmail.com
Abstract. This research studies the lateral behavior of precast concrete wall panel applicable for a 2-story building. The specimens consist of precast and cast in-situ reinforced concrete bearing wall with 3/4 scaled. The precast wall panel was designed for gravity load only. The specific connection in this study was the welded connection between dowel bar and steel plate embedded in precast wall which was the famous one of the connection for precast bearing wall system in Thailand. The specimens are tested under reversed cyclic loadings through hydraulic actuator in laboratory. The tested results reveal that the precast concrete wall can resist maximum lateral load and show almost the same behavior as cast in-situ RC wall. The cracks of precast wall panel are concentrated around the connection while cast in-situ RC wall are flexural and shear cracks dominant 500 millimeters above the footing of wall. The superimposed technique of the element in FEM analysis is used to model the connection of precast wall. The prediction by FEM analysis for cyclic behavior, hysteretic loop and maximum load are matched with the test results for both specimens.
Keywords: Bearing wall system, precast concrete wall, seismic resistance design, two story house.
ENGINEERING JOURNAL Volume 22 Issue 2 Received 1 August 2017
DOI:10.4186/ej.2018.22.2.185
1.
Introduction
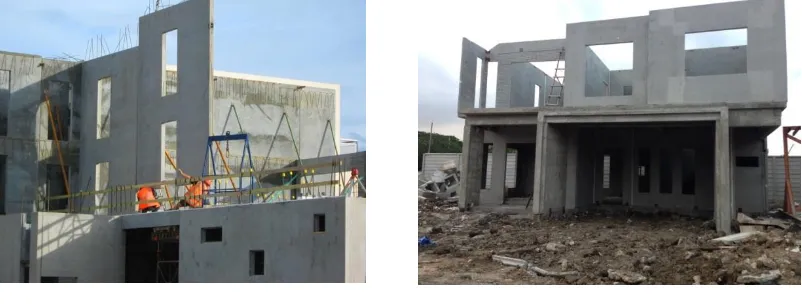
[image:2.595.90.491.279.431.2]With the merits of using precast element for building construction, the technique has been widely adopted. Construction duration and waste can be minimized while the cost is comparable with the conventional cast-in-place buildings. Among various precast systems, the bearing wall is one of the most popular types. The building construction with the prefabricated bearing wall system has been developed for a long time as shown in Fig. 1. In Thailand, the precast system has just begun around the year of 1992. Many housing entrepreneur companies in Thailand brought the precast technology form other countries to develop its own housing project [1]. Some companies bought the in-tech machine from aboard for casting the prefabricated elements, such as slab, wall, column and beam. Some companies could develop their own methodology for casting and installing the precast system. However, almost all precast bearing wall systems in Thailand are gravity load designed. The first precast bearing wall building in Thailand with wind load and seismic load consideration is the 30 stories condominium constructed by Pruksa Real Estate Public Company Limited. This project was designed and used the knowhow from foreign country engineer while Thai engineer can learn and share this technology [2].
Fig. 1. Precast bearing wall system in other country
(http://www.latteycivil.co.nz/precpanelswalls.php). Fig. 2. Precast bearing wall system in Thailand.
In the northern area of Thailand, building regulation requires seismic design for the moderate intensity. The area had long been considered as non-seismic area. However, the current proved active faults and the recent 6.3 Earthquake shaking Chiang Rai on May 5, 2014 have confirmed the risk in the area. As the continued economic growth, a number of construction projects have been emerging. This is particular to the residential building. This happening causes the guideline for research and development for 2 or 3 stories residential house designed to resist seismic load.
Fig. 3. Connection between upper and lower floor
fromACI-550.1R [13]. Fig. 4 Connection between upper and lower floorfromPCI [14].
The survey of connection between upper and lower floor precast concrete wall shown that there are three type of connection consisting of,
1. Welding between dowel bars embedded in precast concrete wall as shown in Fig. 5. PCI Manual [14] suggest minimum thickness of welding (tw) should be 0.3 time diameter of dowel bar tw 0.3db
2. Welding of steel plate embedded in precast concrete wall and insert plate as shown in Fig. 6. The thickness of welding should not be larger than the thickness of the smaller one
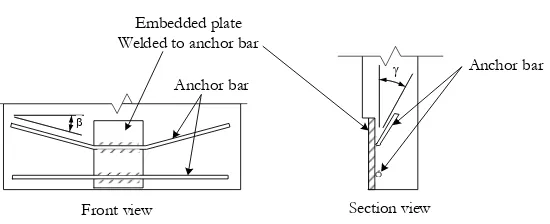
3. Welding between dowel bar embedded in lower precast concrete wall and steel plate embedded in upper wall as shown in Fig. 7. PCI Manual [14] suggest the angle of anchor dowel bar welded to embedded steel plate should not be greater than 15 degree and thickness of welding between dowel bar embedded in lower precast concrete wall and steel plate embedded in upper precast concrete wall should be around 0.2 time diameter of dowel bar tw 0.2db
All three types of connection are easy to install but the famous type is welding between dowel bar embedded in lower precast concrete wall and steel plate embedded in upper wall. Since it allow more tolerance and ease of installation. The method 1 can be welded in one side while the method 3 can be welded on both side of dowel bar. Therefore, this research selects method 3 as a connection of precast wall specimen for studying the behavior under reversed cyclic loading.
[image:3.595.112.508.474.649.2]DOI:10.4186/ej.2018.22.2.185
Fig. 6. Connection detail of Welding of steel plate embedded in precast concrete wall and insert plate.
Fig. 7. Connection detail of Welding between dowel bar embedded in lower precast concrete wall and steel plate embedded in upper precast concrete wall.
The reinforcement detail of steel plate embedded in precast wall is showed in Fig. 8. The thickness of steel plate should be larger than 9 millimeters. The embedded steel plate is welded to 2 deformed bars or round bars, 9 to12 millimeters in diameter. The anchorage length should be enough to develop the yielding strength. Designed force of the embedded bar can be calculated from
0.5
coscos 95.
0 As fy
T (1)
where, s
A is the cross section area of embedded bars
y
f is the yield strength of embedded bars
and are the angle of the embedded bars with respect to horizontal and vertical directions, respectively , normally between 20-30 degrees.
Section view Front view
Embedded plate Welded to anchor bar
Anchor bar
Anchor bar
Fig. 8. Reinforcement details of steel plate and anchorage bar embedded in the precast concrete wall.
(Max.)
[image:4.595.109.489.240.386.2] [image:4.595.160.435.611.723.2]However, the above mentioned precast wall details have been mainly designed for gravity load resistance. As the connection details provide low level of difficulty, unless requiring more details, the applicability for low-rise buildings in moderate seismic area is possible. Hence, this research aims to study the seismic performance of the precast concrete bearing wall system for low rise buildings and especially focuses on the connection between precast wall in upper and lower story in Thailand. Two wall panels were tested under cyclic loading. It is noted that, all specimens were only designed for gravity load. In addition, nonlinear finite element analysis was conducted and proposed equation from literature [15] for estimating lateral shear capacity was used to determine the capacity. This study extracts the way to modify the connection appropriately resisting seismic force. If the connections of precast concrete wall have enough ductility for resisting low to moderate seismic force, it will be the solution of the current construction method for residential house. Since precast concrete technique can reduce the construction course, labor course, construction time and waste material at construction site while give the better quality control for construction material. It also reduces the seismic hazard for people who live in risk area.
2.
Specimens Detail
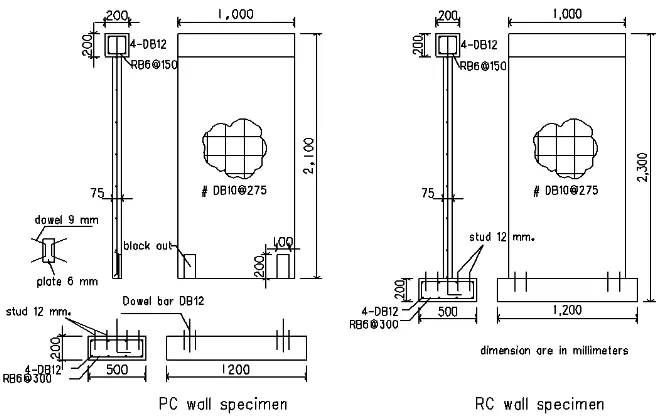
The experimental program consists of 2 specimens of wall panel, namely, PC wall and RC wall. PC wall was represented precast reinforcement wall and RC wall represented cast in-situ reinforcement concrete wall. All specimens were 3/4 scale. Since the purpose of the research was to study seismic response of precast wall without seismic reinforcement detail. The test specimens were chosen to be as close as possible to the actual ones constructed without considering seismic effect. Both specimens have the same dimension and reinforcement. The height, thickness and width of specimens are 2,300 millimeters, 75 millimeters and 1,000 millimeters, respectively. Inside the panels were provided by #DB10@275 millimeters as shown in Fig. 9. Reinforcement in wall panel was kept to be the same ratio as used in residential building, normally #DB12@250 mm and wall thickness 100 mm. In order to grip with the hydraulic actuator, the top of the wall panel has dimension 200x200 millimeter. The bottom of wall panel was design to be a footing, in order to fasten to reaction floor of laboratory. The specimen preparation was intension to simulate real construction stage. PC specimen wall panel and footing were cast independently. After that they were connected each other by welding the dowel bar embedded in footing and embedded steel plate in precast wall panel. For RC wall specimen, the adverse construction stage, the wall and footing were cast together in the same time. The detail of dimension and reinforcement of both specimens are shown in Fig. 9. The photo of pc wall specimen preparation is shown in Fig. 10.
[image:5.595.130.460.490.698.2]DOI:10.4186/ej.2018.22.2.185
[image:6.595.115.483.76.257.2](a) specimen in casting stage (b) specimen in connecting stage
Fig. 10. Photo of specimen preparation.
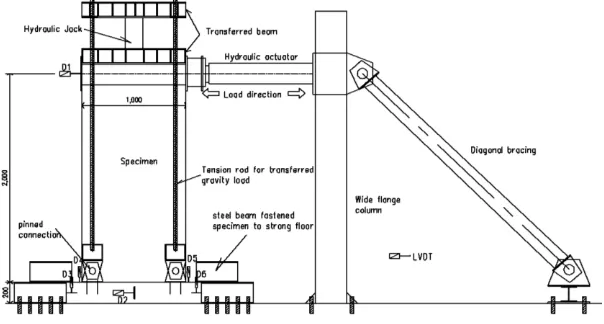
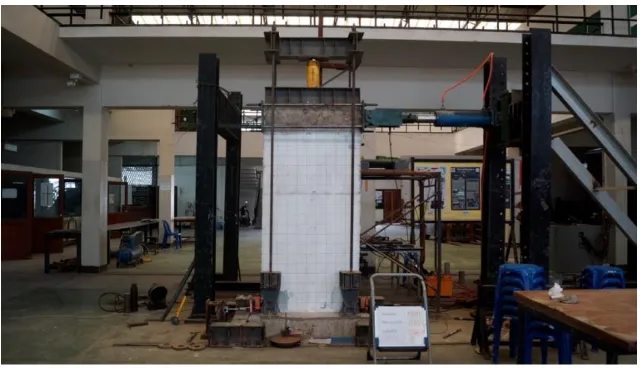
Schematic figure of experimental setup is shown in Fig.11. The 300 kN capacity hydraulic actuator was applied to the top of specimen and attached to steel frame with diagonal bracing which was fasten to strong floor. The simulation gravity load from above floor transferred to wall panel is 0.05fcAg through hydraulic jack, transfer beam and tension tie connected with footing by pinned joint. The footing of specimen was held by steel beam and fastened to strong floor with bolts. The history load applied through displacement control was followed ACI T1.1-01[16] as shown in Fig. 13. Photo of experimental setup before testing is shown in Fig. 12.
[image:6.595.148.450.408.570.2]Fig. 12. Photo of specimen test setup.
The average tested cylindrical compressive strength of concrete is 23.5 MPa. The average tested yield and tensile strengths of these bars are shown in Table 1.
Table 1. Properties of reinforcing bar.
Type of reinforcing bar DB12 DB10 RB9
Yield strength(MPa) 420 425 350
Ultimate strength (MPa) 530 562 486
Fig. 13. Displacement history [16].
3.
Experimental Result and Analysis
3.1. Crack propagation of specimens
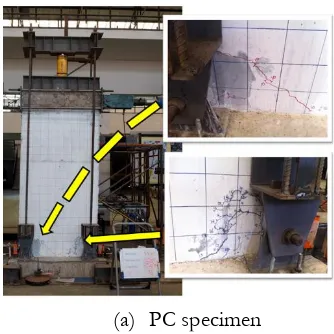
The cracking development of PC specimen is shown in Fig. 14(a). The first crack occurs at the connection between wall panel and footing in 0.15% drift ratio. The subsequence crack is the concrete grout covered steel plate in wall panel. The same crack was also found in the other side of specimen when the load acting in reversed direction. The crack grew in size and number as the drift increased. It was found that crack was concentrated around the concrete grout. However, the final failure mode of PC specimen is not the failure of wall panel. Since the precast concrete wall is very stiff and the connection of foundation and strong floor was poorly designed, so failure mode of this specimen was the shear failure of foundation.
Behavior of crack propagation of specimen RC was showed in Fig. 14(b). The behavior of crack is difference for specimen PC. The first crack occurred at the connection of wall panel and footing at 0.15% drift ratio since the suddenly change of cross section area. However this crack did not grew in size and number as the drift increased. The flexural crack crossing the wall panel was occurred at 500 millimeters
-2.5
-1.5
-0.5
0.5
1.5
2.5
0
3
6
9
12 15 18 21 24 27
St
ory drif
t
(
%
)
[image:7.595.183.412.357.552.2]DOI:10.4186/ej.2018.22.2.185
from footing in 0.65% drift ratio. The flexural crack was progressed and become diagonal crack X shape at both side of wall at 1.30% drift ratio. The final failure mode of RC specimen was the same as PC specimen by shear failure of footing before severe failure of wall panel.
[image:8.595.95.262.127.294.2](a) PC specimen (b) RC specimen
Fig. 14. Crack development in specimen.
3.2. Relationship between Load and Drift Ratio
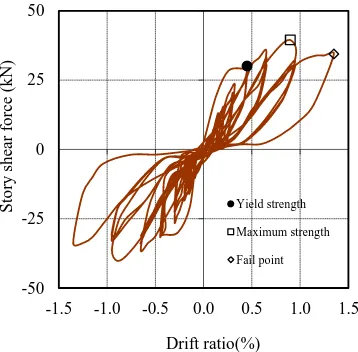
Figure 15(a) Show relationship between load and drift ratio of PC specimen. PC specimen can resist maximum load 38.8 kN at 0.7% drift ratio. The yield point occurs at 0.21% drift ratio with in load 27.3 kN. The hysteretic loop of this specimen is pinch since there is no obvious crack occurred in wall panel. The hysteretic loops remained stable without apparent drop in strength and stiffness until 0.7% drift ratio. The ductility of specimen [17] calculated to be 3.3, according to additional design requirements for earthquake effects in NZS 3101:2006 [18] that limited ductility wall should have ductility factor at least 3. The energy dissipated by the specimen was computed as the area within hysteresis loops of lateral shear force-displacement relation. The total cumulative energy dissipation was calculated as the sum of cumulative energy in the two loading directions. The energy dissipated from the beginning till 0.7% drift ratio is 1,653 joules. The PC specimen failed by brittle shear failure within foundation while it was still in elastic range. So the calculated energy dissipation was the energy in elastic range. It could not be clearly conclude that the nonlinear behavior of the specimen.
[image:8.595.340.491.128.284.2](a) PC specimen (b) RC specimen
Fig. 15. Shear force and drift ratio.
3.3. Steel Strain
[image:9.595.322.501.86.262.2]Measured strains for vertical bar in wall panel of RC specimen were shown in Fig. 16b. The maximum tensile strain of vertical bar at edge of wall panel, above the footing 50 mm, was approximately 2400 micron. The strain reached yielding but did not developed large plastic strain. Measured strains for dowel bar embedded in the footing and welded to embedded plate in the wall panel for PC specimen were shown in Fig. 16a. The maximum tensile strain was approximately 3500 micron. The strain of PC specimen trended to be the same as that of RC specimen. The strains were surpassed yielding but did not developed large plastic strain. The strains of PC specimen were a little bit higher than that of RC specimen, since there were only 2-DB12 transferred force between wall panel and footing while 4-DB10 were transferred force in RC specimen. It can be note that, the connection of dowel bar welded to embedded plate is enough to transfer tension force. Bar can develop force until yielding zone.
[image:9.595.71.528.486.661.2](a) PC specimen (b) RC specimen
Fig. 16. Measured steel strain in the specimen.
3.4. Comparison between Tested and Calculated Equation
The lateral shear force of precast wall for residential building from the experiment is compared with an equation proposed by Francisco J. et al. [15]. The proposed equation are formulated from the shear force at the base of the wall corresponding to the development of the flexural overstrength, Vo and moment Mo. The equation is
-50 -25 0 25 50
-1.5 -1.0 -0.5 0.0 0.5 1.0 1.5
S to ry sh ea r fo rc e (k N) Drift ratio(%) Yield strength Maximum strength Fail point -50 -25 0 25 50
-1.5 -1.0 -0.5 0.0 0.5 1.0 1.5
St o ry sh ea r f o rc e (k N ) Drift ratio(%) Yield strength Maximum strength Fail point -1000 0 1000 2000 3000 4000
0 100 200 300 400 500
Str ai n( m icr on) . Step number SG1 SG2
yield SG2 50 SG1
m m + --1000 0 1000 2000 3000 4000
0 100 200 300 400 500
Str ai n( m icr on) . Step number SG1 SG2 yield +
-SG2 50m SG1
DOI:10.4186/ej.2018.22.2.185
(2)
where hef f is the height measured from the base of the wall to the resultant lateral force. For both specimens hef f are 2,000 millimeter.
o
M is the moment obtained by assuming the steel reinforcement beyond yield strength with in reserve strength stage and assuming the end of wall panel is the resultant compressive force,
Cc as shown in Fig. 17. The moment (Mo) can be computed from
wy N gl
T
M
2
0
0 (3)
where w0 is the over strength factor, use 1.25
g is the distance between the centroid of the group of bars as a proportion of the wall length, usually between 0.5g0.95
w
l is the length of the wall, for both specimen equal to 1,000 millimeters N is the concentric axial force
y T
2
y stf
A
is the yield force of reinforcing bars group
st
A is the total vertical of reinforcing bars connected to the base and Ast/2 is the area of
reinforcing bars located toward one end of the wall
is the coefficient represent the ratio between the force in the bars grouped close to the extreme fiber in compression to that of the bars grouped close to the extreme fiber in tension. A conservative expression proposed for determining the coefficient is 12g
[image:10.595.213.383.456.627.2] is the kink angle of the reinforcement in the walls as shown in Fig. 17
Fig. 17. Shear resisting mechanisms at joint between a wall panel and foundation [15].
The moment capacity (Mo) calculated follow Eq. (2) to (4) is equal to 77.58 kN-m. The shear strength of wall (V0) calculated to be 38.79 kN. It can be note that the calculated shear strength is close to
experimental result that the maximum story shear force is 38.8 kN and 39.4kN for PC specimen and RC specimen, respectively. The strains measure at dowel bars of PC specimen were in yield point while that of RC specimen were in elastic range and reach yield point.
ef f
h M
V0 0
ef f
h M
4.
Finite Element Analysis
A nonlinear finite element analysis is conducted for two purposes. The first is to serve as a numerical platform for performance check of strengthened specimens. Secondly, the FEM is used to explore the internal behavior of wall specimens that were not obtained from the experiment. The nonlinear FEM
program named “WCOMD” [19] was adopted in this study.
4.1. Construction of FEM Model
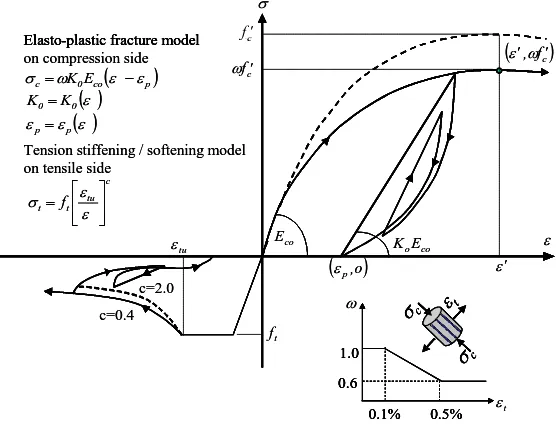
The FEM models were constructed based on 2-dimensional 8 node reinforced concrete planar elements. The cracking in concrete and steels are assumed to be smeared over the element. The constitutive models for reinforced concrete, steel reinforcement and steel plate follows Okamura and Maekawa [20]. Only the constitutive models are presented shortly here. Additional information can be found in reference [20-21]. For crack concrete model, the constitutive laws are formulated with respect to the active crack. The relevant constitutive laws are divided into two components.
(a) Combined tension- compression model for normal stress orthogonal and parallel to a crack
The constitutive law for normal stress orthogonal and parallel to a crack is shown in Fig. 18. The compressive stress parallel to a crack, the following elasto-plastic fracture model [20] that considers the effect of micro-fracture and plasticity is used, is calculated from
) (
0
0 c p
c K E
(4)
where c is the compressive stress, is transverse tensile strain factor, K0 is the fracture parameter, 0
c
E is the initial stiffness and p is the plastic compressive strain.
On the tensile side, the model is linear up to tensile strength of concrete (ft). After peak stress, a
constant tensile stress is maintained until concrete cracks as shown in Fig. 18. The cracking strain is calculated from,
c t tu 2Ef
(5)
where t, is the tensile stress and concrete strain, ft is the concrete tensile strength, tu is the cracking
[image:11.595.158.436.532.747.2]strain and c is a stress release parameter.
Fig. 18. Combined compression-tension model for normal stress orthogonal and parallel to a crack.
0.6 1.0 0.1% 0.5% t c 'c
Tension stiffening / softening model on tensile side
Elasto-plastic fracture model on compression side
c 0.6 1.0 0.1% 0.5% t c Elasto-plastic fracture model
-c
p
co 0
c KE
0 0 K K
p pc tu t t f c f c f
,fc
co E co oE K
p,otu c=2.0 c=0.4 t f t 0.6 1.0 0.1% 0.5% t c 'c
Tension stiffening / softening model on tensile side
Elasto-plastic fracture model on compression side
c 0.6 1.0 0.1% 0.5% t c Elasto-plastic fracture model
-c
p
co 0
c KE
0 0 K K
p pc tu t t f c f c f
,fc
co E co oE K
p,oDOI:10.4186/ej.2018.22.2.185
(b) Shear stress transfer model
For computing shear stress transmitted along a crack face, the contact density model is adopted as shown in Fig. 19. The equation of the shear envelope may be expressed as,
1/3 221 8 . 3 c
cr f (6)
where is the normalized shear strain defined as,
t cr
(7)
where cr is the shear strain due to crack and t is the tensile strain normal to crack.
Fig. 19. Shear stress transfer model. Fig. 20. Reinforcing bar model.
For reinforcing bar model, the tri-linear model of reinforcing bar is adopted in Fig. 20. The dotted line in the figure shows the model of bare steel bar for comparison. The yield stress of bar is assumed to be which is lower than tested yield strength of bare bar. The apparent reduction in yield strength is caused by bond effect. The average yield strength of reinforcing bars embedded in concrete may be expressed as,
2t
y
y f f
f (8)
where fy is average yield strength of reinforcing bar embedded in concrete, fy is the yield strength of
bare bar, ft is the tensile strength of concrete and is the reinforcement ratio.
There were 236 elements with 802 nodes for the RC specimen while the PC specimen had 244 elements and 802 nodes. In order to simulate the non-linear behavior at the interface between wall and footing, the connection was modeled by one-dimensional with zero thickness. At the interfacial contact, local discontinuities such as reinforcement pull-out, interface shear transfer and local compression may occur. In order to simulate the precast connection between wall and footing the steel plate in PC wall specimen was superimposed on RC element. It can be noted that there was no transmitted reinforcement and bonding between RC element on wall and footing, just only steel plate could transfer tension and compression force through the steel plate and footing for the PC specimen. Boundary condition for footing is model with pined at the node as shown in Fig. 21 for both specimens.
t
cr
=
2
1+2 fst
0.85
cr=
cr t cr = 2
1+2 fst
0.85
cr=
cr
Es
fy= Yield strength of bare bar
fy fy
(12y,,1.1 fy)
y y
fy= Yield strength of bar embedded
in concrete -fy
Es
fy= Yield strength of bare bar
fy fy
(12y,,1.1 fy)
y y
fy= Yield strength of bar embedded
[image:12.595.99.525.292.471.2](a) for PC specimen (b) for RC specimen
Fig. 21. FEM model.
4.2 Comparison between Test Results and Finite Element Analysis
The comparison of deformed shape for specimens PC and RC in the same drift ratio are shown in Figs. 22 and 23. The RC FEM model specimen seems to behave like cantilever beam embedded on footing. For the wall panel on compression side, the elements behave to shrink. The wall panel on tension side, the elements stretch. For the PC FEM model, the elements in the wall panel are still in square shape with less deformation. There are only the elements at the base of wall panel stretch more than other elements. It can be noted that the FEM model clearly explain precast concrete wall panel under lateral load according to the tested result as shown in Fig. 14. The cracks of the PC specimen model concentrated at the base of wall and around steel plate connection. For the RC specimen model the cracks are more distributed over the wall panel.
Fig. 22. Deform shape and crack pattern of PC
specimen. Fig. 23. Deform shape and crack pattern of RC specimen.
1 dimensional discrete joint element
Load direction Load direction
dimensional RC plate element
[image:13.595.96.511.517.709.2] [image:13.595.316.516.518.703.2]DOI:10.4186/ej.2018.22.2.185
When comparing the relationship between load and drift ratio as shown in Fig. 24, it was found that the FEM analysis could predict the wall behavior under cyclic loading similar to the test result. The summary results are shown in Table 2. The maximum load predicted by FEM is a little bit higher than the test result because FEM model has better restrain support foundation than that of the laboratory.
[image:14.595.83.505.147.352.2](a) PC specimen (b) RC specimen
Fig. 24. Comparison of lateral forced and drift ratio relationship.
Figure 25 shows principal compressive stress of both specimens. The compression force concentrated on the opposite side of the horizontal load direction at the bottom of wall while tension force also exhibited at the rest wall panel. The stress field pattern of the PC specimen is slightly different from the RC specimen. For the PC specimen, the compressive stress is concentrated and forming rectangular shape with higher stress than that of the RC specimen. The rectangular shape of stress concentration is due to the steel plate and dowel bar connection in the PC specimen. For the RC specimen, the concentrated compressive stress has lower value and spread out through foundation. It can be seen that the stress flow behavior of precast wall panel is similar to that of in-situ reinforced concrete wall panel. In application, the tensile and compressive force in precast wall panel connection has to be checked with allowable values, for safe use of precast wall panel under lateral load.
[image:14.595.156.439.525.738.2](a) PC specimen (b) RC specimen
Fig. 25. Stress field plot.
-50 -25 0 25 50
-1.5 -1.0 -0.5 0.0 0.5 1.0 1.5
S
to
ry
sh
ea
r
fo
rc
e
(k
N)
Drift ratio(%)
Experiment
FEM
-50 -25 0 25 50
-1.5 -1.0 -0.5 0.0 0.5 1.0 1.5
S
to
ry
sh
ea
r
fo
rc
e
(k
N)
Drift ratio(%)
Experiment FEM
MPa
Table 2. Summary results from the FEM analysis and the experimental results.
Analysis result RC Specimen Experimental result FEM analysis PC SpecimenExperimental result FEM analysis Yield load (kN) 30.0
at 0.45% 30.99 at 0.15% 25.1 at 0.14% 33.48 at 0.2% Maximum load (kN) 39.4
at 0.90% 44.1 at 1.35% 38.8 at 0.70% 40.6 at 0.95%
5.
Conclusions
From the study of precast concrete bearing wall panel applicable for 2-story house under reverse cyclic load, the conclusion can be drawn. The specimens are 3/4 scales and have the same reinforcement details as the real wall which is gravity load design. The connection detail is dowel bar welded to steel plate embedded in wall panel, which represent 2-story house load bearing wall in Thailand. The specimen was tested and compared with the in-situ reinforced concrete wall panel specimen. Tested result shown that, the maximum load is the same, 38.8 kN and 39.4 kN for precast and reinforced concrete wall specimen, respectively. The crack for precast specimen is concentrated around concrete cover steel plate connection while both side of flexural and shear crack in wall panel 500 mm above the footing occur in reinforcement specimen. Although precast connection is gravity load design, it can resist lateral load almost the same as reinforced concrete specimen. FEM analysis also shows according results and extracts the force flow in the wall panel. It can be implied that the tested connection of precast concrete bearing wall can be applied for low to moderate seismic region. For high seismic region, the connection has to be modified and more study for safely used.
References
[1] G. Kaewkulchai, S. Bhokha, and W. Puatatsananon, “Design guidelines of precast concrete load bearing walls: A case study of Oua Arthorn Project,” in The 12th National Convention on Civil Engineering,
STR059, Phitsanulok, 2007.
[2] S. Charuvisit and P. Samanrattanasatien, “High rise precast building in Thailand,” in The 17th National
Convention on Civil Engineering, STR016, Udonthani, 2012.
[3] S. Pampanin, M. J. N. Priestley, and S. Sritharan, “Analytical modelling of the seismic behaviour of
precast concrete frames designed with ductile connections,” Journal of Earthquake Engineering, vol. 5, no.
3, pp. 329–367, 2001.
[4] G. S. Cheok and H. S. Lew, “Performance of precast concrete beam-to-column connections subject
to cyclic loading,” PCI Journal, vol. 36, no. 3, pp. 56–67, 1991.
[5] H. H. Korkmaz and T. Tankut, “Performance of a precast concrete beam-to-beam connection subject
to reversed cyclic loading,” Engineering Structure, vol. 27, no. 9, pp. 1392–1407, 2005.
[6] O. Ertas, S. Ozden, and T. Ozturan, “Ductile connections in precast concrete moment resisting
frames,” PCI Journal, vol. 51, no. 3, pp. 2–12, 2006.
[7] C. Hansapinyo, C. Buachart, and P. Wongmatar “Cyclic performance of precast concrete columns using steel box connection,” International Journal of Civil Engineeing, vol. 15, no. 4, pp. 663-676, 2017.
[8] A. S. Khaled, S. H. Rizkalla, and R. W. Daikiw, “Horizontal connections for precast concrete shear
walls subjected to cyclic deformations, Part 2: Prestressed connections,” PCI Journal, vol. 40, no. 5, pp.
82-96, Sep.-Oct. 1995.
[9] C. Bora, M. G. Oliva, S. D. Nakaki, and R. Becker, “Development of a precast concrete shear-wall
system requiring special code acceptance,” PCI Journal, vol. 52, no. 1, pp. 122-135, Jan.-Feb. 2007.
[10] A. E. Schultz, M. K. Tadros, X. M. Huo, and R. A. Magana, “Seismic resistance of vertical joints in precast shear walls,” in Proceedings of the 12th Congress, Federation Internationale de la Precontrainte
(FIP), 1994, vol. 1.
[11] N. M. Hawkins and S. K. Ghosh, “Acceptance criteria for special precast concrete structural walls
DOI:10.4186/ej.2018.22.2.185
[12] J. Adajar and T. Yamaguchi, “New connection method for precast shear wall,” in Eleventh World Conference on Earthquake Engineering, Elsevier Science, 1996, paper no. 590.
[13] Design Recommendations for Precast Concrete Structures (ACI550R-96), ACI-ASCE Committee 550,
American Concrete Institute, Farmington Hills, Mich. USA, 2001.
[14] Precast/Prestressed Concrete Institute, PCI Design Handbook, 6th ed. Chicago, Illinois, USA, 2004. [15] F. J. Crisafulli, J. I. Restrepo, and R. Park, “Seismic design of lightly reinforced precast concrete
rectangular wall panels,” PCI Journal, vol. 47, no. 4, pp. 104-122, Jul.-Aug. 2002.
[16] Acceptance Criteria for Moment Frames Based on Structural Testing (ACI T1.1-01), ACI Innovation Task
Group1 and Collaborators, American Concrete Institute, Farmington Hills, Michigan, 2001.
[17] M. Seckin and H. C. Fu, “Beam–column connections in precast reinforced concrete construction,”
ACI Structural Journal, vol. 87, no. 3, pp. 252–61, 1990.
[18] The Concrete Design Committee P3101, “New Zealand Standard; Concrete Structures Standard; part 1,” in The Design of Concrete Structures (NZS3101). Wellington: Standard New Zealand, 2006.
[19] WCOMD, Users Guide for WCOMD-SJ. Concrete Engineering Laboratory, Department of civil Engineering, University of Tokyo, 1998.
[20] H. Okamura and K. Maekawa, Nonlinear Analysis and Constitutive Models of Reinforced Concrete. Tokyo: Gihodo-Shuppan, 1991.
![Fig. 3. Connection between upper and lower floor from ACI-550.1R [13]. Fig. 4 Connection between upper and lower floor from PCI [14]](https://thumb-us.123doks.com/thumbv2/123dok_us/8107321.235432/3.595.106.505.87.204/connection-upper-lower-floor-connection-upper-lower-floor.webp)
![Fig. 17. Shear resisting mechanisms at joint between a wall panel and foundation [15]](https://thumb-us.123doks.com/thumbv2/123dok_us/8107321.235432/10.595.213.383.456.627/fig-shear-resisting-mechanisms-joint-wall-panel-foundation.webp)