Article
Experimental Investigation of the Effect of Adding
LECA and Pumice on Some Physical Properties of
Porous Concrete
Hojat Karami
a,*, Ehsan Teymouri
b, Sayed-Farhad Mousavi
c, and Saeed Farzin
dFaculty of Civil Engineering, Semnan University, Semnan, Iran
E-mail: ahkarami@semnan.ac.ir, (Corresponding author), bteymuri.e91@gmail.com, cfmousavi@semnan.ac.ir, dsaeed.farzin@semnan.ac.ir
Abstract. Porous concrete has high porosity and can be used for increasing the permeability
of pavements and parking lots and reducing the urban runoff damages. In this research, light expanded clay aggregate (LECA) and pumice were substituted for 5, 10 and 15% of course aggregates in porous concrete cubes and their effects on the compressive strength (σ), hydraulic conductivity (K) and porosity (n) were investigated. Moreover, effect of adding 10% and 20% of fine grains (as filler) is studied, too. Results showed that fine grains increased σ and decreased K and n. But, samples without any fine grains didn’t have regular trend. The use of additives up to a certain amount reduced the σ, and then, because of filling the pores, increased the σ. The applied additives had almost the same performance in terms of σ; but in terms of permeability and porosity, the samples containing pumice had a better performance.
Keywords: Additives, compressive strength, hydraulic conductivity, pervious concrete, porosity.
ENGINEERING JOURNAL Volume 22 Issue 1
1.
Introduction
Imperviousness of urban streets and pavements has led to many problems, such as water flooding in the event of rainfall, which in turn can cause difficulty for pedestrian traffic and even cars [1]. Considering the possibility of using urban surface runoff for recharge of groundwater aquifers and maintaining the ecological balance in the urban areas, nowadays, porous pavement technique in urban streets has particular importance in different countries because this method can be effective in improving the quality of the water which penetrates the subsoil layers, and removing part of the pollutants in the runoff water [2], [3].
Porous concrete is a mixture of Portland cement, coarse-grained particles, little or no fines, additives, and water. Because of the low amount of fine particles in the porous concrete, its structure consists of interconnected pores, which allow quick passage of water [4]. Porosity of this type of concrete is variable, ranging from 15 to 25 percent [5]. Porous concrete has many benefits in terms of environmental issues. This type of concrete is mostly used in areas with heavy rainfall, in the airports, parking lots, patios, roads with light traffic, as well as draining base layers of roads and hydraulic structures [6], [7].
The ability of porous concrete to decrease the quantity and increase the quality of storm runoff in urban environments has been used in different applications (e.g., pavements). Porous concrete can highly decrease volume of storm runoff through direct infiltration and can enhance the quality of runoff through decreasing the concentration of heavy metals (e.g., lead, zinc, chromium and copper), which are usually found in urban and roads' storm runoff [8].
Hariyadi and Tamai (2015) investigated the effect of substitution of aggregates by pumice in porous concrete. Results showed that using pumice in porous concrete increased porosity and decreased modulus of elasticity, and tensile strength was more than ACI standard [9].
Over the last decades, researchers have used different adsorbent materials to reduce the existing surface-water pollution. These adsorbents include bark of eucalyptus tree [10], pumice [11], rice hulls [12], zeolite [13], and LECA [14]. Paliulis (2016) used modified and natural zeolite in order to adsorb formaldehyde in the wastewater. Formaldehyde adsorption was monitored for different times, and the positive effect of modified zeolite (in the range of 5.4 to 24 percent, with an average of 9.2%) for removing formaldehyde was achieved [13].
Subramanian et al. (2008) used pumice, covered by titanium dioxide, in order to remove the existing bacteria in river water. Results showed that elimination of pathogens by this specific type of reactor is a suitable and useful method for purification of drinking water and wastewater [11].
Jiang et al. (2015) investigated the effect of porous asphalt pavement on quality parameters of the runoff. Results showed that porous asphalt pavement has significant effect on reducing heavy metals and organic materials of the runoff [15].
Huang et al. (2016) examined and compared storm runoff reduction, surface infiltration capacity, and removal of several pollutants by permeable interlocking pavers, porous asphalt, and porous concrete under cold climate conditions. Results showed that these are all effective in mitigating storm runoff [16]. Gang et al. (2016) developed and evaluated an in situ treatment technique to remove heavy metals from highway runoff. In this experiment, they used bentonite, zeolite, silica, and fly ash as adsorbent. Results showed that bentonite, zeolite and fly ash have moderate to high adsorption capacity for copper and zinc removal from highway runoff [17].
Since using porous concrete is considered as a new step in alleviating the problems of urban runoff, in this research, LECA and pumice were added to concrete, to improve the physical properties of the porous concrete. These improved properties could help to alleviate pollution problems of urban runoff.
2.
Materials and Methods
2.1. Material
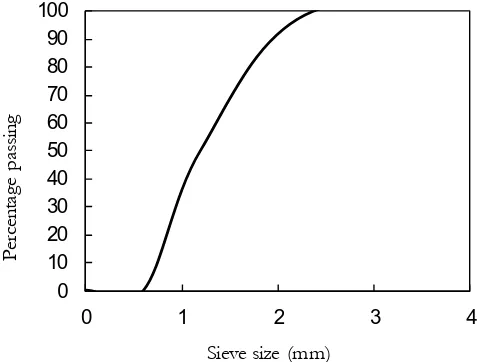
was 4-9.5 mm, and the additives were 0.6-1.2 mm. Effects of every additive on compressive strength, hydraulic conductivity, and porosity of the porous concrete cubes were investigated.
Grading curves of the aggregates and additives are shown in “Fig. 1” and “Fig. 2,” respectively.
Fig. 1. Granulometric curve of the aggregates used in the mixing designs.
Fig. 2. Granulometric curve of the additives used in the mixing designs.
2.2. Concrete Mixture
To make ordinary porous-concrete samples, a preliminary mixture design, according to Standard ACI 211/3R, was considered [18]. The amount of aggregates and cement was 1400 and 330 kg/m3, respectively, and the ratio of water to cement for all the samples was constant and equal to 0.38. To investigate the effect of adding fine grains on physical characteristics (σ, K, n) of the samples, 10 and 20 percent of fine grains were added to coarse aggregates. After preparing the samples, because sulfate-resistant cement (Type 5) was used, the samples were cured for 42 days in water. Details of the experimental treatments are shown in Table 1. Each treatment consisted of three replications.
0 10 20 30 40 50 60 70 80 90 100
1.5 2.5 3.5 4.5 5.5
Pe
rc
en
ta
ge
p
as
sin
g
Sieve size (mm)
0 10 20 30 40 50 60 70 80 90 100
0 1 2 3 4
Pe
rc
en
ta
ge
p
as
sin
g
[image:3.595.183.412.124.306.2] [image:3.595.178.418.357.538.2]Table 1. Components of cement, water, additives and fine grains in different treatments.
Treatment Additive (%) Water/Cement Fine-grains (kg/m3)
C-0-0 0 0.38 0
Pu5-0* 5 0.38 0
Pu10-0 10 0.38 0
Pu15-0 15 0.38 0
L5-0 5 0.38 0
L10-0 10 0.38 0
L15-0 15 0.38 0
C-0-10 0 0.38 140
Pu5-10 5 0.38 140
Pu10-10 10 0.38 140
Pu15-10 15 0.38 140
L5-10 5 0.38 140
L10-10 10 0.38 140
L15-10 15 0.38 140
C-0-20 0 0.38 280
Pu5-20 5 0.38 280
Pu10-20 10 0.38 280
Pu15-20 15 0.38 280
L5-20 5 0.38 280
L10-20 10 0.38 280
L15-20 15 0.38 280
C= control, Pu= pumice, L= LECA *: Pu5-0= 5% pumice + 0% fine grains
2.3. Procedure
Porosity of each sample was calculated according to ASTM C1754 standard [19]. Dry weight of each sample was measured after drying it for 24 hours in the 105 °C oven. Next, the sample was submerged in a 20 °C water container for 30 minutes. It was tried to empty the inner air of the container by tapping its walls, and then the submerged weight of the sample was measured by using an Archimedes scale. Porosity was calculated by Eq. (1):
(1) 100
)] 1 2 ( 1
[
V w
W W t
A
where, At is porosity (%), W2 is oven-dried weight (gr), W1 is submerged weight (gr), V is total volume of the
sample (cm3), and w
is density of water (g/cm3).
[image:4.595.160.439.109.446.2]where, K is coefficient of permeability (mm/sec), a is area of the graduated section above the sample (mm2),
L is sample length (mm), A is cross-sectional area of the concrete sample (mm2), h1 is initial height of water column (mm), h2 is final height of water column (mm) and t is time (sec) required to get head drop from h1
to h2.
Fig. 3. Hydraulic conductivity apparatus (left: front view; middle: top view) and a sealed sample (right).
In order to calculate the compressive strength after 42 days of curing the samples, a mechanical unit in the Structure Laboratory of Semnan University, with a capacity of 3000 KN, was used. The porous concrete samples for this test had dimensions of 15×15×15 cm, which was in accordance with standard BS 1881 [20]. The experimental design was completely randomized blocks. Statistical analysis of the results was performed by SAS9.4 software. Means were compared by LSD test at 5% probability level.
3.
Results and Discussion
In Tables 2 to 4, results of statistical analysis for compressive strength, coefficient of permeability, and porosity are presented.
Table 2. Results of analysis of variance of compressive strength in different treatments of porous concrete.
Source
DF
squares
Sum of
square
Mean
F value
Pr>F
Coefficient
of
variation
R2
Treatment
20
1801.394
90.0697
35.44**
<0.0001
6.529
0.947
Block
2
28.442
14.221
5.60**
0.0072
Error
40
101.648
2.541
- -Total
62
1931.485 -
- - [image:5.595.102.473.139.343.2] [image:5.595.70.522.554.651.2]Table 3. Results of analysis of variance of permeability coefficient in different treatments of porous concrete.
Source
DF
squares
Sum of
square
Mean
F value
Pr>F
Coefficient
of
variation
R2
Treatment
20
2.389
0.119
295.32**
<0.0001
1.607
0.993
Block
2
0.000885
0.000442
1.09**
0.3444
Error
40
0.0161
0.000404 -
-Total
62
2.406
- - -** Significant at 1% level.
Table 4. Results of analysis of variance of porosity in different treatments of porous concrete.
Source
DF
squares
Sum of
square
Mean
F value
Pr>F
Coefficient
of
variation
R2
Treatment
20
2412.125 120.606
85.14**
<0.0001
9.022
0.977
Block
2
2.91
1.455
1.03**
0.3673
Error
40
56.664
1.416
- -Total
62
2471.7
- - -** Significant at 1% level.
As Tables 2-4 show, the coefficient of determination (R2) for these experiments is more than 0.94, and effect of treatments on three parameters of permeability, compressive strength and porosity is statistically significant (P≤0.01). Table 5 shows the mean values of the tested parameters.
According to Table 5, generally, porous concrete samples having similar percent of additives are significantly different. This suggests that percentage of the additive is more important than the type of additive.
The range of compressive strength for this experiment was 16.7-31.46 MPa. Maximum compressive strength (31.46 MPa) belongs to L15-20 treatment and minimum compressive strength (16.7 MPa) belongs to L15-0 treatment. The range of porosity for this experiment was 4.37-23.1 percent. Maximum porosity (23.1%) belongs to L5-0 treatment and minimum porosity (4.37%) belongs to L15-20 treatment. It is seen that maximum compressive strength corresponds to minimum porosity.
Table 6 shows average values of compressive strength, permeability and porosity of samples and also represents the differences between samples with additives and control. Adding fine grains to porous blocks decreased porosity and coefficient of permeability, and increased the compressive strength. These results are in accordance with what Jiang et al. (2015) found in their research [15]. In samples with no fine grains, and pumice additive, the compressive strength is increased by addition of the additive. For LECA additive, a uniform trend was not seen; in sample L10-0, the compressive strength is larger than L5-0 and L15-0 samples. In Table 5, for LECA samples, porosity of L10-0 (17.50%) is less than L5-0 (23.10%) and L15-0 (19.92%). Therefore, compression of L10-0 sample is more than the other two samples. Thus, its compressive strength is higher than L5-0 and L15-0 samples.
[image:6.595.70.512.106.201.2] [image:6.595.70.503.257.353.2]many pores in porous concrete which are independent and have no connection with each other. So, they increase the porosity, but have no effect on coefficient of permeability.
Table 5. Comparison of average compressive strength, permeability, and porosity values in different treatments containing various percentages of additives and fine-grains.
Sample code strength (MPa) Compressive conductivity Hydraulic
(mm/s) Porosity (%)
C-0-0 17.55h 1.517a 20.96bc
Pu5-0 18.93gh 1.457bc 20.25c
Pu10-0 18.62gh 1.497a 19.06cd
Pu15-0 17.88gh 1.427cd 19.88cd
L5-0 17.03h 1.487ab 23.10a
L10-0 20.50fg 1.470ab 17.50de
L15-0 16.70h 1.400de 19.92cd
C-0-10 23.68de 1.397de 16.96e
Pu5-10 23.16de 1.340f 14.21f
Pu10-10 24.91cd 1.243g 10.99gh
Pu15-10 25.63cd 1.200h 7.98j
L5-10 22.56ef 1.370ef 12.94fg
L10-10 25.27cd 1.153i 9.21hij
L15-10 26.37c 1.107j 8.09j
C-0-20 30.73b 1.183hi 11.03hij
Pu5-20 27.29c 1.047k 10.17hi
Pu10-20 30.95b 1.003lm 8.20k
Pu15-20 31.32b 0.997mn 7.56ij
L5-20 27.32c 1.023kl 9.19hij
L10-20 30.96a 1.007lm 5.60k
L15-20 31.46b 0.957n 4.37k
In each column, means followed by at least one common letter are not significantly different at 5% level.
4.
Conclusion
In the present study, effects of adding LECA, pumice and fine-grains to porous-concrete blocks were investigated on compressive strength, permeability coefficient, and porosity. Results showed that in samples with no fine particles, by increasing the additive percentage, generally, the compressive strength was reduced. In samples containing 10% and 20% fine-grains, with addition of additive, compressive strength was increased, which was due to the filling of the pores by the additives. The important conclusions drawn from this research are summarized as follows:
a) Statistically, it was observed that percentage of additive is more effective in changing the compressive strength, coefficient of permeability and porosity, than type of the additive.
b) Using fine-grained additives, up to a certain amount, although fills the pores of the porous concrete blocks, but reduces the compressive strength. After this low level, the compressive strength is increased. c) However, adding additives and fine grains reduces porosity percentage and coefficient of permeability. d) LECA affected compressive strength of porous blocks less than pumice.
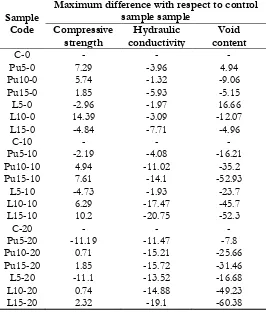
[image:7.595.132.465.153.453.2]Table 6. Maximum difference of compressive strength, hydraulic conductivity and void content of porous concrete samples with respect to control.
Sample Code
Maximum difference with respect to control sample sample
Compressive
strength conductivity Hydraulic content Void
C-0 - - -
Pu5-0 7.29 -3.96 4.94
Pu10-0 5.74 -1.32 -9.06
Pu15-0 1.85 -5.93 -5.15
L5-0 -2.96 -1.97 16.66
L10-0 14.39 -3.09 -12.07
L15-0 -4.84 -7.71 -4.96
C-10 - - -
Pu5-10 -2.19 -4.08 -16.21
Pu10-10 4.94 -11.02 -35.2
Pu15-10 7.61 -14.1 -52.93
L5-10 -4.73 -1.93 -23.7
L10-10 6.29 -17.47 -45.7
L15-10 10.2 -20.75 -52.3
C-20 - - -
Pu5-20 -11.19 -11.47 -7.8
Pu10-20 0.71 -15.21 -25.66
Pu15-20 1.85 -15.72 -31.46
L5-20 -11.1 -13.52 -16.68
L10-20 0.74 -14.88 -49.23
L15-20 2.32 -19.1 -60.38
Acknowledgement
The authors would like to thank Semnan University and Research Center for Urban and Rural Planning, Iranian Municipalities and Rural Management Organization for their support of this research.
References
[1] M. Wanielista, M. Chopra, J. Spence, and C. Ballock, “Hydraulic performance assessment of pervious concrete pavements for stormwater management credit,” Final Report, Univ. of Central Florida, Orlando, FL, 2007.
[2] P. J. Ramadhansyah, M. Y. Mohd Ibrahim, H. Mohd Rosli, M. N. M. Warid, and M. H. Wan Ibrahim, “Porous concrete pavement containing nano-silica: Pre-review,” Adv. Mater. Res., vol. 911, pp. 454-458, 2014.
[3] P. Tennis, “Pervious concrete pavement,” Portland Cement Assoc., Skokie, IL, 2004.
[4] K. Ćosić, L. Korat, V. Ducman, and I. Netinger, “Influence of aggregate type and size on properties of pervious concrete,” Constr. Build. Mater., vol. 78, pp. 69-76, 2015.
[5] ACI Committee 522, “Pervious concrete,” ACI 522R-06 Report, 2006.
[6] P. A. Harrisburg, The Pennsylvania Handbook of Best Management Practices for Developing Areas. Pennsylvania Department of Environmental Protection, 1998.
[image:8.595.165.431.119.431.2][10] V. Strain and K. K. Pant, “Removal of chromium from industrial waste by using eucalyptus bark,”
Bioresour. Technol., vol. 97, pp. 15-20, 2005.
[11] M. Subrahmanyam, P. Boule, V. D. Kumari, D. N. Kumar, M. Sancelme, and A. Rachel, “Pumice stone supported titanium dioxide for removal of pathogen in drinking water and recalcitrant in wastewater,”
Solar Energy, vol. 82, pp. 1099-1106, 2008.
[12] R. Rostamian, M. Heidarpour, S. F. Mousavi, and M. Afyuni, “Preparation, characterization and sodium sorption capability of rice husk carbonaceous adsorbents,” Fresenius Environ. Bull., vol. 24, no. 5, pp. 1649-1658, 2015.
[13] D. Paliulis, “Removal of formaldehyde from synthetic wastewater using natural and modified zeolites,”
Pol. J. Environ. Stud., vol. 25, no. 1, pp. 251-257, 2016.
[14] A. Rastegar, B. Anvaripour, and N. Jaafarzadeh, “Application of modified LECA in removing nickel from wastewater,” Iran. J. Oil and Gas Sci. Technol., vol. 5, pp. 1-12, 2016.
[15] W. Jiang, A. Sha, J. Xiao, Y. Li, and Y. Huang, “Experimental study on filtration effect and mechanism of pavement runoff in permeable asphalt pavement,” Constr. Build. Mater., vol. 100, pp. 102-110, 2015. [16] J. Huang, C. Valeo, J. He, and A. Chu, “Three types of permeable pavements in cold climates: Hydraulic
and environmental performance,” J. Environ. Eng., vol. 142, no. 6, p. 04016025, 2016.
[17] D. D. Gang, M. J. Khattak, I. U. Ahmed, and H. R. Rizvi, “Highway runoff in situ treatment: Copper and zinc removal through MOGFC,” ASCE, J. Environ. Eng., p. 04016087, 2016.
[18] Guide for Selecting Proportions for No-slump Concrete, ACI 211.3R Report, ACI Committee 211, 2006.
[19] Standard Test Method for Density and Void Content of Hardened Pervious Concrete, ASTM C1754/C1754M-12,
ASTM International, USA, 2012.
[20] Method for Making Test Cubes from Fresh Concrete, BS 1881, Part 108, British Standard, Testing Concrete,