Article
Simulation Techniques for Determining Numbers of
Programmers in the Process of Software Testing
Adtha Lawanna
Department of Information Technology, Faculty of Science and Technology, Assumption University, Bangkok, Thailand
E-mail: [email protected]
Abstract. One of the main problems in software engineering is to determine the appropriate numbers of programmer working through the software-development life cycle, particularly in the process of coding, testing, and maintenance. The high numbers of the programmer increase the cost of developing software. However, the small teams cause another problem, especially in the process of testing software. Therefore, this article presents the simulation technique for the development team in order to determine the appropriate numbers of programmers, whereas the testing time is specified by the users. Firstly, the relationship among programmers, codes, and testing time are constructed and studied. Secondly, it is the application based simulation technique for determining the suitable numbers of programmers by running 20, 50, 100, and 200 experiments. Lastly, the proposed model interprets the percent errors for the different programs. The contribution is to manage and reduce the cost of developing program and increase the accuracy of testing software by improving the percent errors.
Keywords: Software-development life cycle, software testing, software maintenance, programmers, code, bugs.
ENGINEERING JOURNAL
Received 1 April 2013 Accepted 8 August 2013 Published 18 April 2014
1.
Introduction
Software engineering is one of the fields of information technology, which are being focused for both academics and industries [1]. The explosive influence of information technology and computers on our normal lives has produced a requirement to plan and improve new software systems as well as to combine the appropriate technologies into a quickly rising range of applications [2]. The jobs accomplished by specialists known as software engineers evolve rapidly, imitating new spaces of knowledge or movement of technology, and the inclinations and practices of workers [3]. Software engineers relate the philosophies and methods of information science, engineering, and precise analysis to the project, improvement, testing, and estimation of the software system [4-8]. In addition, it allows computers to achieve their numerous applications. The following is the examples of employers in the computer software engineers [9]:
Technology Intensive Firms: Apple Computer, AT&T, Cisco Systems, Dell, Fujitsu Siemens Computers, Google, Hewlett-Packard, IBM, Intel, Iomega, Microsoft, Motorola, Oracle, Panasonic, PeopleSoft (Oracle), Raytheon Company, Sony Electronics, Sun Microsystems, Texas Instruments, Toshiba, Verizon, and Yahoo.
U.S. Federal Government and State and Local Affiliates: Federal Bureau of Investigation, Federal Emergency Management , Agency, NASA, National Institute of Standards and Technology, US Air Force, US Army, US Central Intelligence Agency , US Department of Energy, US Department of Defense, US Department of Transportation, US Naval Research Lab, and US Navy.
Other Firms: 3M Worldwide, Adelphia Communications, ADT, Advanced Micro Systems, Alcatel, Alcoa, Ansys, Applied Digital, Blackberry , BMW International, Boeing, Delphi-Packard Electric, Toyota Motor Sales, USA, Inc., Federal Express, Ford, Genentech, General Dynamics, General Electric, General Motors Corporation, Honda, Honeywell, Hughes Network Systems, Johnson & Johnson, Lockheed Martin, Meade Instruments Corporation, Merrill Lynch & Co., New Piper Aircraft, Nuance Communications, Inc., Procter & Gamble Company, Samsung, Siemens Automotive Corporation, Toyota Motor Sales, Inc., UPS, and Westinghouse.
Other Employers: Colleges and Universities, K-12 Schools, Professional Associations, Temporary Firms, and Consultants.
Basically, Software-development life cycle (SDLC) is being applied in the software engineering. SDLC refers to six phases of developing software and the instruction in which those phases are accomplished. Each phase creates deliverable outcomes that are required by the next phase in the cycle [10-12]. All requirements are converted into the plan. Program is created relying on the plan which is named development phase. After programming and development, the testing proves the deliverable of the implementation phase match all requirements [13-15]. Figure 1 describes the following six phases SDLC:
Phase 1: Getting requirements. This phase, the business requirements are collected. This phase is one of the main elements of the project management and users. Meetings with managers, users, and stake holders are held for determining the requirements, e.g., who is going to use the software? How will they use the software? What information should feed into the system? What information should be outcomes from the system? Here, the general questions will be answered during this phase. After this, these requirements will be analyzed for their cogency and the possibility of integrating the requirements in the system. Finally, a Requirement Specification file is produced, which helps the determination of instruction for the next phase of the SDLC.
Phase 2: Design. In this phase, the software system is organized from the requirement specifications of phase 1, which were studied. According to this, system design supports in identifying hardware and software requirements, including aims in describing the entire system architecture.
Phase 3: Coding. After receiving system design from phase 2, the code is divided into modules or units, and actual programming is started.Since, in this phase the program is created, therefore, it is the main jobs for the programmer. This spends the longest phase of the SDLC.
Phase 4: Testing. After that the software is tested due to the requirements from phase 1 to ensure that the product is actually matching the requests listed and documented. During this phase unit, module, integration, team, system, and acceptance testing are completed.
Phase 5: Deployment. After completely testing the software is deployed and delivered to the users for their jobs.
Getting requirement
Design
Coding
Testing
Deployment
Maintenance
Fig. 1. Six phases of SDLC [13].
Research questions, there are many problems can be occurred in each phase, but in this paper, it focuses two main drawbacks remained in the software maintenance. The first, how many programmers are suitable in the process of maintenance whereas the overnight is requested? Actually, people involve for all phases of SDLC. This paper concerns the process of software maintenance. The second, how many bugs will be occurred? The reasons that fail the software are not only the new bugs or faults, but it includes the requirement specifications from managers, users, stake holders, and the lines of code. Therefore, the objective of the article is to determine the appropriate numbers of programmers whereas the changes from requirement specification, lines of code, and bugs are being occurred. Another is to define the possibility of bugs, which can be occurred in the process of software maintenance. Finally, the article presents two contributions. First, simulation technique can be used for predicting the suitable numbers of programmers for each developed coding. Second, the proposed model can aim to prepare the plan to fixing bugs or faults overnight with the significant resources, e.g., the appropriate numbers of programmers.
2.
Materials and Methods
2.1. Subject Programs
[image:3.595.138.459.88.273.2]programs, the scattered bugs within the programs give model real-world errors. The subjects have also been applied previously in many studies [20].
Table 1. The subject program from Siemen.
Name Function Lines of Code Bugs Test Pool
Print-tokens 18 402 7 4,130
Print-okens2 19 483 10 4,115
Replace 21 516 32 5,542
Schedule 18 299 9 2,650
Schedule2 16 297 10 2,710
Tcas 9 148 41 1,608
Totinfo 7 346 23 1,052
2.2. Methods
The important of the proposed method are explained as follows; regarding to the concept of testing software, the high number of programmers are expensive and costly. Therefore, this article presents the methods of finding the suitable number of programmers. However, the performance of them will not be accountable. So far the bias of thinking will be protected. Simulation technique concerns mathematical model to avoid the errors of using irrelevant or subjective factors such as quality of programmers, skill, and knowledge. Simulation technique provides different running experiments, which are 20, 50, 100, and 200 rounds respectively. This can guarantee that the effective results can be usable and suitable. Therefore, the algorithm of the proposed method is shown as follows:
Step 1: Determine the relationship between numbers of programmers (P), testing time (T), and codes (C).
Number of programmer is directed to code: PC
Number of programmer is in-directed to testing time:
1
P T
C P c
T (1)
where c refers to constant value.
In the experiment, random function is used for numbers of programmers, testing time, and codes. The random numbers are 1-100, 1-24, and 148-156 respectively. To ensure the validity of the results, the experiment will hold at least 20 times.
Step 2: Define the value of c.
Using the results of “Step 1”, the value of c can be determined as shown in equation.
C PT
c (2)
In the experiment, the value c can be generated as finding median, average, and minimum values.
Step 3: Build a model from “Step 2”. Testing the results is required to ensure that step 1 and 2 are working.
Step 4: Prepare simulation. This step can be used to determine numbers of programmers while 20 experiments are required.
Step 5: Determine the relationship between bugs (B) and Functions (F). Number of bug is directed to function:BF. Therefore:
dF
B (3)
where d refers to constant value, which is shown in equation:
F B
d (4)
2.3. Regression Test Selection (RTS)
A novel RTS technique considers ontology driven systems [21]. This technique shows representations of the old and new ontologies, compares them to find entities affected by the changes. The algorithms are applied for number of programmers, testing time, and codes used in the process of testing software. Three steps of RTS are shown as follows:
Step 1: Compute number of test cases due to the different codes. Step 2: Specify testing time
Step 3: Identify the number of programmers.
Note that this RTS is a new technique (2012) and it will be used in the part of evaluation as one of the comparative studies.
3.
Results and Discussions
3.1. Determining Numbers of Programmers, Testing Time, and Code
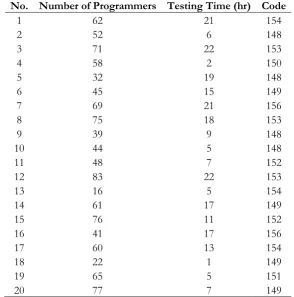
This article does not focus unequal performance of programmers, e.g., programming skill, knowledge, and experience. Specifically, one of the purposes is to find the appropriate numbers of programmers who can finish testing codes within the limited times. In general, the testing time may cause time delay of the development team. In some case, the developers spent long time (months) to test the software. According to the purpose of this research, testing times are varied from 1 to 24 hours (overnight) regarding the requirement specification by the users. This assumption is considered for planning and preparing the programmers, which are suitable in the process of testing codes. Codes approximately are 150 lines in order to avoid the complexity of fixing errors such as bugs. Of course, each program consist difference lines of code depending on the types of software and the business objectives, which are not discussed in this article. Running experiments, Table 2 is the example of the results by running experiments 20 rounds to find the value of numbers of programmer, testing time, and codes. In this section, 20, 50, 100, 200 rounds of running experiments are used to analyze the results as shown in Table 3. It shows the provenance of the range of the number of programmers, testing time, and codes. All values will be applied to find median, average, and minimum as the representative of c for the next step. From the results, it shows that sometimes the lower numbers of programmers can finish the testing codes within the less time. This may be because of their abilities and experiences. Therefore, it assumes that the performances of testers are equal.
3.2. Determining the Value of c.
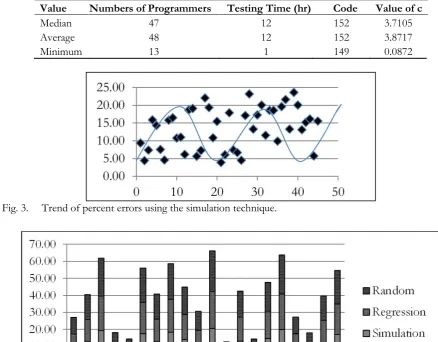
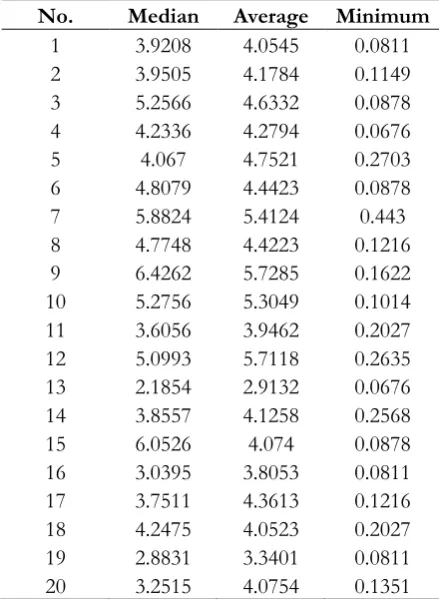
According to the results in Table 2, they are used to find the c-value. The values of c are computed based on median, average, and minimum as shown in Table 4. Each time of doing experiments, the c-values will be recorded differently. Therefore, Fig. 2 is inserted, which shows three observations explained as follows: first is the value of c based on minimum. The c-value is too low to find the representative. Particularly, it is not significant to use these results because the skills and experiences of the testers are very high expectation. That’s why; the numbers of programmers will depend on the code. However, another limitation is the quality and complexities of codes are assumed equally. Therefore, this technique may not guarantee the software testing can be done overnight. Second is the value of c based on median. The values of median as the representatives were plotted. The graph of Fig. 2 guides us to find the representative of c-value. It is not linear, exponential, or regression. Therefore, to avoid the bias is to select the middle value in order to get the c-value. Third is the value of c based on average. Fig. 2 shows the c-values from finding the average. As we can see that those results similar to the results computed by median. However, the problem is to find the right c. And the last one is analyzing the value between median and average. The value of c
Table 2. Determining numbers of programmers, testing time, and codes at twenty times.
No. Number of Programmers Testing Time (hr) Code
1 62 21 154
2 52 6 148
3 71 22 153
4 58 2 150
5 32 19 148
6 45 15 149
7 69 21 156
8 75 18 153
9 39 9 148
10 44 5 148
11 48 7 152
12 83 22 153
13 16 5 154
14 61 17 149
15 76 11 152
16 41 17 156
17 60 13 154
18 22 1 149
19 65 5 151
20 77 7 149
Table 3. The results of running experiments 20, 50, 100, and 200 rounds.
Rounds Number of Programmers Testing Time (hr) Code
20 22-83 1-22 148-156
50 20-92 1-22 152-159
100 23-93 1-20 149-161
200 22-84 1-24 147-158
Note: the results of running different rounds are closed to each. Therefore, the running 20 rounds are selected for the next studies.
Fig. 2. The c-value.
3.3. Simulation of Determining the Appropriate Number of Programmer
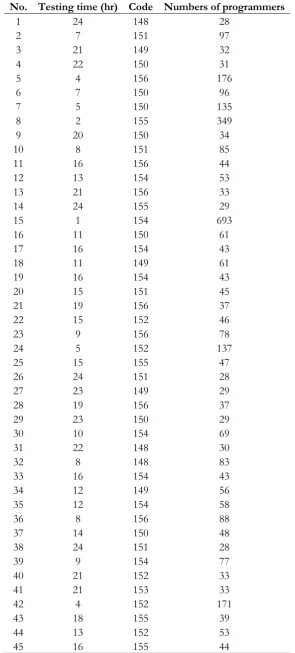
[image:6.595.80.481.530.707.2]requires 24 hours to test 148 lines of codes, then it requires 28 programmers to finish the jobs. Another example, if users need only one hour to test 156 codes, then it may request very high numbers of programmers. From doing experiment, the approximate number of programmers is 693.
Table 4. Example of finding the value of c.
Value Numbers of Programmers Testing Time (hr) Code Value of c
Median 47 12 152 3.7105
Average 48 12 152 3.8717
Minimum 13 1 149 0.0872
Fig. 3. Trend of percent errors using the simulation technique.
Fig. 4. Percent errors.
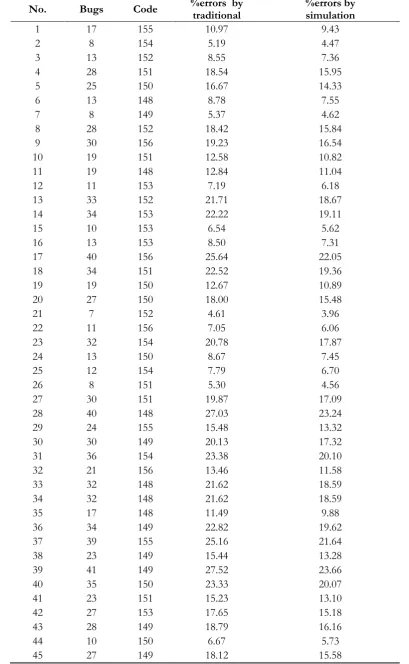
3.4. Determining Percent Errors
Table 7 reports percent errors within the testing program. The third column shows error during 45 rounds of the experiments. Moreover, column four gives the lesser percent errors, which lower than values from column three. The reason is that the results of column three are not related to the numbers of programmers. The results in column four, according to the similar methods start from Step 1 to 5, they can be applied to find the values of d, which refers to the percent error for each test.
Furthermore, Fig. 3 is the graph of using percent errors by simulation technique versus numbers of testing programs. The results show that the percent errors are moving up and down between 5 and 20. This means the estimated numbers of programmers can reduce the percent errors (see the results between column 3 and 4)
4.
Evaluation
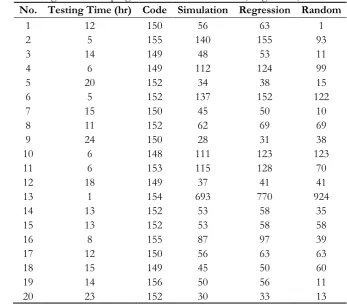
[image:7.595.66.505.142.484.2] [image:7.595.77.513.375.551.2]experiment number 1, the testing time is requested for 12 hours. The result of random technique requires only one programmer to test the software. This is not practical while simulation and regression need 56 and 63 programmers, which are suitable to possibly to reach the goal. Besides this, in experiment number 10 and 11 request six hours to finish the jobs, the results from using the random technique suggests 123 or 70 programmers. According to this, the random technique has no plan to manage the jobs consistently while the results of applying simulation and regression techniques give the similar suggestion. As we can see the results in Table 8, all number of programmers from simulation is less than regression. This interprets that the cost of testing software by using simulation is also less than the regression technique. Fig. 4 compares percent errors of the various techniques. It shows that the random technique cannot guarantee the errors during testing software. Even so, the simulation technique gives the lower errors than the traditional techniques. This supports the idea of finding the appropriate numbers of programmers by using the simulation technique, which can suggest the lower numbers of them while the percent errors are preserved.
Table 5. Results of twenty runs to find all c-value.
No. Median Average Minimum
1 3.9208 4.0545 0.0811
2 3.9505 4.1784 0.1149
3 5.2566 4.6332 0.0878
4 4.2336 4.2794 0.0676
5 4.067 4.7521 0.2703
6 4.8079 4.4423 0.0878
7 5.8824 5.4124 0.443
8 4.7748 4.4223 0.1216
9 6.4262 5.7285 0.1622
10 5.2756 5.3049 0.1014
11 3.6056 3.9462 0.2027
12 5.0993 5.7118 0.2635
13 2.1854 2.9132 0.0676
14 3.8557 4.1258 0.2568
15 6.0526 4.074 0.0878
16 3.0395 3.8053 0.0811
17 3.7511 4.3613 0.1216
18 4.2475 4.0523 0.2027
19 2.8831 3.3401 0.0811
20 3.2515 4.0754 0.1351
Table 6. Determining the appropriate numbers of programmers.
No. Testing time (hr) Code Numbers of programmers
1 24 148 28
2 7 151 97
3 21 149 32
4 22 150 31
5 4 156 176
6 7 150 96
7 5 150 135
8 2 155 349
9 20 150 34
10 8 151 85
11 16 156 44
12 13 154 53
13 21 156 33
14 24 155 29
15 1 154 693
16 11 150 61
17 16 154 43
18 11 149 61
19 16 154 43
20 15 151 45
21 19 156 37
22 15 152 46
23 9 156 78
24 5 152 137
25 15 155 47
26 24 151 28
27 23 149 29
28 19 156 37
29 23 150 29
30 10 154 69
31 22 148 30
32 8 148 83
33 16 154 43
34 12 149 56
35 12 154 58
36 8 156 88
37 14 150 48
38 24 151 28
39 9 154 77
40 21 152 33
41 21 153 33
42 4 152 171
43 18 155 39
44 13 152 53
Table 7. Determining percent errors.
No. Bugs Code %errors by traditional %errors by simulation
1 17 155 10.97 9.43
2 8 154 5.19 4.47
3 13 152 8.55 7.36
4 28 151 18.54 15.95
5 25 150 16.67 14.33
6 13 148 8.78 7.55
7 8 149 5.37 4.62
8 28 152 18.42 15.84
9 30 156 19.23 16.54
10 19 151 12.58 10.82
11 19 148 12.84 11.04
12 11 153 7.19 6.18
13 33 152 21.71 18.67
14 34 153 22.22 19.11
15 10 153 6.54 5.62
16 13 153 8.50 7.31
17 40 156 25.64 22.05
18 34 151 22.52 19.36
19 19 150 12.67 10.89
20 27 150 18.00 15.48
21 7 152 4.61 3.96
22 11 156 7.05 6.06
23 32 154 20.78 17.87
24 13 150 8.67 7.45
25 12 154 7.79 6.70
26 8 151 5.30 4.56
27 30 151 19.87 17.09
28 40 148 27.03 23.24
29 24 155 15.48 13.32
30 30 149 20.13 17.32
31 36 154 23.38 20.10
32 21 156 13.46 11.58
33 32 148 21.62 18.59
34 32 148 21.62 18.59
35 17 148 11.49 9.88
36 34 149 22.82 19.62
37 39 155 25.16 21.64
38 23 149 15.44 13.28
39 41 149 27.52 23.66
40 35 150 23.33 20.07
41 23 151 15.23 13.10
42 27 153 17.65 15.18
43 28 149 18.79 16.16
44 10 150 6.67 5.73
Table 8. Determining numbers of programmers due to Simulation, Regression, and Random techniques.
No. Testing Time (hr) Code Simulation Regression Random
1 12 150 56 63 1
2 5 155 140 155 93
3 14 149 48 53 11
4 6 149 112 124 99
5 20 152 34 38 15
6 5 152 137 152 122
7 15 150 45 50 10
8 11 152 62 69 69
9 24 150 28 31 38
10 6 148 111 123 123
11 6 153 115 128 70
12 18 149 37 41 41
13 1 154 693 770 924
14 13 152 53 58 35
15 13 152 53 58 58
16 8 155 87 97 39
17 12 150 56 63 63
18 15 149 45 50 60
19 14 156 50 56 11
20 23 152 30 33 13
5.
Conclusion
As we know that the SDLC is the well-known methodology for computer software engineering, particularly in developing, testing, and maintaining the program. Many researches propose techniques and methods for testing and maintaining software such as regression test selection. Nevertheless, this paper presents the simulation technique to determine the appropriate numbers of programmers in the process of software testing, whereas testing time is specified by the users. The proposed model gives minimum numbers of programmers compared with the traditional techniques. Moreover, it includes the most important factors, which are requirement specification (functions), lines of code, and faults. Another is to find the percent errors or bugs that may fail the entire software system. This article aims some of the researchers who want to answer the questions: “How many of programmers are required to test the software overnight?” and are the results after testing significant?
References
[1] N. M. A. Munassar and A. Govardhan, “A comparison between five models of software engineering,”
IJCSI, vol. 7, no. 5, pp. 94-101, Sept. 2010.
[2] A. Kaur and K. S. Mann, “Component based software engineering,” IJCA, vol. 2, no. 1, pp. 105-108, May 2010.
[3] M. M. Lehman, “Software engineering, the software process and their support,” SEJ, vol. 6, no. 5, pp. 243-258, Sept. 1991.
[4] S. T. Krishna, S. Sreekanth, B. Bhaskar, and N. P. Kuma, “Explore ten different types of software engineering principles,” IJNSA, vol. 4, no. 5, pp. 191-201, Sept. 2012.
[5] T. M. Krishna, and D. Vasumathi, “A study of mining software engineering data and software testing,”
CIS, vol. 2, no. 11, pp. 598-603, Oct. 2012.
[6] L. Osterweil, “Strategic directions in software quality,” ACM Computing Surveys, vol. 28, no. 4, pp. 738-750, Dec. 1996.
[8] J. Carver, N. Nagappan, and A. Page, “The impact of educational background on the effectiveness of requirements inspections: An empirical study,” TSE, vol. 34, no.6, pp. 800-812, Nov. 2008.
[9] M. Patel. (2012). Kontera, E-Education System. Computer Overview. [Online]. Available: http://e-educationsystem.blogspot.com/2012/03/blog-post_6263.html
[10] S. Balaji, “Waterfall vs v-model vs Agile: A Comparative Study on SDLC,” JITBM & ARF, vol. 2, no. 1, pp. 26-30, Jun. 2012.
[11] Y. B. Leau, W. K. Loo, W. Y. Tham, and S. F. Tan, “Software Development Life Cycle AGILE vs Traditional Approaches,”International Conference on Information and Network Technology, 2012, pp. 162-167. [12] IBM. (2003). Rational Unified Process: Best practices for software development teams. [Online]. Available:
http://www.ibm.com/developerworks/rational/library/253.html
[13] M. Sharma, “A Survey of project scenario impact in SDLC models selection process,” IJSER, vol. 2, no. 7, pp. 1-4, Jul. 2011.
[14] B. W. Boehm, “A spiral model for software development and enhancement,” IEEE, IEEE Computer Society, vol. 21, no. 5, pp. 61-72, May 1988.
[15] W. W. Royce, “Managing the development of large software systems: Concepts and techniques,” in
Proceedings of the 9th international conference on Software Engineering, 1987, pp. 328-338.
[16] G. Rothermel and M. J. Harrold, “A safe, efficient algorithm for regression test selection,” in
Proceedings of the Conference on Software Maintenance, 1993, pp. 358-367.
[17] G. Rothermel and M. J. Harrold, “Analyzing regression test selection techniques,” IEEE Transactions on Software Engineering, vol. 22, no. 8, pp. 529-551, Aug. 1996.
[18] G. Rothermel and M. J. Harrold, “Experience with regression test selection,” in International Workshop for Empirical Studies of Software Maintenance, 1996, pp. 178-188.
[19] G. Rothermel and M. J. Harrold., “A safe, efficient regression test selection technique,” ACM Transactions on Software Engineering and Methodology, vol. 6, no. 2, pp. 173-210, Apr. 1997.
[20] G. Rothermel and M. J. Harrold, “Empirical studies of a safe regression test selection technique,”
IEEE Transactions on Software Engineering, vol. 24, no.6, pp. 401-419, Jun. 1998.
![Fig. 1. Six phases of SDLC [13].](https://thumb-us.123doks.com/thumbv2/123dok_us/8109813.236039/3.595.138.459.88.273/fig-six-phases-of-sdlc.webp)