Article
Numerical Analysis of Concrete Block Pavements and
comparison of its Settlement with Asphalt Concrete
Pavements using Finite Element Method
Gholam Ali Shafabakhsha,*, Afshin Familyb, and Babak Pourzand Hossein Abadc
Faculty of Civil Engineering, Semnan University, Semnan, I.R. of Iran
E-mail: ashafabakhsh@semnan.ac.ir (Corresponding author), bfamily.afshin@gmail.com, cbabak.pourzand@gmail.com
Abstract. Regarding time consuming properties and complex intervention of layers and different materials, it is better to replace laboratory based design and analysis of pavements with quick and powerful software including finite element, finite reduction software and etc. Using finite element software ABAQUS, at first, the paper investigated effects of changes of concrete block thickness in vertical stress and it was validated with experimental results. Also, using this software, effect of asphalt concrete thickness change was studied in vertical strain. And finally, results of finite element model were validated, using experimental data. Regarding that finite element analysis is suitable for crust environments and concrete block pavement does not have such environment, this research tends to compare these two types of pavements, using mathematical equations to analyze settlement. To do this, first, two models were analyzed, one for concrete block pavement and the other one for asphalt concrete pavement. Subgrade and base layers’ models were the same in geometrical point of view and types of materials, but thickness of asphalt and concrete block pavement layers and bedding sand changed, alternatively and based on the obtained relations and diagrams, there has been a chance to equate indices of these two types of pavements.
Keywords: Concrete block pavement, finite element, vertical deflection, asphalt concrete pavement.
ENGINEERING JOURNAL Volume 18 Issue 4 Received 10 October 2013
1. Introduction
In mechanistic methods used in the analysis of layered pavement systems under traffic load, the pavement layers are considered as homogenous, linear elastic and isotropic and the loading is considered as static [1]. However, the accuracy of these methods is limited because they are simplified procedures that consider linear behavior for subgrade system. In addition, in CBP these methods ignore certain parameter such as the discontinuous nature of blocks. Concrete block pavement has been recommended for the areas with less than 70 km/h traffic speed [2]. For years, researchers used a range of software to study concrete block pavements’ design and analysis based on laboratory results and the experiences obtained from behavior of this pavement. Time-consumption and difficulty of these analyses prevented user to apply them. With the availability of high-speed computers, finite element methods are gaining acceptance as the finite element analysis programs can handle complex geometry, boundary conditions and material properties with ease [3].
Nowadays, finite element method plays an important role in engineering analyses. Finite element method is one of the strict ways to design of concrete block pavement which considers discontinuous nature of Block Pavers [4]. Regarding that concrete block pavement layers include a number of small elements, it is complicated to model this type of pavement for structural analysis, using finite element method. Regarding the above-mentioned subject, this paper solved the problem using analytical comparison of asphalt concrete pavement and concrete block pavement and also through presentation of an equation for settlements of the above-named pavements. This paper performed an analysis of 3D finite element model, using ABAQUS (version 6.11). Two validations were performed to show accuracy of the analysis. To validate concrete block pavement model, this paper compares vertical stresses of the pavement, using software with analytical results obtained from the research case, as shown in section 4.1. Also to validate asphalt concrete pavement model, this paper compares vertical stresses of the pavement, using software with analytical results obtained from the research case, as shown in section 4.2.
2. Research Background
Till now, three general methods have been introduced to analyze concrete block pavement. These methods include modified slab analysis, layered elastic analysis and finite element analysis. Modified slab analysis was performed by Marias [5] and Dutruel [6]. Layered elastic analysis method was performed by Barber [7] and Shackel [8]. Also, finite element analysis was performed by Houben and Nishizawa in 1984 [9, 10].
Two former methods has been criticized due to lack of regarding non-continuous and separated nature of the pavement blocks and they assumed that concrete block layer can be modeled in equivalent continuous elastic layer conditions. However, finite element techniques are capable to model blocks in form of units to define load or deflection transfer capacity in the gaps between neighboring units. In addition, non-linearity behavior (i.e. subgrade and base layers) can be considered in this technique. Most of the methods related to concrete block pavement structural design include concrete asphalt concrete pavement design processes with limited changes and experimental basis. Regarding the above-mentioned note, most of the countries modified asphalt concrete pavement design processes based on the knowledge on operation of this pavement system and replaced that with computer programs including LOCKPAVE program (written by professor Shackle) and DELPAVE (written by professor Huurman) and BLPAVE30 (written by professor Nishiazava).
Concrete block pavement analysis was performed in 1984 while only considered concrete block layer. However, it was valuable in creating a confirmation for theoretical issues in different performances of pavements, performing in different patterns [10]. Next research, in 1984, showed that finite element analytical method presents more accurate results than layered elastic theory [11].
In 1992, Woodman has reported full scale testing in which levels of vertical strain were measured beneath rolling loads at Transport Research Laboratory (TRL). The research results showed that pavers and their bedding sand are equal with less than 10 mm of asphalt, rather than the value of 100mm in BS7533 [15].
Shackel showed that concrete block pavements can tolerate lager deflection than asphalt concrete pavement without cracking [14].
Panda et al. 2002 showed that using bedding sand layer improves efficiency in this type of pavement upon increasing shearing strength versus vertical deflections [16].
BS 7533-3 [15] suggests application of this layer for regions with heavy traffic including pavement of airport and bus stations. Panda et al. also observed that pavement deformations are not significantly affected by bedding sand thickness with less than 50mm thickness, but they found that thicknesses higher than 50mm significantly increase deformations [16].
2D and 3D models were performed in 2003, including all components of concrete block pavement which used rigid elements for simulation [17].
Considering comparison background of two types of pavements including concrete block pavement and flexible pavement shows that there is no research performed to compare these two types of pavements using finite element method. Therefore, this research presents relations for settlement equation of those two types of pavements, emphasizing on settlement comparison of these two types of pavements with finite element method.
3. Methodology
The most important purpose of this research is to identify and generate information needed to compare asphalt concrete pavement and concrete block pavement based on the settlement. To ensure the accuracy of FEM analyses, two validations were carried out and the results were compared to the case study experimental results, and were in very good concurrence. The first stage of the article contains parametric studies including the effects of different factors on the settlement. For this purpose 3D-FEM concrete block pavement and asphalt concrete pavement models were analyzed in which Subgrade and Base layers were the same in geometrical point of view and material properties. Then at the second stage in order to evaluate the settlement equivalency concrete block surfacing to bituminous surfacing, three equations were extracted from maximum vertical deflection against concrete block, asphalt and bedding sand thickness. Finally as result of these equations there has been a chance to equate indices of these two pavements. The results can be used as a benchmark.
4. Model Validation
4.1. Concrete Block Pavement
4.1.1. Case study
Fig. 1. Vertical stresses per number of loadings for different depths of pavement [18]. 4.1.2. Finite element model geometry
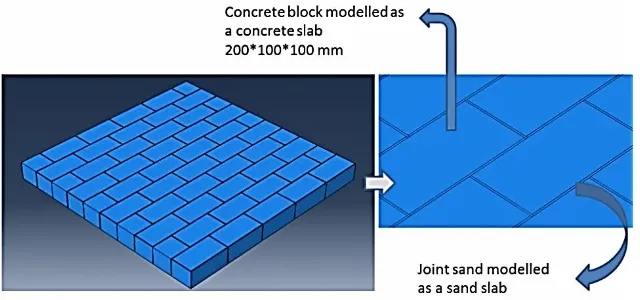
A Stretcher Bond pattern was used to model a concrete block pavement. Figure 2 shows this type of pavement pattern.
Fig. 2. Stretcher Bond pattern of concrete block pavement.
[image:4.595.137.460.83.268.2] [image:4.595.140.460.365.515.2]Fig. 3. 3D geometry of the meshed model.
Mesh dimensions are chosen through test and trial analysis in a way that boundaries have no effect on analysis results. It can be considered when defining load, load type, combination of different loadings and their coefficients. In this research, an 8.2 ton single axle load has been modeled by using a 41 kN single wheel load at the center of the pavement. The most common way of applying wheel loads in a finite element analysis is to apply pressure loads to a circular or rectangular equivalent contact area with uniform tire pressure [19]. This load was uniformly distributed on a square area with dimensions of 261mm which led to contact pressure of 600 kilo Pascal on pavement level area.
4.1.3. Material properties
[image:5.595.128.464.78.338.2]Due to there was no material properties reported in the case study [19] being analyzed, the properties recommended by Shackel [17] were used. The layer properties are presented in Table 1. The Subgrade modulus reaction considered to be 225 Mpa. For this analysis, concrete blocks are considered to be elastic. Bedding sand, base and subgrade layers were assumed to have elasto perfectly plastic behavior and the Drucker-Prager model [20] was utilized as their failure criteria. It is assumed that the layers are in full contact with each other and there is no relative deflection between them.
Table 1. Material and layers properties for concrete block pavement model.
Layer Elasticity modulus (Mpa)
Unit Weight
(KN/m3) Poisson's Ratio C (KN/m3)
Φ (degree)
Concrete block 2500 20 0.3 - -
Bedding sand
and joints 350 18 0.35 10 30
Base 225 18 0.35 10 30
[image:5.595.66.533.587.726.2]4.1.4. Validation results
[image:6.595.86.501.177.255.2]The results obtained from model analysis are compared with the results of case study [18]; numerical results of this comparison are presented in Table 2. There is a good agreement between the results calculated with FE models and the measured results. From the results, it can be concluded that significant value of stresses, resulted from traffic loads, depreciates on wearing surface.
Table 2. Vertical stress resulted in experimental and ABAQUS software for concrete block pavement. Position Experimental Results (Kpa) ABAQUS Results (Kpa)
On the Paver 600 600
Under Block 300 297
Under Bedding sand 150 140
Under Base 100 86
4.2. Asphalt Concrete Pavement
4.2.1. Case study
[image:6.595.158.438.392.519.2]One of the FWD (Light Falling Weight Deflectometer) test results was investigated to validate flexible pavement model. To obtain values of maximum vertical deformation of asphalt layers in laboratory, a pressure equal to 800 kPa was operated on the loading circle area with a radius of 100 mm. This traffic loading is in relation with effect of the load on pavement layers, caused by heavy conventional trucks. Figure 4 shows laboratory results of maximum displacement of total layers in elastoplastic mode.
Fig. 4. Diagram of laboratory results of maximum displacement of the pavement layers [21]. 4.2.2. Finite element model geometry
Fig. 5. Model geometry of asphalt concrete pavement [21].
Fig. 6. Top view of single wheel model.
Fig. 7. 3D mesh on asphalt concrete pavement model. 4.2.3. Material properties
[image:7.595.142.461.77.286.2] [image:7.595.107.442.310.620.2]laboratory, a pressure equal to 800 kPa was operated on the loading circle area with a radius of 100 mm. This traffic loading related to the load on pavement layers due to the traffic of heavy trucks. Internal friction with 44, 40 and 36 degrees, respectively, is assumed for Base, Sub-base and Subgrade layers.
Table 3. Material and layers properties for concrete block pavement model.
Asphalt concrete Base Sub-base Subgrade
Modulus of Elasticity (Mpa) 4000 241 139 89
Poisson's ratio 0.3 0.3 0.3 0.3
Internal friction angle Φ - 44°-48° 40°-44° 36°-40°
Delay angle Ψ - 46° 42° 38°
Thickness (mm) 50-120 200 200 -
4.2.4. Validation results
[image:8.595.121.477.329.461.2]The results obtained from model analysis are compared with the results of case study [18], as shown in Fig. 8. There is a good occurrence between FE model and experimental results. According to the results, the use of thicker asphalt, 80, 100 or 120 mm compared to 50 mm will result in lower deformation of the pavement. Moreover, due to significant reduction occurred in 50 to 70 mm asphalt thickness, 70 to 120 mm thickness can be recommended for design consideration in this type of pavement.
Fig. 8. Comparison of the results obtained from the analysis with those from the case study [18]. 5. Comparison Of Settlement In Two Types Of Pavements
At first, an asphalt concrete pavement model was built in order to compare settlement in two types of pavements. In this model, asphalt was used in it, instead of using concrete blocks, joints and bedding sand, in a way that geometry and material properties of subgrade and base layer were according to concrete block pavement model, as presented in section 4.1.3. Asphalt properties that are used in this model are according to Table 3. Figure 9 shows asphalt concrete pavement model per 80 mm asphalt thickness.
Fig. 9. Asphalt concrete pavement model per 80 mm asphalt thickness.
This model considers 5, 8, 10 and 12cm thicknesses for asphalt layer. Modelling diagram was drawn based on FE results and its fitting curve was drawn after drawing the diagram (see Fig. 10). It can be find out that the differences between results will be greater by increasing the thickness of surface layers. Obviously, increasing thickness asphalt surface leads to decrease of maximum vertical displacement of the pavement. According to Fig. 10 it can be concluded that gradient of this diagram decreases with higher rate by increase of asphalt thickness from 5 cm to 7 cm than its increase from 7 cm to 12 cm.
Fig. 10. Modelling diagram and its fitting curve for asphalt concrete pavement model.
Using fitting curve of the modelling, Eq. (1) will be obtained per different thicknesses of asphalt. 0145
. 0 3968 . 0 7911 . 3 212 . 12 ]
12 . 0 05 . 0
[ 3 2
x m m f x x x (1)
where f is maximum vertical deflection (m); x is thickness of asphalt concrete layer (m).
With considering the same material properties for the whole model of concrete block pavement (section 4.1.3), 4 ranges of thickness were applied for concrete blocks with 2 cm thickness of bedding sand. FEM results of this analysis are shown in Fig. 11.
Fig. 11. Modelling diagram and its fitting curve for concrete block pavement model.
[image:9.595.194.401.77.243.2] [image:9.595.158.441.358.468.2] [image:9.595.157.440.586.712.2]3 2
[0.07 0.1 ] 83.333 24.085 2.3284 0.0774
y m m f y y y
(2)
where variables of this equation are: f: Maximum vertical deflection (m); y: Concrete block thickness (m).
With configuration of Eqs. (1) and (2), Eq. (3) obtained:
3 2
3 2
[0.05 0.12 ], [0.07 0.1 ] 12.212 3.7911
0.3968 83.333 24.085 2.3284 0.0629 0
x m m y m m x x
x y y y
(3)
Drawing diagram of Eq. (3) provides the possibility to equate maximum vertical deflection of two types of pavements including asphalt and concrete block pavement for different thicknesses of concrete block (with 2cm thickness of bedding sand layer) and asphalt layer (see Fig. 12). This diagram shows that maximum even vertical deflection, thickness of concrete block and 2cm thickness of bedding sand in concrete block pavement is equivalent with which of the asphalt layers in flexible pavement. Obviously, increasing concrete block thickness leads to increase of asphalt layer thickness. As diagram shows, gradient speed of this curve starts to increase from 5.5 cm, in a way that quantitative thickness increase of asphalt layer leads to consideration of more equivalent concrete block thickness to have maximum even vertical deflection. In addition, if blocks with thickness up to 10 cm (with 2 cm bedding sand thickness and 6 cm thickness for asphalt concrete layer) are not enough to reach even vertical deflection, it will be required to improve material property parameters e.g. Poisson’s ratio, block elasticity modulus, joints and bedding sand elasticity modulus and etc.
Fig. 12. Diagram of Eq. (3).
Modelling of this section considers 2, 3, 5 and 7 cm thicknesses for bedding sand layer for 9cm thickness of concrete block. The modelling diagram can be drawn, using obtaining results. After drawing the diagram, the related fitting curve was drawn (see Fig. 13).
Fig. 13. Modelling diagram and its fitting curve for a range of bedding sand thickness, considering 9cm thickness of concrete block.
Figure 13 shows that thickness increase of bedding sand layers in concrete block pavement leads to increase Asphalt thickness (m)
Co n cre te b lo ck t h ic k n es s (m )
0.05 0.051 0.052 0.053 0.054 0.055 0.056 0.057 0.058 0.059 0.06
[image:10.595.104.480.324.495.2] [image:10.595.149.441.565.668.2]3 2
3 2
[0.05 0.12 ], [0.02 0.07 ] 12.212 3.7911
0.3968 0.5 0.025 0.0055 0.0124 0
x m m z m m x x
x z z z
(5)
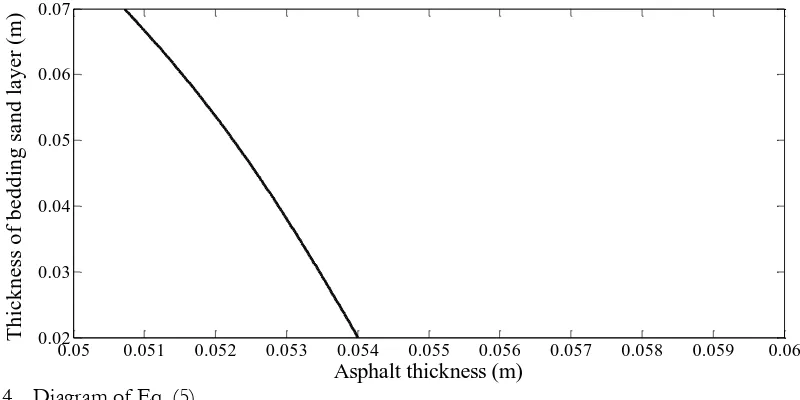
Drawing diagram of Eq. (5) provides the possibility to equate maximum vertical deflection of two types of pavements including concrete block pavement and asphalt concrete pavement for different thicknesses of bedding sand (with 9 cm thickness of concrete block) and asphalt layer (see Fig. 14).
Fig. 14. Diagram of Eq. (5).
This diagram shows that maximum even vertical deflection, 9 cm thickness concrete block and bedding sand layer in concrete block pavement is equivalent with which thickness of the asphalt concrete layers in flexible pavement. Thickness increase of bedding sand layer leads to decrease of asphalt layer thickness. As diagram shows, gradient speed of this curve starts to increase from 5.2 cm.
6. Conclusion
Regarding that concrete block pavement surface layer consists of a large number of very small blocks with complicated laying patterns, modelling with finite element method has been considered as a complicated and time-consuming method. Comparison of settlement of this type of pavement with asphalt concrete pavement was performed with regard to the above-mentioned issue. This research models two types of rigid pavement (concrete block pavement) and flexible pavements (asphalt concrete pavement). At first, these two types of pavements were validated with laboratory results. Good agreement was observed between the measured and the calculated results. Then, regarding even geometry and material properties of base layer and the subgrade layer, four thicknesses obtained for asphalt in flexible pavement including 5, 8, 10 and 12 cm, and four thicknesses obtained for concrete block including 7, 8, 9 and 10 cm and four thicknesses obtained for bedding sand layer in concrete clock pavement including 2, 3, 5 and 7 cm. Regarding to indices of the two types of pavements that is obtained by comparing two types of pavements and obtaining relations and diagrams of equalization, it can be concluded that:
1. According to validation diagram, significant value of stresses, resulted from applied load, depreciates on wearing surface. Therefore, it can be concluded concrete blocks do not merely act as wearing surface, like bituminous pavements that are flexible, but act as a single structural element. In other words, individual paving blocks interlock and act to dissipate traffic loads. 2. In CBP, the use of thicker block, 80 or 100 mm compared to 70 mm will result in lower
deformations of the pavement. Moreover load transfer will be high in thicker blocks due to higher frictional area that is provided by them. In asphalt concrete pavement the use of thicker asphalt layer also resulted in reduction in deformations. According to the deflection-asphalt thickness diagram, due to significant reduction occurred in 50 to 70 mm asphalt thickness, 70 to 120 mm thickness can be recommended for design consideration in this type pavement.
3. Thickness increase of bedding sand layer in concrete block pavement leads to increase in maximum vertical deflections of this type of pavement. As a result of this matter, there is no necessity to
Asphalt thickness (m)
T h ic k n e ss o f b e d d in g s a n d l a y e r (m )
0.05 0.051 0.052 0.053 0.054 0.055 0.056 0.057 0.058 0.059 0.06
[image:11.595.91.491.160.360.2]employ bedding sand thickness greater than 30 mm in the initial condition, which yields a compacted typically close to 20 mm.
4. Regarding the equalization diagram of asphalt thickness based on concrete block thickness, it is concluded that gradient of this diagram increases with increase of asphalt thickness from 5 to 5.4 cm with a rate lower than its increase from 5.4 to 6 cm and for asphalt with more than 6 cm thickness, blocks with thicknesses up to 10 cm are not enough for 2 cm thickness of bedding sand. Therefore, it is required to improve material property parameters including Poisson's ratio, blocks elasticity modulus, joints sand elasticity modulus and etc., to reach even vertical deflection. Furthermore, it can be concluded that 80-100 mm concrete block thickness corresponding to 20 mm bedding sand thickness in compacted condition, can be equivalent to 50-56 mm bituminous thickness regarding to the same settlement.
5. Regarding equalization diagram of asphalt thickness based on bedding sand thickness, it is concluded that gradient of this diagram decreases with increase of asphalt thickness from 5 to 5.2 cm with a rate lower than its increase from 5.2 to 5.4 cm and for asphalt with more than 5.5 cm thickness, per blocks with 9 cm thicknesses, it requires less than 2 cm thickness bedding sand. However, this is not suggested for designing because lower thicknesses result in lack of having even surface to balance blocks and interlocking phenomenon will not be created in its complete form. Therefore, it is required to improve material property parameters including Poisson's ratio, blocks elasticity modulus, joints sand elasticity modulus and etc., to reach even vertical deflection. References
[1] R. Y. Liang and J. X. Zhu, “Dynamic analysis of infinite beam or modified Vlasov subgrade,” J Transport Engng, vol. 121, no. 5, pp. 434–43, 1995.
[2] M. N. Soutsos, K. Tang, H. A. Khalid, and S. G. Millard, “The effect of construction pattern and unit interlock on the structural behaviour of block pavements,” Construction and Building Materials, vol. 25, pp. 3832–3840, 2011.
[3] T. S. Vepa and K. P. George, “Deflections response models for cracked rigid pavements,” J Transport Engng, vol. 84, no. 5, pp. 377-384, 1997.
[4] F. M. Nejad and M. R. Shadravan, “A study on behavior of block pavement using 3D finite element method,” Comp. Meth. Civil Eng., vol. 1, no. 1, pp. 65-71, 2010.
[5] L. R. Marias, “Investigation into the load bearing capacity of SF concrete road stone,” Portland Cement Institute, Johannesburg, 1967.
[6] F. Dutruel and J. Dardare, “Contribution to the study of structural behaviour of a concrete block pavement,” in Proceeding of Second International Conference on Concrete Block Paving, Delft University, Netherlands, pp. 29-39, 1984.
[7] S. D. Barber and J. Knapton, “Structural design of block pavements for ports,” in Proceeding of First International Conference on Concrete Block Paving, Newcastle, 1980.
[8] B. Shackel, “Analysis and design of concrete block paving subject to road traffic and heavy industrial loading,” in Proceeding of Second International Conference on Concrete Block Paving, Delft University, Netherlands, pp. 136-146, 1984.
[9] L. J. M. Houben, A. A. A. Molenaar, G. H. A. M. Fuchs, H. O. Moll, “Analysis and design of block paving,” in Proceeding of Second International Conference on Concrete Block Paving, Delft University, Netherlands, 86-99, 1984.
[10] T. Nishazaw, S. Matsuno, and M. Komura, “Analysis interlocking block pavements by finite element method,” in Proceeding of Second International Conference on Concrete Block Paving, Delft University, Netherlands, pp. 80-85, 1984.
[11] C. P. Bikasha and K. G. Ashok, “Structural behavior of concrete block paving. I: sand in bed and joints,” Journal of Transportation Engineering, vol. 128, no. 125-129, 2002.
[15] British Standards Institution, “Pavements constructed with clay, natural stone or concrete pavers – Part 3. Code of practice for laying precast concrete paving blocks and clay pavers for flexible pavements,” BS 7533-3, London, 1997.
[16] B. C. Panda and A. K. Ghosh, “Structural behavior of concrete block paving. I: Sand in bed and joints,” J Transport Eng, vol. 128, no. 2, pp. 123–9, 2002.
[17] B. Shackel, Design and Construction of Interlocking Concrete Block Pavements. London: Elsevier Applied Science, 1990.
[18] B. Shackel, “An experimental investigation of the response of interlocking block pavements to simulated traffic loading,” Australian Road Research Board, Research report ARR 90, pp. 11-44, 1979. [19] Y. H. Huang, Pavement Analysis and Design. New Jersey: Prentice Hall, 1993.
[20] D. C. Drucker and W. Prager, “Soil mechanics and plastic analysis or limit design,” Q. Appl. Math., vol. X, no. 2, pp. 157-165, 1952.


![Fig. 8. Comparison of the results obtained from the analysis with those from the case study [18]](https://thumb-us.123doks.com/thumbv2/123dok_us/8109698.236011/8.595.121.477.329.461/fig-comparison-results-obtained-analysis-case-study.webp)