R E S E A R C H A R T I C L E
Open Access
The impact of reference gene selection in
quantification of gene expression levels in guinea
pig cervical tissues and cells
Annika Lindqvist
*, Dustin Manders and R Ann Word
Abstract
Background:Accurate measurements of mRNA expression levels in tissues or cells are crucially dependent on the use of relevant reference genes for normalization of data. In this study we used quantitative real-time PCR and two Excel-based applets (geNorm and BestKeeper) to determine the best reference genes for quantification of target gene mRNA in a complex tissue organ such as the guinea pig cervix.
Results:Gene expression studies were conducted in cervical epithelium and stroma during pregnancy and parturition and in cultures of primary cells from this tissue. Among 15 reference gene candidates examined, both geNorm and BestKeeper foundCLF1andCLTCto be the most stable in cervical stroma and cervical epithelium, ACTBandPPIBin primary stroma cells, andCLTCandPPIBin primary epithelial cells. The order of stability among the remaining candidate genes was not in such an agreement. Commonly used reference such asGAPDHandB2M demonstrated lower stability. Determination of pairwise variation values for reference gene combinations using geNorm revealed that the geometric mean of the two most stable genes provides sufficient normalization in most cases. However, for cervical stroma tissue in which many reference gene candidates displayed low stability, inclusion of three reference genes in the geometric mean may improve accuracy of target gene expression level analyses. Using the top ranked reference genes we examined the expression levels of target genePTGS2in cervical tissue and cultured cervical cells. We compared the results withPTGS2expression normalized to the least stable gene and found significant differences in gene expression, up to 10-fold in some samples, emphasizing the importance of appropriately selecting reference genes.
Conclusions:We recommend using the geometric mean ofCFL1andCLTCfor normalization of qPCR studies in guinea pig cervical tissue studies,ACTBandPPIBin primary stroma cells andCLTCandPPIBin primary epithelial cells from guinea pig.
Keywords:Cervix, Guinea pig, qPCR, Reference genes, Parturition, Progesterone, Estradiol
Background
Accurate measurement of relative mRNA expression levels in tissues or cells using quantitative real-time PCR (qPCR) is crucially dependent on normalization of the data. Due to overall differences in transcriptional activity between tissues and different cell types, normalization cannot be based simply on the amounts of starting material. Since all mRNA molecules in one sample are subject to the same efficiency of RNA
purification, reverse transcription and polymerase amp-lification, quantification of a target gene in the sample is better normalized using the ratio of the target mRNA to an endogenous mRNA reference gene within the sample. It is imperative to use reference genes with min-imal variability between samples that are not influenced by the study conditions. A multitude of reference genes have been utilized for this purpose, although none are universally applicable for all tissues or cell types [1,2]. Thus, for every new experimental system, it is important to identify reference genes that fulfill these criteria. In addition, the widespread use of only one reference gene for normalization of qPCR data has been shown to be * Correspondence:[email protected]
Department of Obstetrics and Gynecology, University of Texas Southwestern Medical Center, 5323 Harry Hines Blvd F2.302, Dallas, TX 75390, USA
inadequate at times often resulting in values that are multiple-fold wrong [3]. It has thus been suggested that using the geometric mean of two or more meticulously selected reference genes results in more accurate com-parisons and quantification between study conditions.
In this study, we sought to identify reference genes suitable for determination of gene expression in guinea pig cervical tissues and cells. We also examined the impact of reference gene choice on the measured changes in expression of a gene that has been shown to be expressed and regulated in cervix at term pregnancy in women [4], i.e., PTGS2, the gene for cyclooxygenase 2. This gene product increases the levels of bioactive prostaglandins which are known to be of importance in cervical ripening. The temporal relationship between cervical ripening and increase in cervical prostaglandins is not known. In mice, rats, as well as other species that depend on progesterone withdrawal prior to parturition, a combination of loss of progesterone systemically [5] and locally [6] leads to increased prostaglandin bio-synthesis in progesterone-responsive target tissues. In primates and guinea pigs, however, progesterone levels do not decline systemically prior to parturition. Studies of events involved in cervical ripening in humans are complicated by difficulties in obtaining cervical tissue from second and third trimesters of pregnancy. Indeed, most studies to date have been carried out on cervical biopsies taken either in connection with early termin-ation of pregnancy [7,8], at the time of vaginal delivery [7,9-11], or Cesarean section at term [10,12,13], usually after cervical ripening. Thus, to study this process both in vivo and in vitro, we chose to use the pregnant guinea pig as a model system to dissect changes in gene expres-sion in hormonal settings that mimic those of humans. Despite its historical popularity in research [14], few studies have been published in which guinea pig gene expression levels have been determined using qPCR. Further, to our knowledge, none have been conducted in cervical tissues or cells.
Several aspects of qPCR studies in the guinea pig cervix are worthy of consideration. First, the cervix is a complex tissue composed of several cell types. Specific-ally, the stromal compartment is comprised of highly specialized fibroblasts that orchestrate changes in the extracellular matrix and the biomechanical properties of the cervix [15,16], but myofibroblasts and smooth muscle cells are also present. Endocervical epithelial cells line the cervical canal and are known to alter gene expression during cervical ripening and labor [4]. Finally, a number of different immune cells infiltrate and are activated within the cervix and are believed to contribute to matrix remodeling and function of the cervix during pregnancy and parturition [17]. Hence, to quantify changes in gene expression of the cervix as an
organ, reference genes must be applicable to many cell types, all of which differ in transcriptional activity.
Here, we used Excel-based applets (geNorm and BestKeeper) to determine the most stable reference genes among 15 candidates for use in qPCR studies of gene expression levels in guinea pig cervical tissues and cell cultures. More specifically, cervical stroma and epithelial tissues from guinea pigs under various hormonal conditions (e.g., immature, mature nonpregnant and pregnant) were collected and analyzed. Likewise, gene expression levels were quantified in primary cervical stromal and epithelial cells in culture treated with or without estradiol and/or progesterone.
Results
Primer validation
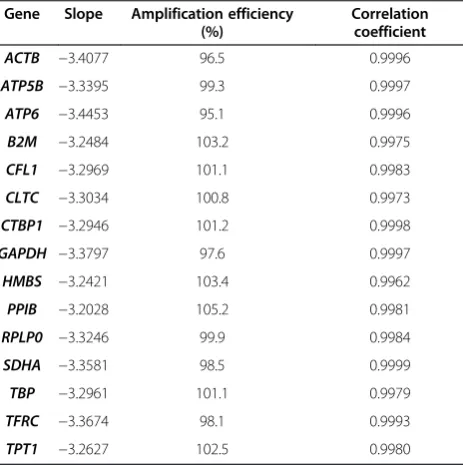
The quality of each qPCR primer pair was initially examined using 5-fold dilution series of guinea pig liver cDNA, and acceptable primer combinations had ampli-fication efficiencies greater than 95%, and correlation coefficients ≥ 0.996 (Table 1). Melt-curve analyses revealed a single peak and no amplification in no tem-plate controls. Further, examination of qPCR reaction products using 2% agarose-1000 gel electrophoresis revealed a single band of expected size (Figure 1), and gene-specific amplification was confirmed by sequen-cing the qPCR products.
Expression stability according to geNorm and BestKeeper Each DNase I-treated RNA sample was analyzed twice, and each qPCR was performed in triplicate. The
intra-Table 1 Guinea pig reference gene primer validation using liver cDNA
Gene Slope Amplification efficiency (%)
Correlation coefficient
ACTB −3.4077 96.5 0.9996
ATP5B −3.3395 99.3 0.9997
ATP6 −3.4453 95.1 0.9996
B2M −3.2484 103.2 0.9975
CFL1 −3.2969 101.1 0.9983
CLTC −3.3034 100.8 0.9973
CTBP1 −3.2946 101.2 0.9998
GAPDH −3.3797 97.6 0.9997
HMBS −3.2421 103.4 0.9962
PPIB −3.2028 105.2 0.9981
RPLP0 −3.3246 99.9 0.9984
SDHA −3.3581 98.5 0.9999
TBP −3.2961 101.1 0.9979
TFRC −3.3674 98.1 0.9993
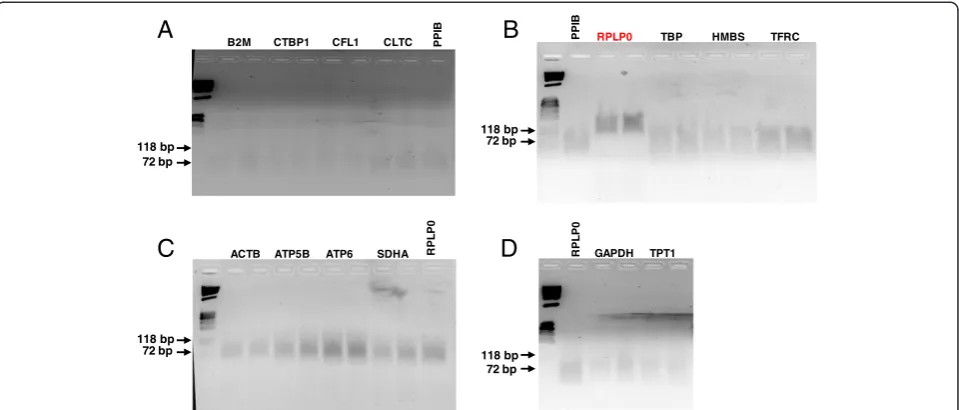
[image:2.595.306.538.500.733.2]assay coefficient of variation (CV) ranged from 0.10-0.33 for cervical tissue samples, and from 0.10-0.39 for primary cervical cells. The inter-assay CV for tissues ranged from 0.54-3.06 and from 0.60-2.56 for primary cells. Expression level of the candidate reference genes in each tissue was examined before the geNorm or BestKeeper analyses were performed. Any reference gene for which the Cq was above 30 among in a category of samples was excluded from the study. Expression of TBPwas found to be too low in all tissues and cell types.HMBS expres-sion level was too low in stromal tissues and stromal cells, andTFRCexpression was also too low in stromal tissues. The remaining candidates were included in the geNorm and Best Keeper analyses to determine expres-sion stability.
Of the remaining candidate genes examined with geNorm, all exhibited expression stability (M) values of less than 1.0 (lower M value indicates a more stable gene) regardless of tissue or cell type (Tables 2 and 3). This is well below the arbitrary cut-off value of 1.5 for acceptable expression stability. Ranking of expression stability as determined by geNorm analysis in cervical guinea pig tissues is shown in Table 2. The two most stable genes were not further ranked by geNorm and are thereby listed together.CFL1 andCLTCwere found to be the most stable genes in samples from both stroma and epithelium (i.e., M values of 0.4-0.9 in cervical stroma and 0.3-0.7 in cervical epithelium). BestKeeper scores the reference genes based on a repeated pairwise correlation analysis, and the more stable genes have a Pearson coefficient of correlation (R) that equals to or is close to 1 (Tables 2 and 3). According to this method,
the most stable genes in tissues were identical as those identified using geNorm (Table 2). Specifically, CFL1
and CLTC exhibited correlation coefficients ranging from 0.985-0.995. Overall, most genes displayed more stable expression in cultured cells relative to cervical tissues. Stability predictions for other genes were not as concordant between geNorm and BestKeeper.
M values (determined with geNorm) were lower in cultured primary cells relative to tissue samples, ranging from 0.1-0.35 in stroma cells and 0.1-0.25 in epithelial cells, suggesting that all tested gene candidates are expressed at rather stable levels in cultured cells.ACTB
and PPIBwere ranked as the two most stable genes in primary stroma cells whereas CLTC and PPIB were found to be the most stable in primary epithelial cells (Table 3). BestKeeper analysis also revealed the same two genes as top ranked (Table 3), with R values ranging from 0.981-0.999.
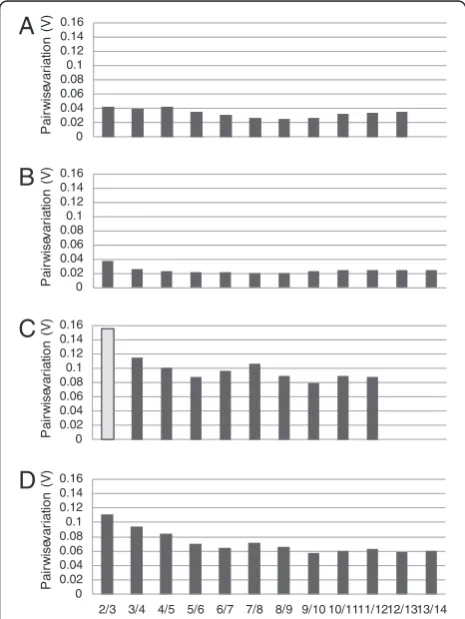
Pairwise variation to determine optimal number of reference genes
After identification of the most stable genes, the optimal number of reference genes for accurate normalization was determined. Pairwise variation values (V) were determined for each cell type and tissue using geNorm where lower V values correspond to high correlation coefficients. We considered the arbitrary cut-off value for acceptable pairwise variation as 0.15. Using only the two top rated reference genes exhibited values of less than 0.04 in both stroma and epithelial cell. The analysis revealed no substantial benefit of adding more reference genes to the normalization process in these cell types.
72 bp
B2M PPI
B
CLTC CFL1 CTBP1
118 bp
A
72 bp
RPLP0
PPI
B
TFRC HMBS TBP
118 bp
B
72 bp
GAPDH
RP
L
P
0
TPT1
118 bp
D
72 bp
ACTB RP
L
P
0
SDHA ATP6 ATP5B
[image:3.595.59.539.89.294.2]118 bp
C
Table 3 Stability of reference gene candidates in guinea pig cervical primary cell cultures
Stromal cells Epithelial cells
geNorm BestKeeper geNorm BestKeeper
Most stable ACTB/PPIB(0.09) PPIB(0.999) CLTC/PPIB(0.10) CLTC(0.983)
SDHA(0.12) ACTB(0.996) ATP5B(0.11) PPIB(0.981)
B2M(0.15) SDHA(0.995) CTBP1(0.12) ATP5B(0.975)
CLTC(0.18) B2M(0.984) B2M(0.12) CFL1(0.957)
RPLP0(0.20) CLTC(0.977) SDHA(0.13) CTBP1(0.946)
CTBP1(0.21) GAPDH(0.974) HMBS(0.14) ATP6(0.945
GAPDH(0.23) RPLP0(0.969) RPLP0(0.15) TFRC(0.936)
CFL1(0.24) CFL1(0.958) ATP6(0.16) B2M(0.932)
TPT1(0.25) CTBP1(0.957) TPT1(0.18) ACTB(0.932)
TFRC(0.28) TFRC(0.928) GAPDH(0.20) GAPDH(0.922)
ATP5B(0.30) TPT1(0.919) CFL1(0.22) SDHA(0.867)
ATP6(0.33) ATP5B(0.908) ACTB(0.24) HMBS(0.842)
ATP6(0.857) TFRC(0.26) RPLP0(0.838)
Least stable TPT1(0.602)
Excluded HMBS TBP
TBP
[image:4.595.55.540.465.714.2]Genes listed with the most stable as determined by geNorm or BestKeeper on top. Genes excluded due to low expression levels in the respective tissue are listed at the bottom. The numbers in brackets represent geNorm M values and BestKeeper R values, respectively.
Table 2 Stability of various potential reference genes in guinea pig cervical tissues
Stroma enriched Epithelium enriched
geNorm BestKeeper geNorm BestKeeper
Most stable CFL1/CLTC(0.42) CLTC(0.991) CFL1/CLTC(0.29) CLTC(0.995)
ACTB(0.48) ATP5B/CFL1(0.985) PPIB(0.34) CFL1(0.991)
ATP5B(0.51) B2M(0.983) SDHA(0.38) SDHA(0.983)
GAPDH(0.54) ACTB(0.978) GAPDH(0.41) TPT1(0.979)
PPIB(0.57) TPT1(0.977) ATP5B(0.44) B2M(0.970)
SDHA(0.62) SDHA(0.975) ACTB(0.47) TFRC(0.966)
ATP6(0.70) RPLP0(0.967) HMBS(0.51) PPIB(0.965)
RPLP0(0.75) ATP6(0.955) TFRC(0.55) ACTB(0.958)
B2M(0.78) CTBP1(0.954) ATP6(0.57) ATP5B(0.954)
TPT1(0.83) GAPDH(0.952) B2M(0.61) HMBS(0.950)
CTBP1(0.89) PPIB(0.937) RPLP0(0.65) ATP6(0.920)
CTBP1(0.68) GAPDH(0.92)
TPT1(0.72) CTBP1(0.895)
Least stable RPLP0(0.892)
Excluded HMBS TBP
TBP
TFRC
Specifically, V values were modestly decreased if more reference genes are included (Figure 2A, B). In cervical tissues M values were in general higher and covered a broader range of V values compared with cells in culture (Figure 2C, D). For cervical epithelial tissue (Figure 2D), V values indicated that using two reference genes for normalization still is sufficient whereas three reference genes may be required to achieve good normalization in cervical stroma tissue (Figure 2C).
Target gene expression levels vary according to choice of reference gene set
To determine the effect of different reference gene sets on target gene expression levels, we compared the rela-tive expression of PTGS2 in cervix-derived tissues and cell samples using different combinations of reference genes. For each sample, qPCR results were normalized
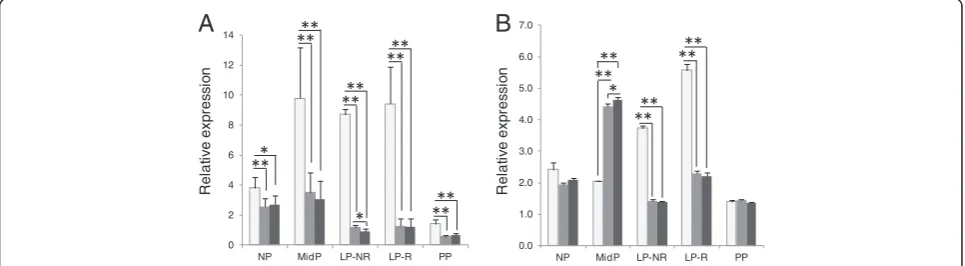
[image:5.595.57.290.306.616.2]to the geometric mean of the top three most stable genes, the top two most stable genes and to the least stable gene (Figures 3, 4). The PTGS2 expression did not vary significantly in primary cervical epithelial cells regardless of if the top three or only top two reference gene set used. In the comparison between the least stable and the top scoring genes only in one treatment group was there a significant difference inPTGS2 gene expression (Figure 3A). In primary cervical stroma cells there was no significant difference inPTGS2expression when using the top two or three most stable reference genes. However, comparison of any of the most stable gene combinations with the least stable resulted in significantPTGS2expression differences (Figure 3B). In cervical tissue samples the effect of using different refer-ence gene sets were more pronounced on PTGS2 gene expression results, with up to 10-fold difference seen in both some stroma and epithelial samples (not shown). Figure 4 exemplifies the variation in measured PTGS2
gene expression in five individuals, representing both pregnant and nonpregnant guinea pigs. The difference inPTGS2 gene expression is significant in almost every sample when compared with the least stable gene, des-pite the limited sample size. Additionally, the expression level is alternating between higher and lower depending on reference gene set used. Of the examples in Figure 4A if normalized to the least stable genePTGS2
expression was greatest in sample GP29, whereas if normalized to expression of PTGS2 expression was greatest in GP18. Interestingly, levels of the target gene normalized to three recommended reference genes (ACTB/CFL1/CLTC) did not differ appreciably from those normalized to the top two in most stroma samples (Figure 4B).
Discussion
Gene expression studies in tissue or cell samples de-pend on usage of appropriate reference genes. Many published qPCR studies normalize target gene expres-sion with the same reference genes that were used for normalization of data obtained with Northern blotting (e.g.GAPDH, 18S, ACTBandHPRT). These genes have since been found to be regulated in certain situations, for example under the influence of steroid hormones [18-20]. In hormone-responsive tissues, such as the uterine cervix, expression levels of reference genes needs to be unaffected by hormonal change associated with the menstrual/estrous cycle or pregnancy, the ef-fect of the presence of an embryo physical impact on the organ (pressure, stretching,) or growth hormones and prostaglandins released by the growing fetus or placenta. Different methods to find the most stable reference genes have been developed such as geNorm [3], BestKeeper [21], NormFinder [22], Principal Component
0 0.02 0.04 0.06 0.08 0.1 0.12 0.14 0.16 0 0.02 0.04 0.06 0.08 0.1 0.12 0.14 0.16 0 0.02 0.04 0.06 0.08 0.1 0.12 0.14 0.16
2/3 3/4 4/5 5/6 6/7 7/8 8/9 9/10 10/1111/1212/1313/14 0 0.02 0.04 0.06 0.08 0.1 0.12 0.14 0.16
A
B
C
D
P a ir w is ev a ri a tio n (V ) Pa ir w is eva ri a ti o n (V ) Pa ir w is ev a ri a ti o n ( V ) Pa ir w is ev a ri a ti o n ( V )Figure 2Pairwise variation of reference gene candidates in cervical cells and tissues as determined by geNorm.The first bar (2/3) represents the pairwise variation (V) in a 2 vs. 3 reference genes comparison. The second bar (3/4) represents pairwise variations in a 3 vs. 4 reference gene comparison. Variation values were
Analysis [23], and methods based on restricted max-imum likelihood with support of descriptive statistics [24]. Kayis et al. [24] compared the ability of these different methods to rank reference gene stability in equine endometrium and found that, with the exception of NormFinder, all methods identified the same genes as the most stable. They also found that all methods gave similar results for the least stable genes in the same tissue. Here we chose to use geNorm and BestKeeper to identify the most stable reference genes of fifteen candi-dates in tissue and cell samples from the guinea pig cervix.
Although guinea pigs have been used historically and extensively for animal models in the laboratory, the guinea pig genome has not been completely sequenced. When deciding which reference gene candidates to in-clude in this study, we chose to use only genes for which the guinea pig genomic/cDNA sequence was known and we only included mRNA reference genes. We based our exclusion of the commonly used 18S gene not only
on the fact that it represents a different class of RNA but it is also present at a very high abundance in samples which makes dilution of the samples necessary conferring less precision and accuracy. Some reference genes included in the study (e.g. RPLP0) have been shown to be unregulated by estrogen in human breast cancer cells [25,26]. Similarly, ACTB mRNA was reported to be unregulated in human endometrium during the course of the menstrual cycle [27]. Thus, these two genes were of great interest as potential candidates for normalization of qPCR data in the guinea pig cervix. Our results indicate that ACTB is indeed a stable gene in guinea pig cervix, but only in stromal tissues and in cultured primary stroma cells. In epithe-lial tissues and cultured epithelia cells, ACTB ranked among the least stable. In addition,RPLP0did not rank among the most stable in any of the samples, a finding that exemplifies the importance of evaluating reference for each new sample set and for each experimental set up.
0 0.2 0.4 0.6 0.8 1 1.2 1.4 1.6 1.8 2
C E P E+P
R
e
la
ti
v
e
exp
res
s
io
n
A
B
R
e
la
ti
v
e
exp
res
s
io
n
0 0.3 0.6 0.9 1.2 1.5 1.8 2.1
[image:6.595.61.540.89.233.2]C E P E+P
Figure 3Effect of normalization options onPTGS2gene expression in cultured cervical cells.PTGS2expression was normalized to either the least stable (white), the top two most stable (gray) or the top three most stable (black) reference genes for each cell type as established with geNorm. Relative levels ofPTGS2mRNA were determined in (A) cervical epithelial cells and (B) cervical stromal cells treated with vehicle (C), estradiol (E, 10 nM), progesterone (P, 100 nM), or E+P. Error bars indicate 95% confidence interval; *, p<0.05; **, p<0.01; n=18.
0 2 4 6 8 10 12 14
NP MidP LP-NR LP-R PP
0.0 1.0 2.0 3.0 4.0 5.0 6.0 7.0
NP MidP LP-NR LP-R PP
R
e
la
ti
v
e
exp
res
s
io
n
A
B
R
e
la
ti
v
e
exp
res
s
io
n
[image:6.595.57.540.543.676.2]It should be emphasized that cell populations and tissues used in this study are not pure. The collection technique allows us to dissect stroma- and epithelium-enriched tissue. No doubt, each tissue type may be contaminated by epithelial or stromal cells, respectively. Further, the extent of this contamination may vary according to pregnancy or hormonal state. The higher M values in tissue samples relative to those in cultured cervical cells are most likely due to heterogeneous cellu-lar composition of tissues. Nonetheless, results from this study support the notion that even under these very variable conditions it is possible to identify reference genes that are expressed in a stable manner.
Conclusions
In summary, we used two different methods, geNorm and BestKeeper, to identify the most stable reference genes in guinea pig cervix among fifteen candidates. Both methods identifiedCFL1/CLTCas the most stable in cervical tissues,ACTB/PPIBfor cultured stroma cells, and CLTC/PPIB for cultured epithelia cells. The mini-mum number of reference genes to be included in the geometric mean for normalization of qPCR data was found to be two in cervical epithelial tissue and cells, and in cultured stroma cells. In cervical stroma tissue, where the tested reference genes display a higher degree of instability, the mean of three, ACTB/CFL1/CLTC, improves the normalization according to geNorm. In our limited sample numbers there was no statistical dif-ference demonstrated between two and three redif-ference genes. Nevertheless, the importance of stable reference genes in quantification of mRNA levels in complex tissues cannot be overstated.
Methods
Guinea pig tissue collection
Hartley guinea pigs (Elm Hill Labs, Chelmsford, MA) were kept individually in the Animal Care Facility at UT Southwestern, housed at 21°C with 30-70% humidity under a 12 h light cycle, and fed Teklad Global Guinea Pig Diet 2040 pellets, water, and hayad libitum. All ani-mal procedures were approved by the UT Southwestern Institutional Animal Care and Use Committee. Twenty four female guinea pigs representing sexually immature (n=1), sexually mature non-pregnant (n=4), pregnant (n=15) and postpartum period (n=4) were sacrificed using i.p. Euthasol Euthanasia Solution (390 mg pento-barbital sodium and 50 mg phenytoin sodium/ml) injec-tions according to IACUC approved protocol. The reproductive tract was immediately removed and the cervix excised and further micro dissected into cervical epithelium and stroma. Epithelium was obtained by scraping the lining of the endocervical canal with a scalpel whereas the remaining underlying connective
tissue was considered stroma. Cervical and vaginal epithe-lium covering the external os were discarded. All tissues were snap frozen in liquid nitrogen and stored at−80°C.
RNA isolation
Cervical tissues (5–50 mg) were thawed and homoge-nized in RNA STAT-60 (TelTest Inc., Friendswood, TX) using a tissue tearor (Biospec Products, Inc., Bartlesville, OK). Thereafter, total RNA was extracted according to the manufacturer’s protocol, using chloroform (C2432, Sigma, St. Louis, MO), isopropanol (I9516, Sigma, St. Louis, MO), and ethyl alcohol (E190, Pharmaco-Aaper, Brookfield, CT). Each RNA sample (~10μg) was treated for 30 min @ 37°C with 2 U DNase I in 50μl reactions (DNA-free, part no. AM1906, Ambion) for removal of contaminating genomic DNA, and subsequently stored at −80°C. Total RNA was isolated from cells in culture using an RNAqueousW-4PCR kit (cat. No. AM1914, Ambion, Austin, TX), and subsequently stored at−80°C.
Guinea pig cervical primary cell culture
Cervical tissues were obtained from a mature nonpreg-nant guinea pig. After mincing in 2–4 mm pieces, fresh tissues were incubated for 1 h at 37°C in solution contain-ing collagenase B (1 mg/ml) (cat no. 11088823103, Roche, Indianapolis, IN) and DNase I (0.1 mg/ml) (cat no. 10104159001, Roche, Indianapolis, IN). The mixture was then strained through a 70μm mesh (cat no. 352350, BD Biosciences, Bedford, MA) to achieve separation between stromal (flow through) and epithelial (retained) cells. The respective cells were collected, dispersed in DMEM with-out phenol red (cat no. 11054, Invitrogen, Carlsbad, CA) buffered with 10 mM HEPES (cat no. 15630, Invitrogen, Carlsbad, CA), and supplemented with 2 mM L-Glutamine (cat no. 25030, Invitrogen, Carlsbad, CA), 10% by volume fetal bovine serum (FBS) (cat no. S11150, Atlanta Biologi-cals, Lawrenceville, GA) and penicillin G (10 U/ml)-streptomycin sulfate (10μg/ml)-amphotericin B (25 ng/ml) mix (cat no. 9350, Irvine Scientific, Santa Ana, CA). Cells were plated at 5 × 10⁵ cells/cm2 and culture medium was changed every other day until near confluency (2–4 day). Preconfluent cells in passages 1–3 were used for experiments. Cells were serum-deprived for 3 day be-fore treatment with 17β-estradiol (10 nM), progesterone (1 μM), a combination of 17β-estradiol and progester-one, or vehicle (ethanol) for 24 h.
cDNA synthesis
Reverse Transcriptase was used for cDNA synthesis from 2μg total RNA in 20μl reaction volumes, with the follow-ing reaction conditions; 25°C for 10 min, 37°C for 2 hrs, 85°C for 5 min, and 4°C for 1 min. The final product was diluted to correspond to 20 ng initial RNA input/μl, and was stored at−20°C.
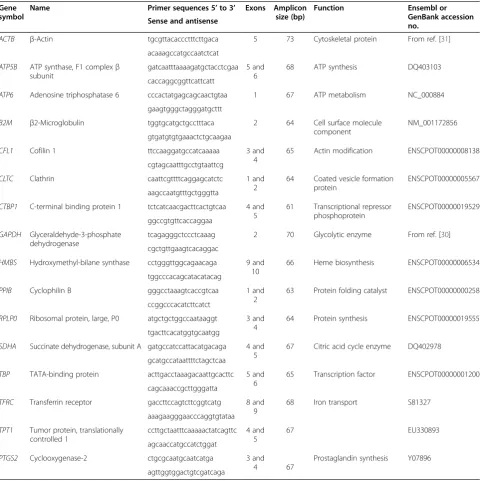
Selection of reference and target genes, and primer design Potential reference genes were chosen among those used in various human tissues or cell types [3,23,28,29] for which the corresponding guinea pig nucleotide se-quence was available. When possible, primer pairs were
designed to span an intron. Two primer sets have been used previously as guinea pig reference genes in qPCR assays,GAPDH[30] andACTB[31].For target gene we chose cyclooxygenase-2,PTGS2, an enzyme involved in prostaglandin synthesis that has been shown to be expressed in human cervix [4]. Primer sequences are shown in Table 4. All primers were synthesized com-mercially (Integrated DNA Technology, Coralville, IA).
Quantitative real-time PCR (qPCR)
[image:8.595.58.539.252.734.2]All qPCR was performed using 50% of iTaq SYBR green SUPERMIX with ROX (cat. no. 172–5851, Bio-Rad,
Table 4 Guinea pig reference and target gene information
Gene symbol
Name Primer sequences 5’to 3’ Exons Amplicon size (bp)
Function Ensembl or
GenBank accession no.
Sense and antisense
ACTB β-Actin tgcgttacaccctttcttgaca 5 73 Cytoskeletal protein From ref. [31]
acaaagccatgccaatctcat
ATP5B ATP synthase, F1 complexβ subunit
gatcaatttaaaagatgctacctcgaa 5 and 6
68 ATP synthesis DQ403103
caccaggcggttcattcatt
ATP6 Adenosine triphosphatase 6 cccactatgagcagcaactgtaa 1 67 ATP metabolism NC_000884
gaagtgggctagggatgcttt
B2M β2-Microglobulin tggtgcatgctgcctttaca 2 64 Cell surface molecule
component
NM_001172856
gtgatgtgtgaaactctgcaagaa
CFL1 Cofilin 1 ttccaaggatgccatcaaaaa 3 and
4
65 Actin modification ENSCPOT00000008138
cgtagcaatttgcctgtaattcg
CLTC Clathrin caattcgttttcaggagcatctc 1 and
2
64 Coated vesicle formation protein
ENSCPOT00000005567
aagccaatgtttgctgggtta
CTBP1 C-terminal binding protein 1 tctcatcaacgacttcactgtcaa 4 and 5
61 Transcriptional repressor phosphoprotein
ENSCPOT00000019529
ggccgtgttcaccaggaa
GAPDH Glyceraldehyde-3-phosphate dehydrogenase
tcagagggctccctcaaag 2 70 Glycolytic enzyme From ref. [30]
cgctgttgaagtcacaggac
HMBS Hydroxymethyl-bilane synthase cctgggttggcagaacaga 9 and 10
66 Heme biosynthesis ENSCPOT00000006534
tggcccacagcatacatacag
PPIB Cyclophilin B gggcctaaagtcaccgtcaa 1 and
2
63 Protein folding catalyst ENSCPOT00000000258
ccggcccacatcttcatct
RPLP0 Ribosomal protein, large, P0 atgctgctggccaataaggt 3 and 4
64 Protein synthesis ENSCPOT00000019555
tgacttcacatggtgcaatgg
SDHA Succinate dehydrogenase, subunit A gatgccatccattacatgacaga 4 and 5
67 Citric acid cycle enzyme DQ402978
gcatgccataattttctagctcaa
TBP TATA-binding protein acttgacctaaagacaattgcacttc 5 and 6
65 Transcription factor ENSCPOT00000001200
cagcaaaccgcttgggatta
TFRC Transferrin receptor gaccttccagtcttcggtcatg 8 and 9
68 Iron transport S81327
aaagaagggaacccaggtgtataa
TPT1 Tumor protein, translationally controlled 1
ccttgctaatttcaaaaactatcagttc 4 and 5
67 EU330893
agcaaccatgccatctggat
PTGS2 Cyclooxygenase-2 ctgcgcaatgcaatcatga 3 and
4 67
Prostaglandin synthesis Y07896
Hercules, CA), 900 nM of each primer and 30 ng cDNA (assuming a 1:1 reversed transcription reaction effi-ciency) in 19μl reactions in MicroAmpWOptical 384-Well Reaction Plates (part no. 4309849, Applied Biosystems, Carlsbad, CA) on a 7900HT Fast Real-Time PCR System (Applied Biosystems, Carlsbad, CA). The cycling pro-gram was: stage A 50°C for 2 min; stage B (denaturation) 95°C for 10 min; stage C (cycling) 95°C for 15 sec and then 60°C for 1 min repeated 40 times, and stage D (dissociation) 95°C for 15 sec then 60°C for 15 sec and a final 95°C for 15 sec. All samples were run in triplicate and each primer pair was validated using a 7 point 5-fold dilution series of guinea pig liver cDNA (50–0.0032 ng per reaction) and no template controls.
Analyses of qPCR results using geNorm and BestKeeper Each RNA sample was analyzed twice from the reversed transcriptase step and on, and the threshold cycle (Cq) value for each sample was determined for all primer pairs. The mean Cq of triplicates for each sample run was then used for input in geNorm v3.5 and BestKeeper v1 applets, and the respective stability values were auto-matically calculated as described [3,21].
Abbreviations
qPCR: Quantitative real-time PCR; NTC: No template control; Cq: Threshold cycle; ACTB:β-actin; ATP5B: ATP synthase F1 complexβsubunit; ATP6: ATPase 6; B2M:β2-microglobulin; CFL1: Cofilin 1; CLTC: Clathrin; PTGS2: Cyclooxygenase-2; CTBP1: C-terminal binding protein 1;
GAPDH: Glyceraldehyde-3-phosphate dehydrogenase; HMBS: Hydroxymethyl-bilane synthase; PPIB: Cyclophilin B; RPLP0: Ribosomal protein large P0; SDHA: Succinate dehydrogenase subunit A; TBP: TATA-binding protein; TFRC: Transferrin receptor; TPT1: Tumor protein translationally controlled 1; FBS: Fetal bovine serum.
Competing interests
All authors declare that they have no competing interest.
Authors’contributions
AL conceived the study and participated in its design, participated in tissue retrieval and cell culture, performed all qPCRs, and drafted the manuscript. DM participated in cell culture and performed the computer and statistical analyses. RAW participated in the design of the study, participated in tissue retrieval, and helped draft the manuscript. All authors read and approved the final manuscript.
Acknowledgements
The authors like to thank Dr. Matthew Riegel for providing expertise and advice regarding animal care and euthanasia. This work was supported by NIH grant HD011149.
Received: 12 July 2012 Accepted: 24 January 2013 Published: 30 January 2013
References
1. Tricarico C, Pinzani P, Bianchi S, Paglierani M, Distante V, Pazzagli M, Bustin SA, Orlando C:Quantitative real-time reverse transcription polymerase chain reaction: normalization to rRNA or single housekeeping genes is inappropriate for human tissue biopsies.Anal Biochem2002, 309(2):293–300.
2. Huggett J, Dheda K, Bustin S, Zumla A:Real-time RT-PCR normalisation; strategies and considerations.Genes Immun2005,6(4):279–284. 3. Vandesompele J, De Preter K, Pattyn F, Poppe B, Van Roy N, De Paepe A,
Speleman F:Accurate normalization of real-time quantitative RT-PCR
data by geometric averaging of multiple internal control genes. Genome Biol2002,3(7):RESEARCH0034.
4. Havelock JC, Keller P, Muleba N, Mayhew BA, Casey BM, Rainey WE, Word RA:Human myometrial gene expression before and during parturition. Biol Reprod2005,72(3):707–719.
5. Cabrol D, Carbonne B, Bienkiewicz A, Dallot E, Alj AE, Cedard L:Induction of labor and cervical maturation using mifepristone (RU 486) in the late pregnant rat. Influence of a cyclooxygenase inhibitor (Diclofenac). Prostaglandins1991,42(1):71–79.
6. Mahendroo MS, Porter A, Russell DW, Word RA:The parturition defect in steroid 5a-reductase type 1 knockout mice is due to impaired cervical ripening.Mol Endocrinol1999,13(6):981–992.
7. Uldbjerg N, Ekman G, Malmstrom A, Olsson K, Ulmsten U:Ripening of the human uterine cervix related to changes in collagen,
glycosaminoglycans, and collagenolytic activity.Am J Obstet Gynecol 1983,147(6):662–666.
8. Aronsson A, Ulfgren AK, Stabi B, Stavreus-Evers A, Gemzell-Danielsson K:The effect of orally and vaginally administered misoprostol on inflammatory mediators and cervical ripening during early pregnancy.
Contraception2005,72(1):33–39.
9. Sennstrom MK, Brauner A, Lu Y, Granstrom LM, Malmstrom AL, Ekman GE: Interleukin-8 is a mediator of the final cervical ripening in humans. Eur J Obstet Gynecol Reprod Biol1997,74(1):89–92.
10. Ekman-Ordeberg G, Stjernholm Y, Wang H, Stygar D, Sahlin L:Endocrine regulation of cervical ripening in humans–potential roles for gonadal steroids and insulin-like growth factor-I.Steroids2003,68(10–13):837–847. 11. Stjernholm-Vladic Y, Stygar D, Mansson C, Masironi B, Akerberg S, Wang H,
Ekman-Ordeberg G, Sahlin L:Factors involved in the inflammatory events of cervical ripening in humans.Reprod Biol Endocrinol2004,2(1):74. 12. Granstrom L, Ekman G, Ulmsten U, Malmstrom A:Changes in the
connective tissue of corpus and cervix uteri during ripening and labour in term pregnancy.Br J Obstet Gynaecol1989,96(10):1198–1202. 13. Osmers RG, Adelmann-Grill BC, Rath W, Stuhlsatz HW, Tschesche H, Kuhn W:
Biochemical events in cervical ripening dilatation during pregnancy and parturition.J Obstet Gynaecol (Tokyo 1995)1995,21(2):185–194.
14. Peckham J, Gad S:The Guinea Pig. InAnimal Models in Toxicology. 2nd edition. Edited by Gad S. Boca Raton: CRC Press; 2006:333–419.
15. Uchiyama T, Sakuta T, Kanayama T:Regulation of hyaluronan synthases in mouse uterine cervix.Biochem Biophys Res Commun2005,327(3):927–932. 16. Li XH, Kishore AH, Dao D, Zheng W, Roman CA, Word RA:A novel isoform of
microphthalmia-associated transcription factor inhibits IL-8 gene expression in human cervical stromal cells.Mol Endocrinol2010,24(8):1512–1528. 17. Word RA, Li XH, Hnat M, Carrick K:Dynamics of cervical remodeling
during pregnancy and parturition: mechanisms and current concepts. Semin Reprod Med2007,25(1):69–79.
18. Tanic N, Perovic M, Mladenovic A, Ruzdijic S, Kanazir S:Effects of aging, dietary restriction and glucocorticoid treatment on housekeeping gene expression in rat cortex and hippocampus-evaluation by real time RT-PCR.J Mol Neurosci2007,32(1):38–46.
19. Schroder AL, Pelch KE, Nagel SC:Estrogen modulates expression of putative housekeeping genes in the mouse uterus.Endocrine2009, 35(2):211–219.
20. Craythorn RG, Girling JE, Hedger MP, Rogers PA, Winnall WR:An RNA spiking method demonstrates that 18S rRNA is regulated by
progesterone in the mouse uterus.Mol Hum Reprod2009,15(11):757–761. 21. Pfaffl MW, Tichopad A, Prgomet C, Neuvians TP:Determination of stable
housekeeping genes, differentially regulated target genes and sample integrity: BestKeeper–Excel-based tool using pair-wise correlations. Biotechnol Lett2004,26(6):509–515.
22. Andersen CL, Jensen JL, Orntoft TF:Normalization of real-time quantitative reverse transcription-PCR data: a model-based variance estimation approach to identify genes suited for normalization, applied to bladder and colon cancer data sets.Cancer Res2004,64(15):5245–5250. 23. de Kok JB, Roelofs RW, Giesendorf BA, Pennings JL, Waas ET, Feuth T,
Swinkels DW, Span PN:Normalization of gene expression measurements in tumor tissues: comparison of 13 endogenous control genes.Lab Invest 2005,85(1):154–159.
25. Laborda J:36B4 cDNA used as an estradiol-independent mRNA control is the cDNA for human acidic ribosomal phosphoprotein PO.Nucleic Acids Res1991,19(14):3998.
26. Masiakowski P, Breathnach R, Bloch J, Gannon F, Krust A, Chambon P: Cloning of cDNA sequences of hormone-regulated genes from the MCF-7 human breast cancer cell line.Nucleic Acids Res1982,10(24):7895–7903. 27. Giudice LC, Lamson G, Rosenfeld RG, Irwin JC:Insulin-like growth factor-II (IGF-II) and IGF binding proteins in human endometrium.Ann N Y Acad Sci1991,626:295–307.
28. Daud II, Scott ME:Validation of reference genes in cervical cell samples from human papillomavirus-infected and -uninfected women for quantitative reverse transcription-PCR assays.Clin Vaccine Immunol2008, 15(9):1369–1373.
29. Piehler AP, Grimholt RM, Ovstebo R, Berg JP:Gene expression results in lipopolysaccharide-stimulated monocytes depend significantly on the choice of reference genes.BMC Immunol2010,11:21.
30. Dodrill MW, Beezhold DH, Meighan T, Kashon ML, Fedan JS: Lipopolysaccharide increases Na(+), K(+)-pump, but not ENaC, expression in guinea-pig airway epithelium.Eur J Pharmacol2011, 651(1–3):176–186.
31. McKendry AA, Palliser HK, Yates DM, Walker DW, Hirst JJ:The effect of betamethasone treatment on neuroactive steroid synthesis in a foetal Guinea pig model of growth restriction.J Neuroendocrinol2010, 22(3):166–174.
doi:10.1186/1756-0500-6-34
Cite this article as:Lindqvistet al.:The impact of reference gene selection in quantification of gene expression levels in guinea pig cervical tissues and cells.BMC Research Notes20136:34.
Submit your next manuscript to BioMed Central and take full advantage of:
• Convenient online submission
• Thorough peer review
• No space constraints or color figure charges
• Immediate publication on acceptance
• Inclusion in PubMed, CAS, Scopus and Google Scholar
• Research which is freely available for redistribution