1 Effects of biochar and activated carbon amendment on maize growth and the uptake and measured 1
availability of polycyclic aromatic hydrocarbons (PAHs) and potentially toxic elements (PTEs) 2
Aoife Brennan1*, Eduardo Moreno Jiménez2, José A. Alburquerque3, Charles W. Knapp1, Christine 3
Switzer1 4
1
Department of Civil and Environmental Engineering, University of Strathclyde, Glasgow, UK 5
2
Departamento de Química Agrícola, Universidad Autónoma de Madrid, 28049 Madrid, Spain 6
3
Área de Ecología, Departamento de Botánica, Ecología y Fisiología Vegetal, Universidad de 7
Córdoba, 14071 Córdoba, Spain 8
* Corresponding author: [email protected] 9
Abstract 10
With the aim of investigating the effects of carbonaceous sorbent amendment on plant health and 11
end point contaminant bioavailability, plant experiments were set up to grow maize (Zea mays) in 12
soil contaminated with polycyclic aromatic hydrocarbons (PAHs) and metals. Maize and pine derived 13
biochars, as well as a commercial grade activated carbon, were used as amendments. Plant growth 14
characteristics, such as chlorophyll content and shoot to root biomass, improved with sorbent 15
amendment to varying extents and contaminant uptake to shoots was consistently reduced in 16
amended soils. By further defining the conditions in which sorbent amended soils successfully 17
reduce contaminant bioavailability and improve plant growth, this work will inform field scale 18
remediation efforts. 19
Capsule 20
Biochar and activated carbon reduce PAH and PTE uptake to maize plants to varying extents and 21
improve plant growth. 22
Keywords: Biochar; PAHs; PTEs; bioavailability; POM 23
1. Introduction 24
Contamination arising from industrial and other anthropogenic activities has led to widespread 25
2 potential to affect entire ecosystems as well as to pose risk to human health. Recent advances in the 27
understanding of contaminant behaviour in soils have driven a greater focus on bioavailable 28
fractions of contaminants: how to assess contaminant availability and how to reduce the 29
bioavailable fraction. 30
The use of carbonaceous sorbents as soil amendments has the potential to reduce contaminant 31
bioavailability (Ahmad et al., 2014; Beesley et al., 2011; Denyes et al., 2013; Hale et al., 2012; Karami 32
et al., 2011; Marchal et al., 2014). This trend comes from a greater understanding of sorption 33
dynamics and organic contaminant relationships with carbonaceous fractions in soils and sediments 34
(Cornelissen et al., 2005; Luthy et al., 1997; Pignatello and Xing, 1995). Both activated carbon and 35
biochar amendments have demonstrated positive results. Plant establishment can be enhanced by 36
amendment and contaminant availability can be reduced (Fellet et al., 2014; Jakob et al., 2012), but 37
results vary widely because of the heterogeneous nature of different biochars. 38
The environmental impact of the sorbents themselves is another important consideration if 39
remediation practices are to be ultimately sustainable. A life cycle assessment (LCA) study on the use 40
of activated carbons (AC) for sediment remediation found that coal derived AC had a higher 41
environmental footprint than biomass derived AC (coconut waste) when energy and resource use 42
were factored into the analysis (Sparrevik et al., 2011). If the activation step is removed from the 43
process (e.g. steam or phosphoric acid activation to increase porosity and surface area), biochars are 44
also of a lower cost than activated carbons, US$51 - 386 per tonne for biochars (Meyer et al., 2011) 45
compared to around US$2200 per tonne for activated carbon (Ghosh et al., 2011), although prices 46
are highly dependent on market fluxes. These LCA and cost factors highlight the potential for biochar 47
use in remediation, if its efficacy can be established. 48
Carbonaceous sorbent amendment may assist phytostabilisation as part of an integrated in situ 49
remediation approach. Biochar research in the agriculture domain has shown that biochar has the 50
capacity to alter soil physical and chemical properties , leading to potentially beneficial effects on 51
3 degraded soils aims to establish plant cover that primes ecosystem succession and concomitantly 53
reduces soil erosion and contaminant mobility on a degraded site. Biomass crop generation on 54
degraded sites is a proposed solution for deriving commercial benefit from a phytomanagement 55
approach (Houben et al., 2013; Van Slycken et al., 2013). Maize (Zea mays) is a potential crop choice 56
due to its quick growth cycle and high biomass production, having previously been used to 57
investigate contaminant impact on plant health and growth (Lin et al., 2008). However, a greater 58
mechanistic understanding of the effects of amendment on contaminant availability and plant 59
establishment, as well as interactions between contaminants, plants and soils is required before full 60
scale field application. 61
In this paper, we present results from a 21 day pot trial growing maize in an experiment designed to 62
compare the efficacy of two different biochars and a commercial activated carbon in reducing the 63
negative effects of soil contaminants on plant establishment. Based on the hypothesis that the 64
carbonaceous sorbents would reduce contaminant availability to plants and in the soil and improve 65
plant growth overall, polycyclic aromatic hydrocarbon (PAH) and potentially toxic element (PTE) 66
concentrations were assessed in the soil, soil porewater and plants across treatments. 67
2. Methods 68
2.1 Experimental set up 69
Soil was obtained from a former manufactured gas plant site in the UK and from an abandoned mine 70
site in Spain. Both soils were air dried, sieved to 4 mm and mixed together in the ratio 1:1 in order to 71
obtain a soil with both organic and inorganic contaminants. The resulting soil was classified as a 72
loam (43% sand, 47% silt and 10% clay), with a pH of 7.1 and 7.1% organic matter content. The soil 73
was contaminated with As, Cu and Zn (3604, 276 and 2226 mg kg-1, respectively) and moderate 74
levels of 13 USEPA priority PAHs (those with three or more benzene rings, 68.6 mg kg-1). 75
Two biochars, derived from the slow pyrolysis of pine woodchip (PB) and maize stubble (MB), were 76
used to amend the contaminated soil in order to investigate feedstock differences and were lightly 77
4 of León, with a 15 minute residence time in the reactor (Natural Resources Institute, Spain). Biochar 79
properties are summarised in Table 1. Methods used for characterising the biochar properties are 80
fully described in Brennan et al. (2014). The activated carbon (AC) used in the experiments was in 81
granular form and branded as Norit® GAC 1240 (Norit, USA), with the following properties: bulk 82
density 0.49 g cm-3, specific surface area 1175 m2 g-1,pH 10.3, effective particle size 0.65mm (range 83
[image:4.595.59.440.297.705.2]0.42mm-1.7mm) (data provided by manufacturer). 84
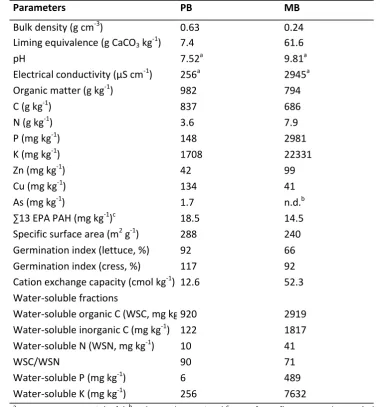
Table 1 Characteristics (on a dry weight basis) of the two biochars (PB: pine woodchip biochar, MB: 85
maize stubble biochar). 86
Parameters PB MB
Bulk density (g cm-3) 0.63 0.24
Liming equivalence (g CaCO3 kg-1) 7.4 61.6
pH 7.52a 9.81a
Electrical conductivity (µS cm-1) 256a 2945a
Organic matter (g kg-1) 982 794
C (g kg-1) 837 686
N (g kg-1) 3.6 7.9
P (mg kg-1) 148 2981
K (mg kg-1) 1708 22331
Zn (mg kg-1) 42 99
Cu (mg kg-1) 134 41
As (mg kg-1) 1.7 n.d.b
∑13 EPA PAH (mg kg-1)c 18.5 14.5
Specific surface area (m2 g-1) 288 240
Germination index (lettuce, %) 92 66
Germination index (cress, %) 117 92
Cation exchange capacity (cmol kg-1) 12.6 52.3 Water-soluble fractions
Water-soluble organic C (WSC, mg kg-1920 ) 2919 Water-soluble inorganic C (mg kg-1) 122 1817
Water-soluble N (WSN, mg kg-1) 10 41
WSC/WSN 90 71
Water-soluble P (mg kg-1) 6 489
Water-soluble K (mg kg-1) 256 7632
a
water extract 1:10 (w/v) b n.d. not determined cPAHs from flourene to benzo (g,h,i) perylene 87
5 Four soil treatments were prepared: contaminated soil only (C), soil plus 3% PB (PB), soil plus 3% MB 89
(MB) and soil plus 3% AC (AC). Each pot was prepared with 500 g (+/- 0.5 g) of soil plus 15 g (+/- 0.01 90
g) biochar or AC in the relevant treatments and mixed thoroughly manually together and then with 91
100 g (+/-0.1 g) of pre-cleaned pebbles (size range 20-25mm). The pebbles were added in order to 92
give the soil structure and minimise compaction and anoxic conditions during the experiment. Each 93
mixture was then added to a plant pot containing 100 g of pebbles at the base, watered to 60% of its 94
water holding capacity (WHC), weighed and left to equilibrate for one week before planting. 95
Eight replicates for each soil treatment were prepared, resulting in a total of 32 plant pots. Within 96
the eight replicates for each soil treatment, four were planted with maize germinants (+P), and four 97
left unplanted (-P) to in order to compare differences between planted and unplanted soil treatment 98
scenarios. As such, results are discussed according to the following treatment groups: C-P, C+P, PB-99
P, PB+P, MB-P, MB+P, AC-P, AC+P. 100
Maize seeds were washed and pre-germinated before planting to ensure only viable seeds were 101
used. They were washed by sonicating in 10% sodium hypochlorite for 30 minutes and then in 102
deionised water for 30 minutes. They were then placed on tissue paper moistened with deionised 103
water and several drops of calcium sulphate (1.5 mM) and incubated at 28°C for 72 hours for 104
germination. 105
After one week, four pots from each of the treatment scenarios were planted with two maize 106
germinants per pot and all pots were moved to a controlled growth chamber for a 21 day period 107
(with a day/night cycle of 13/11 hours, temperature/relative humidity 25°C/40% by day and 108
20°C/60% by night and light intensity 520µmol m-2 s-1). 60% WHC was maintained in the pots 109
throughout the experiment. 110
2.2 Sampling regime and methods 111
2.2.1 Plant extraction and analysis 112
Shoots were cut 1cm above the soil surface. Roots were carefully removed from the soil, shaken 113
6 gently patting dry with tissue. Plant shoots and roots were weighed for fresh and dry biomass before 115
and after freeze drying. Freeze dried samples were extracted and analysed for PTEs and PAHs 116
according to the methods described in sections 2.2.2 and 2.2.3. 117
Fresh shoot material was analysed for chlorophyll content. A 5mL solution of 80% acetone was 118
added to 0.1g shoot tissue and ground with a mortar and pestle, which was then filtered into a 15mL 119
centrifuge tube and the process repeated twice more. Chlorophyll a, chlorophyll b and total 120
carotenoids were then determined by UV spectrophotometry at 663nm, 645nm and 480nm. 121
(Wellburn, 1994) 122
2.2.2 Polycyclic aromatic hydrocarbons (PAHs) 123
At the end of the experiment all soil and amended soil samples were sieved to < 2 mm prior to 124
extraction and analysis. Total and freely dissolved PAH concentrations were determined at the end 125
of the experiment for all samples. Total were determined by hexane-acetone extraction (Gomez-126
Eyles et al., 2011) while freely dissolved concentrations were determined by aqueous equilibrium 127
experiments using polyoxymethylene (POM) samplers (Jonker and Koelmans, 2001). 128
For total extractions, 4g of soil or soil + amendment with surrogate solution added (fluorene-D10, 129
phenanthrene-D10, fluoranthene-D10, chrysene-D12) was extracted twice with 10mL 1:1 hexane-130
acetone for 2 hours per extraction on an orbital shaker at 20°C (Gomez-Eyles et al., 2011). The 131
extractant was filtered with Whatman filter paper grade GF/F. Each vial was then rinsed twice with 132
10mL solvent, the resulting 40 mL was evaporated to 2mL, exchanged to cyclohexane and cleaned 133
up with a silica gel column topped with sodium sulphate (after EPA method 3630C). A 1mL aliquot of 134
the resulting eluate was analysed by GC-MS following addition of internal standards (1-135
fluoronaphthalene, p-terphenyl-D14, benzo(a)pyrene-D12). GC-MS conditions were as follows: 136
Trace Ultra GC coupled with DSQ II (Thermo Scientific); splitless mode; column DB-5MS 30m x 137
0.25mm x 0.25µm; initial temperature 45°C, hold 2 min, ramp 2°C per min to 80°C, then ramp 4°C 138
7 Aqueous equilibrium experiments were used to measure freely dissolved fractions of PAHs in the soil 140
at the end of the experiment. Polyoxymethylene (POM) passive samplers in strips 76 µm thick 141
(POM-76) (CS Hyde, IL, USA) were shaken with soil aliquots slurried with 40 mg L-1 sodium azide 142
solution for 30 days (Gomez-Eyles et al., 2011; Jonker and Koelmans, 2001). After 30 days, POM 143
samplers were cleaned with damp tissue, phenanthrene-D10 surrogate standard was added and the 144
POM was extracted three times with 20mL 1:1 hexane-acetone solution for 24:2:2 hours. The 145
resulting 60mL solution was concentrated to 2mL under nitrogen and cleaned (after EPA method 146
3630C). The resulting eluate was concentrated to 1mL, at which point internal standard for GC-MS 147
analysis was added as for totals extractions. KPOM values used for calculating Cw (where Cw =
148
CPOM/KPOM) were taken from literature derived values for POM-76 (Endo et al., 2011).
149
Root and shoot samples were extracted three times by sonicating approximately 0.1g of tissue with 150
surrogate solution added (as for total soil extractions) in 20mL 1:1 hexane: acetone for 2, 0.5 and 0.5 151
hours. Samples were then cleaned and analysed as for totals in soil and POM extractions. 152
Pure biochar (PB, MB) samples were extracted in triplicate by accelerated solvent extraction (Dionex 153
ASE 350) at 100°C by sequential extraction. 1 g biochar sample was ground to a fine powder, mixed 154
with diatomaceous earth into a 5 mL cell and extracted twice with toluene. Toluene has previously 155
been shown to be a suitable extraction solvent for these materials (Hilber et al., 2012). Surrogate 156
recovery was monitored by the addition of phenanthrene-D10, anthracene-D10, and chrysene-D12. 157
In-cell clean-up was performed using 2g activated silica gel (Sigma Aldrich) at the bottom of the ASE 158
extraction cell in addition to a glass fibre filter (Dionex). Extracts were evaporated under a gentle 159
stream of nitrogen to 1 mL, filtered to 0.2 µm with glass syringes using PTFE syringe filters and 160
analysed by GC-MS as described above. 161
Surrogate recovery exceeded 62% for all total soil extractions data presented (median 98%, mean 162
91%, rsd 18%). For POM-76 extractions, surrogate recovery exceeded 73% (median 100%, mean 163
99%, rsd 7%). For plant extractions, recovery exceeded 64% (median 88%, mean 92%, rsd 27%). 164
8 2.2.3 Potentially toxic elements (PTEs)
166
Following autoclaving (Lozano-Rodriguez et al., 1995) and ammonium sulphate extraction (Vázquez 167
et al., 2008), pseudo-total and extractable As in the treatments were determined by atomic 168
fluorescence spectroscopy (Millennium Excalibur, PS Analytical). Pseudo-total and extractable Cu 169
and Zn were determined by atomic absorption spectroscopy (AA800, Perkin Elmer). 170
For pseudo-total soil concentrations, 0.5 g of soil was transferred into 50 ml autoclave bottles to 171
which 6 ml of MilliQ water, 6 ml of 65% HNO3 and 4 ml of 33% H2O2 were added. The autoclave was
172
set at pressure 1.5 kg cm-2 (147kPa) and at temperature 125°C for 30 minutes, samples were left to 173
cool, then filtered and made up to 50 mL (Lozano-Rodriguez et al., 1995). 174
Total plant concentrations were determined by weighing 0.1 g dried plant tissue into 20 ml 175
autoclave bottles to which 2 ml of MilliQ water, 1.5 ml of 65% HNO3 and 1 ml of 33% H2O2 were
176
added. The samples were then autoclaved under the conditions described in the previous paragraph, 177
cooled, then filtered and made up to 5 mL. 178
Extractable PTEs in the soils were determined by extracting 1.5 g of soil with 15 ml of (NH4)2SO4 0.1M
179
in 50 ml tubes and shaking for four hours at 180 rpm. The samples were then filtered and 0.1 ml of 180
HNO3 was added (Vázquez et al., 2008).
181
2.3 Statistical and data analysis 182
Statistical analyses were carried out on SPSS. Data were checked to fit the hypothesis of normality 183
and homoscedasticity; log transformation was applied to data as necessary. Hypotheses were tested 184
with ANOVA. Tukey’s post-hoc test was used for mean comparisons of the homoscedastic data. 185
Games-Howell’s test was used for the comparisons of heteroscedastic data. 186
BSAFs (biota-soil accumulation factor) were calculated for the PAH concentrations in maize shoots 187
by use of the following equation: CPAH shoot/(CPAH soil*fOM), where shoot PAH concentrations for each
188
treatment were divided by the soil PAH concentrations (from the control soils) normalised to the 189
soil organic matter (OM) fraction (for each treatment) (Jakob et al., 2012). 190
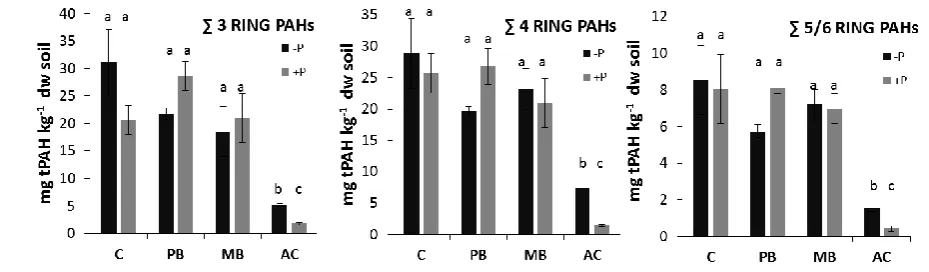
9 3.1 Soil PAH concentrations
192
PAHs were grouped according to the number of benzene rings in their structure, due the similar 193
statistical patterns observed from analysis of the individual compounds: 3 ring PAHs (fluorene, 194
phenanthrene, anthracene), 4 ring PAHs (fluoranthene, pyrene, benzo(a)anthracene, chrysene, 195
benzo(b)flouranthene, benzo(k)flouranthene) and 5/6 ring PAHs (benzo(a)pyrene, 196
dibenz(a,h)anthracene, indeno(a)pyrene, benzo(ghi)perylene). Hexane-acetone extracted 197
concentrations are presented in Fig S1 of Supporting Information (SI). Observed reductions in the 198
amended soils compared to the unamended soil are considered to represent the sorbent bound 199
PAHs, due to the higher black carbon content of carbonaceous sorbents, which affected PAH 200
extractability by hexane-acetone and has also been noted for other solvents (n-heptane) (Beesley et 201
al., 2010; Hale et al., 2012). As such, total PAHs in the soil are considered to be the total derived 202
from the unamended soil extraction plus the PAHs native to the biochars and activated carbon for 203
the relevant amendments, although this sorbent PAH input is not significant. 204
3.2 Effect of sorbent amendment on PAH bioavailability and plant uptake 205
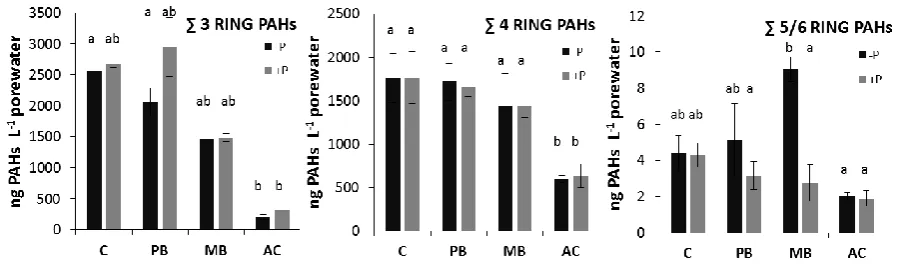
POM extractions suggested there were no difference in porewater PAH concentrations between 206
unplanted and planted replicates within amendment groupings (Fig. 1), apart from the 5/6 ring PAH 207
class where MB-P had significantly higher porewater PAHs than MB+P. The results for the 3 and 4 208
ring PAHs is in contrast with the findings by Marchal et al (2014), where the unplanted soil had 209
higher anthracene, fluoranthene and pyrene values than the planted soil, while phenanthrene did 210
not differ between the two scenarios. No data is available from this study for the differences 211
between unplanted and planted amended soils for comparison. A number of possible reasons could 212
account for the differences observed in our study, from the use of spiked soil in the cited study 213
versus the field contaminated soil used in our study, to the different timescales employed, 60 days in 214
10 216
Fig. 1 Porewater concentrations of PAHs in planted (+P) and unplanted (-P) contaminated soil with 217
different biochar treatments, C: control, PB: pine woodchip biochar amended soil, MB: maize husk 218
biochar amended soil, AC: activated carbon amended soil. Mean ± SE (n=4).Different letters signify 219
statistical differences between treatments at p<0.05. 220
221
Assessing porewater PAHs according to amendment type, biochar had no effect on porewater 222
concentrations for 3 and 4 ring PAHs, while AC showed a significant reduction in porewater 223
concentrations compared the control. For 5/6 ring PAHs, none of the studied amendments reduced 224
the porewater concentrations. Indeed, the MB-P demonstrated a significant increase in porewater 225
concentrations compared to the controls (Fig 1). While this increase may partly be accounted for by 226
the native PAHs in the MB biochar (Table 1, 14.5 mg kg-1 ∑13 EPA PAH), it is unlikely (Freddo et al., 227
2012). The observed increase is likely to have been caused by other factors and this increase is no 228
longer observed when plants are in the system (see MB-P vs. MB+P in Fig. 1). Possible factors are 229
increased dissolved organic carbon fluxes with biochar addition or 5/6 ring PAH mobilisation due to 230
interactions with inorganic or organic co-contaminants. 231
The AC results reflect findings from other short term studies where rapidly desorbing fraction of 232
lower molecular weight PAHs bound quickly to the studied GAC amendment compared to the 233
unamended control soil (Brändli et al., 2008), while the heavier 5/6 ring PAHs showed limited 234
differences between controls and amended soils in the short term. The cited study had similar 235
11 highlighted effective reduction of freely dissolved heavier PAHs by GAC (Oen et al., 2011). Sorbent 237
particle size is another potential factor for the biochar and AC carbon results in this study, as 238
powdered activated carbon (PAC) has been shown to be more effective in the short term to mid-239
term reduction of porewater PAHs (Brändli et al., 2008; Hale et al., 2012). Nonetheless, in the longer 240
term GAC and biochars may be more beneficial for overall effects on plant growth and soil biota, 241
perhaps partially due to the larger particle sizes, although this merits further study (Gomez-Eyles et 242
al., 2013; Jakob et al., 2012; Lehmann et al., 2011) 243
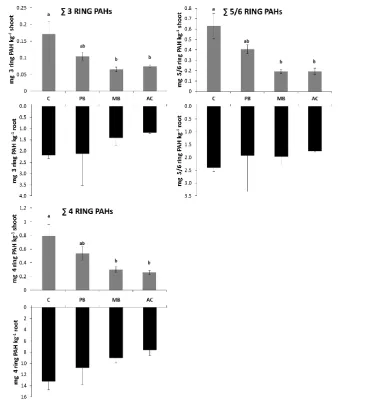
Root PAH concentrations were not significantly altered by PB, MB or AC (Fig 2). PAH shoot uptake 244
was significantly reduced by MB and AC for all PAH classes, but not by PB (Fig 2). It is not clear 245
exactly why PAH shoot uptake was reduced in MB amended soils and not PB amended soils, and 246
demonstrates that shoot uptake may be explained by differences in biochar properties creating 247
differences in soil conditions. Differences in EC, CEC, soluble NPK, bulk densities (Table 1) may be 248
contributing factors, but the influence of parameters not measured, such as particle size 249
distributions, oxygen contents cannot be ruled out (Atkinson et al., 2010). This trend in shoot uptake 250
was supported by the BSAF data, which showed significant reductions in BSAF for MB and AC 251
compared to the control. PB reduced BSAF by 33% (+/-5%) for 3 ring PAHs (p=0.063), 25% (+/-9%) for 252
4 ring PAHs (p=0.202), 27% (+/-7%) for 5 ring PAHs (p=0.138). MB reduced BSAF by 58% (+/-5%) for 3 253
ring PAHs (p<0.01), 57% (+/-7%) for 4 ring PAHs (p<0.05), 65% (+/-7%) for 5 ring PAHs (p<0.001). AC 254
reduced BSAF by 42% (+/-4%) for 3 ring PAHs (p<0.05), 44% (+/-14%) for 4 ring PAHs (p<0.05), 58% 255
(+/-6%) for 5 ring PAHs (p<0.001). These findings demonstrate the heterogeneous results produced 256
by biochars from different feedstocks and the activated carbon data support the results of other 257
12 259
Fig. 2 PAH concentrations in shoots and roots of maize plants growing contaminated soils with 260
different biochar treatment, C: control, PB: pine woodchip biochar amended soil, MB: maize husk 261
biochar amended soil, AC: activated carbon amended soil. Mean ± SE (n=2-4, 2 reps in the case of C 262
and PB root data, 3-4 reps for all other data). Different letters mean statistical differences between 263
shoot groups at p<0.05, no root data showed statistically significant differences. 264
265
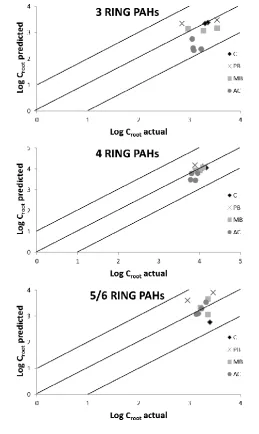
Fig 3 explores the relationship between actual root uptake (Table S1) and predicted values using 266
POM-derived data. A sorption prediction model proposed by Zhang and Zhu (2009) that accounts for 267
both carbohydrate and lipid PAH partitioning to plant roots was assessed for its efficacy in predicting 268
[image:12.595.71.442.70.490.2]13 porewater PAH concentrations to apply the model and the same POM approach was used here. 270
However, lipid and carbohydrate fractions were not determined for the maize plants used in this 271
experiment and so lipid and carbohydrate fractions of wheat roots and shoots (Li et al., 2005) were 272
used for the predictions presented (further details in SI). Despite this, the POM derived data 273
provides a fairly accurate assessment of root uptake in the current study with all data falling within 274
one order of magnitude on the log scale. AC PAH uptake to root is slightly under-predicted and PB 275
data is variable (Fig 3). 276
[image:13.595.67.327.261.696.2]277
Fig. 3 Predicting root concentrations using POM. Middle line indicates a 1:1 relationship while the 278
14 AC showed the greatest decrease in porewater concentrations, yet had similar PAH uptake to roots 280
and shoots as MB (Figs 1 and 2). It is not clear why this occurred, as previous studies investigating 281
PAH uptake to plants have demonstrated the importance of water soluble fractions in PAH root 282
uptake and subsequent translocation to shoots (Gao et al., 2011; Gao and Collins, 2009). As 283
suggested by other authors (Gomez-Eyles et al., 2011; Yoshitomi and Shann, 2001) interactions with 284
root exudates may affect uptake and in the current study, differences in root exudate production 285
among treatments may have affected uptake, although this would need to be confirmed by further 286
study. As we have shown (Fig 3), measuring PAHs in soil porewater and comparing to PAH plant 287
uptake may contribute to further understanding of the mechanisms behind PAH uptake to plants, 288
particularly with regards to amended soils. Even if is this does not prove to be the case, using POM 289
remains an inexpensive and straightforward method for monitoring changes in freely dissolved PAH 290
concentrations. 291
Taking both PAH porewater data and PAH plant uptake data into account, AC displayed consistent 292
improvements compared to controls. Nonetheless, MB proved effective at reducing PAH shoot 293
uptake and no detrimental effect on porewater concentrations was observed in the planted MB 294
soils. PB appears unsuitable for addressing problems with PAH contamination, at least in the short 295
term. 296
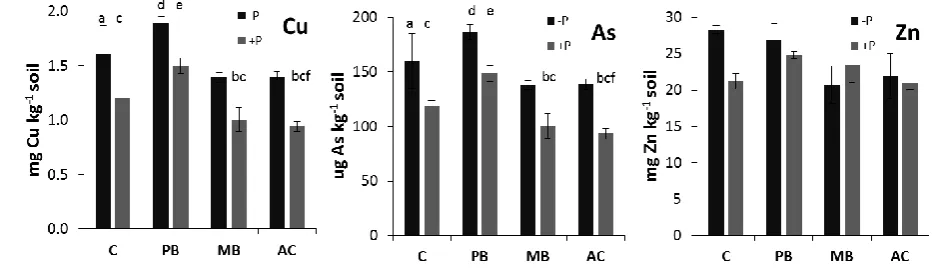
3.3 Effect of sorbent amendment on PTE extractability and plant uptake 297
Similarly to the PAH data, the ammonium sulphate extractions (Fig 4) highlighted no differences in 298
PTE mobility between unplanted and planted replicates of each treatment group. Across C, PB, MB 299
and AC amendment groups, Cu and As exhibited significant differences in some cases. Amendment 300
had no statistical effect on Zn behaviour in the soil. Cu and As in unplanted PB, MB and AC did not 301
differ significantly to the unplanted control. Similarly for the planted replicates, Cu and As were 302
unaffected by any of the amendments compared to the control. However, when comparing 303
15 reduced Cu and As compared to the unplanted control. Unplanted PB had significantly higher 305
concentrations of Cu and As compared to the planted control (Fig 4). 306
307
Fig. 4 Ammonium sulphate-extractable Cu, As and Zn in planted (+P) and unplanted (-P) 308
contaminated soil with different biochar treatments, C: control, PB: pine woodchip biochar amended 309
soil, MB: maize husk biochar amended soil, AC: activated carbon amended soil. Mean ± SE 310
(n=4).Letters signify statistical differences between treatments at p<0.05 and are divided into 311
independent group pairs, a vs. b, c vs. d, e vs. f, where no letters are indicated, no differences are 312
observed. 313
pH did not change across treatments in this study (data not shown), similar to previous work 314
(Brennan et al., 2014), and may explain the small changes in extractability observed. Studies that 315
observed increases in soil pH with biochar amendment also observed increases in porewater As 316
(Beesley et al., 2013) and decreases in porewater Cu linked to increase in amended soil alkalinity 317
over time (Karami et al., 2011). The differences observed compared to our study may be a result of 318
the different amendment approaches used (3% w/w basis in our study compared to a volumetric 319
approach). To our knowledge, no data is available on interactions of AC and PTEs in contaminated 320
soils, despite widespread use of AC for metal removal in the water filtration industry. 321
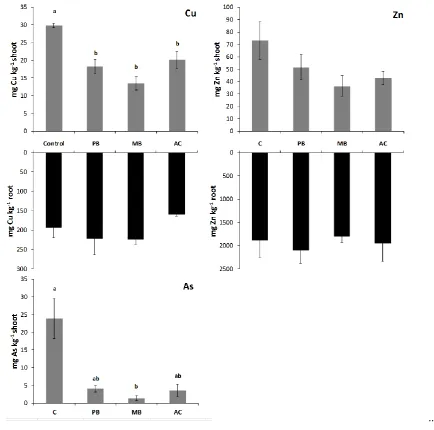
Root concentrations of Cu and Zn were not significantly affected by amendment (Fig 5), no data are 322
available for root As concentrations due to insufficient root material for arsenic analysis. All 323
[image:15.595.65.532.131.270.2]16 Shoot As was significantly reduced in MB compared to the control, but not in PB or AC. Shoot Zn 325
concentrations were statistically unaffected by amendment. 326
[image:16.595.66.501.123.553.2].. 327
Fig. 5 Cu, As and Zn concentrations in shoots and roots (insufficient sample for root As analysis) of 328
maize plants growing contaminated soils with different biochar treatment, C: control, PB: pine 329
woodchip biochar amended soil, MB: maize husk biochar amended soil, AC: activated carbon 330
amended soil. Mean ± SE (n=3-4). Different letters mean statistical differences between groups at 331
p<0.05, where there are no letters, no differences were observed. 332
17 The zinc data overall is in agreement with other studies with a similar level (<5%) of sorbent 334
amendment (Waqas et al., 2014) while studies with higher biochar quantities observed reductions in 335
zinc availability and plant uptake (Beesley et al., 2010). Reductions in copper extractability and 336
uptake are commonly observed (Karami et al., 2011; Waqas et al., 2014); the reductions in uptake 337
were observed in this study for all amendments but extractability data was more ambiguous. 338
Interestingly, ammonium sulphate extractable As did not increase with amendment in this study. 339
Increases in porewater As have been observed occasionally elsewhere (Beesley et al., 2013) and this 340
is likely related to experiment-specific conditions such as biochar quantity and feedstock properties, 341
as well as changes in soil pH and dissolved organic matter fluxes. 342
3.4 Plant parameters as affected by sorbent amendment application to contaminated soil 343
Maize root biomass (dry wt.) was unaffected by PB, MB or AC amendment. However, maize shoot 344
biomass significantly increased (p<0.05) for MB and AC compared to the control. This increase in 345
shoot biomass then led to higher shoot: root ratio for these treatments (p<0.05) (Fig 6), which 346
follows a similar pattern to the contaminant uptake data. This pattern similarity could be due to 347
different factors for MB and AC amended soils. The physicochemical properties of MB (Table 1) 348
compared to PB, particularly differences in soluble NPK, may have contributed to the improved 349
shoot growth for MB. Meanwhile, the capacity for AC to bind contaminants in soils reduced 350
contaminant availability (as indicated by shoot uptake- Fig 2) in a way not accounted for by the POM 351
18 353
Fig. 6 Plant biomass (g of dry weight per maize plant) in the contaminated soil with different 354
biochars, C: control, PB: pine woodchip biochar amended soil, MB: maize husk biochar amended soil, 355
AC: activated carbon amended soil. Mean ± SE (n=3-4). The shoot: root ratio was calculated and 356
shown on the bottom of the x axis. Different letters indicate statistical differences between groups 357
at p<0.05. 358
Chlorophyll a has previously been used as a biomarker to assess photosynthesis ability in plants and 359
the presence of both PAHs and PTEs has been shown to inhibit photosynthesis (Kummerová et al., 360
2006; Oleszczuk, 2008; Wang et al., 2013). Chlorophyll a content increased with PB and MB 361
amendment (p<0.05) compared to the control, but not with AC amendment. Chlorophyll b and total 362
carotenoids were unaffected by amendment. When taken as a total of the different components, 363
the pattern for total chlorophyll was as for chlorophyll a (Fig 7). Compared with the contaminant 364
data, where PB has no effect on any PAHs or As compared to the control, this data suggests that 365
chlorophyll content is less affected by reduction in PAH/As availability and PAH/As plant uptake than 366
by the reduction in copper uptake and extractability (see PB data in Figs 4 and 5). Nonetheless, other 367
factors related to differences in PB, MB and AC properties cannot be ruled out. 368
[image:18.595.73.456.67.329.2]19 369
Fig. 7 Chlorophyll a, chlorophyll b and total carotenoids expressed in ug g-1. Mean +/-SE (n=3-4). Soil 370
treatments correspond to C: control, PB: pine woodchip biochar amended soil, MB: maize husk 371
biochar amended soil, AC: activated carbon amended soil. Different letters indicate statistical 372
differences between groups at p<0.05. 373
3.5 Implications for using carbonaceous sorbent amendment on contaminated soils 374
Our findings show how carbonaceous sorbent amendment leads to an overall improvement in the 375
condition of contaminated soils and are supported by data from other studies (Beesley et al., 2010; 376
Fellet et al., 2014; Waqas et al., 2014). However, the short term effects noted in this study are 377
unlikely to reflect sorption kinetics in the longer term, particularly for the most hydrophobic organic 378
contaminants and this should be considered in future studies. Sorbent amendment improved 379
measured plant health parameters and reduced contaminant uptake and extractability to varying 380
extents. Although biomass in PB did not change significantly compared to the controls, plants had 381
higher chlorophyll contents and reduced Cu uptake. MB increased plant biomass parameters and 382
chlorophyll content, consistently reduced contaminant uptake to plants and metal extractability but 383
had ambiguous effects on PAHs in porewater. MB reduced BSAF to the greatest extent. AC improved 384
plant biomass production but did not increase chlorophyll levels, while consistently reducing organic 385
20 3.6 Conclusions
387
Having examined the effect of sorbents in the early stages of plant growth, both biochar and AC 388
warrant further investigation as part of an integrated phytomanagement approach for contaminated 389
sites. Taking LCA considerations into account, these further investigations would benefit from 390
comparisons of coconut shell-derived AC to different biochars in addition to coal-derived ACs. Our 391
results illustrate the suitability of certain types of biochar for aiding plant establishment in degraded 392
soils, giving comparable results to commercial AC. Biochars from different feedstock did produce 393
different results; nonetheless, no detrimental effect was observed as a result of its addition to the 394
soil. Activated carbon is an industry standard product but the choice over which amendment to use, 395
if at all, is likely to be based on site-specific requirements, cost considerations and the need for 396
result consistency. Given the heterogeneous behaviours of the different sorbents with regards to 397
both plant growth and how they affect the mobility of organic and inorganic contaminants, this 398
study highlights the necessity of treatability studies prior to using biochar or activated carbon in the 399
field, in order to fully understand amendment effects prior to field deployment. 400
401
Acknowledgements 402
Part of this work was carried out as part of a STSM awarded to the lead author by EU COST Action 403
TD1107 Biochar as an option for sustainable resource management. The biochars were produced in 404
the framework of the project “Proyecto Biocar: Estudio del Biocarbón como Sumidero de Carbono” 405
(IPT-440000-2010-8). We are grateful to Nik Johnson at ERS Remediation Ltd for supplying the PAH 406
impacted soil and José Gomez-Eyles for initial discussions on the use of POM. Thanks also to the 407
three anonymous reviewers for their improvements to the manuscript. 408
21 References
410
Ahmad, M., Rajapaksha, A.U., Lim, J.E., Zhang, M., Bolan, N., Mohan, D., Vithanage, M., Lee, S.S., Ok, 411
Y.S., 2014. Biochar as a sorbent for contaminant management in soil and water: A review. 412
Chemosphere 99, 19-33. 413
Atkinson, C., Fitzgerald, J., Hipps, N., 2010. Potential mechanisms for achieving agricultural benefits 414
from biochar application to temperate soils: a review. Plant and Soil 337, 1-18. 415
Beesley, L., Marmiroli, M., Pagano, L., Pigoni, V., Fellet, G., Fresno, T., Vamerali, T., Bandiera, M., 416
Marmiroli, N., 2013. Biochar addition to an arsenic contaminated soil increases arsenic 417
concentrations in the pore water but reduces uptake to tomato plants (Solanum lycopersicum L.). 418
Science of The Total Environment 454–455, 598-603. 419
Beesley, L., Moreno-Jiménez, E., Gomez-Eyles, J.L., 2010. Effects of biochar and greenwaste compost 420
amendments on mobility, bioavailability and toxicity of inorganic and organic contaminants in a 421
multi-element polluted soil. Environmental Pollution 158, 2282-2287. 422
Beesley, L., Moreno-Jiménez, E., Gomez-Eyles, J.L., Harris, E., Robinson, B., Sizmur, T., 2011. A review 423
of biochars’ potential role in the remediation, revegetation and restoration of contaminated soils. 424
Environmental Pollution 159, 3269-3282. 425
Brennan, A., Moreno Jiménez, E., Puschenreiter, M., Alburquerque, J.A., Switzer, C., 2014. Effects of 426
biochar amendment on root traits and contaminant availability of maize plants in a copper and 427
arsenic impacted soil. Plant and Soil, 1-10. 428
Brändli, R.C., Hartnik, T., Henriksen, T., Cornelissen, G., 2008. Sorption of native polyaromatic 429
hydrocarbons (PAH) to black carbon and amended activated carbon in soil. Chemosphere 73, 1805-430
1810. 431
Cornelissen, G., Gustafsson, Ö., Bucheli, T.D., Jonker, M.T.O., Koelmans, A.A., van Noort, P.C.M., 432
2005. Extensive Sorption of Organic Compounds to Black Carbon, Coal, and Kerogen in Sediments 433
and Soils: Mechanisms and Consequences for Distribution, Bioaccumulation, and Biodegradation. 434
22 Denyes, M.J., Rutter, A., Zeeb, B.A., 2013. In situ application of activated carbon and biochar to PCB-436
contaminated soil and the effects of mixing regime. Environmental Pollution 182, 201-208. 437
Endo, S., Hale, S.E., Goss, K.-U., Arp, H.P.H., 2011. Equilibrium Partition Coefficients of Diverse Polar 438
and Nonpolar Organic Compounds to Polyoxymethylene (POM) Passive Sampling Devices. 439
Environmental Science & Technology 45, 10124-10132. 440
Fellet, G., Marmiroli, M., Marchiol, L., 2014. Elements uptake by metal accumulator species grown 441
on mine tailings amended with three types of biochar. Science of The Total Environment 468–469, 442
598-608. 443
Freddo, A., Cai, C., Reid, B.J., 2012. Environmental contextualisation of potential toxic elements and 444
polycyclic aromatic hydrocarbons in biochar. Environmental Pollution 171, 18-24. 445
Gao, Y., Cao, X., Kang, F., Cheng, Z., 2011. PAHs Pass Through the Cell Wall and Partition into 446
Organelles of Arbuscular Mycorrhizal Roots of Ryegrass All rights reserved. No part of this periodical 447
may be reproduced or transmitted in any form or by any means, electronic or mechanical, including 448
photocopying, recording, or any information storage and retrieval system, without permission in 449
writing from the publisher. J. Environ. Qual. 40, 653-656. 450
Gao, Y., Collins, C.D., 2009. Uptake Pathways of Polycyclic Aromatic Hydrocarbons in White Clover. 451
Environmental Science & Technology 43, 6190-6195. 452
Ghosh, U., Luthy, R.G., Cornelissen, G., Werner, D., Menzie, C.A., 2011. In-situ Sorbent Amendments: 453
A New Direction in Contaminated Sediment Management. Environmental Science & Technology 45, 454
1163-1168. 455
Gomez-Eyles, J.L., Beesley, L., Moreno-Jimenez, E., Ghosh, U., Sizmur, T., 2013. The potential of 456
biochar amendments to remediate contaminated soils, in: Ladygina, N., Rinea, F. (Eds.), Biochar and 457
Soil Biota. CRC Press, p. 278. 458
Gomez-Eyles, J.L., Jonker, M.T.O., Hodson, M.E., Collins, C.D., 2011. Passive Samplers Provide a 459
Better Prediction of PAH Bioaccumulation in Earthworms and Plant Roots than Exhaustive, Mild 460
23 Hale, S.E., Elmquist, M., Brändli, R., Hartnik, T., Jakob, L., Henriksen, T., Werner, D., Cornelissen, G., 462
2012. Activated carbon amendment to sequester PAHs in contaminated soil: A lysimeter field trial. 463
Chemosphere 87, 177-184. 464
Hilber, I., Blum, F., Leifeld, J., Schmidt, H.-P., Bucheli, T.D., 2012. Quantitative Determination of PAHs 465
in Biochar: A Prerequisite To Ensure Its Quality and Safe Application. Journal of Agricultural and Food 466
Chemistry 60, 3042-3050. 467
Houben, D., Evrard, L., Sonnet, P., 2013. Beneficial effects of biochar application to contaminated 468
soils on the bioavailability of Cd, Pb and Zn and the biomass production of rapeseed (Brassica napus 469
L.). Biomass and Bioenergy 57, 196-204. 470
Jakob, L., Hartnik, T., Henriksen, T., Elmquist, M., Brändli, R.C., Hale, S.E., Cornelissen, G., 2012. PAH-471
sequestration capacity of granular and powder activated carbon amendments in soil, and their 472
effects on earthworms and plants. Chemosphere 88, 699-705. 473
Jonker, M.T.O., Koelmans, A.A., 2001. Polyoxymethylene Solid Phase Extraction as a Partitioning 474
Method for Hydrophobic Organic Chemicals in Sediment and Soot. Environmental Science & 475
Technology 35, 3742-3748. 476
Karami, N., Clemente, R., Moreno-Jiménez, E., Lepp, N.W., Beesley, L., 2011. Efficiency of green 477
waste compost and biochar soil amendments for reducing lead and copper mobility and uptake to 478
ryegrass. Journal of Hazardous Materials 191, 41-48. 479
Kummerová, M., Barták, M., Dubová, J., Tříska, J., Zubrová, E., Zezulka, Š., 2006. Inhibitory Effect of 480
Fluoranthene on Photosynthetic Processes in Lichens Detected by Chlorophyll Fluorescence. 481
Ecotoxicology 15, 121-131. 482
Lehmann, J., Rillig, M.C., Thies, J., Masiello, C.A., Hockaday, W.C., Crowley, D., 2011. Biochar effects 483
on soil biota – A review. Soil Biology and Biochemistry 43, 1812-1836. 484
Li, H., Sheng, G., Chiou, C.T., Xu, O., 2005. Relation of Organic Contaminant Equilibrium Sorption and 485
24 Lin, Q., Shen, K.-L., Zhao, H.-M., Li, W.-H., 2008. Growth response of Zea mays L. in pyrene–copper 487
co-contaminated soil and the fate of pollutants. Journal of Hazardous Materials 150, 515-521. 488
Lozano-Rodriguez, E., Luguera, M., Lucena, J.J., Carpena-Ruiz, R., 1995. Evaluation of two different 489
acid digestion methods in closed systems for trace element determinations in plants. Quimica 490
Analitica 14, 27-30. 491
Luthy, R.G., Aiken, G.R., Brusseau, M.L., Cunningham, S.D., Gschwend, P.M., Pignatello, J.J., Reinhard, 492
M., Traina, S.J., Weber, W.J., Westall, J.C., 1997. Sequestration of Hydrophobic Organic 493
Contaminants by Geosorbents. Environmental Science & Technology 31, 3341-3347. 494
Marchal, G., Smith, K.E.C., Mayer, P., Wollesen de Jonge, L., Karlson, U.G., 2014. Impact of soil 495
amendments and the plant rhizosphere on PAH behaviour in soil. Environmental Pollution 188, 124-496
131. 497
Meyer, S., Glaser, B., Quicker, P., 2011. Technical, Economical, and Climate-Related Aspects of 498
Biochar Production Technologies: A Literature Review. Environmental Science & Technology 45, 499
9473-9483. 500
Oen, A.M.P., Beckingham, B., Ghosh, U., Kruså, M.E., Luthy, R.G., Hartnik, T., Henriksen, T., 501
Cornelissen, G., 2011. Sorption of Organic Compounds to Fresh and Field-Aged Activated Carbons in 502
Soils and Sediments. Environmental Science & Technology 46, 810-817. 503
Oleszczuk, P., 2008. Phytotoxicity of municipal sewage sludge composts related to physico-chemical 504
properties, PAHs and heavy metals. Ecotoxicology and Environmental Safety 69, 496-505. 505
Pignatello, J.J., Xing, B., 1995. Mechanisms of Slow Sorption of Organic Chemicals to Natural 506
Particles. Environmental Science & Technology 30, 1-11. 507
Sparrevik, M., Saloranta, T., Cornelissen, G., Eek, E., Fet, A.M., Breedveld, G.D., Linkov, I., 2011. Use 508
of Life Cycle Assessments To Evaluate the Environmental Footprint of Contaminated Sediment 509
Remediation. Environmental Science & Technology 45, 4235-4241. 510
Van Slycken, S., Witters, N., Meers, E., Peene, A., Michels, E., Adriaensen, K., Ruttens, A., 511
25 of metal-contaminated agricultural land by cultivation of energy maize (Zea mays). Environmental 513
Pollution 178, 375-380. 514
Vázquez, S., Moreno, E., Carpena, R., 2008. Bioavailability of metals and As from acidified 515
multicontaminated soils: Use of white lupin to validate several extraction methods. Environmental 516
Geochemistry and Health 30, 193-198. 517
Wang, P., Luo, L., Ke, L., Luan, T., Tam, N.F.-Y., 2013. Combined toxicity of polycyclic aromatic 518
hydrocarbons and heavy metals to biochemical and antioxidant responses of free and immobilized 519
Selenastrum capricornutum. Environmental Toxicology and Chemistry 32, 673-683. 520
Waqas, M., Khan, S., Qing, H., Reid, B.J., Chao, C., The effects of sewage sludge and sewage sludge 521
biochar on PAHs and potentially toxic element bioaccumulation in Cucumis sativa L. Chemosphere. 522
Waqas, M., Khan, S., Qing, H., Reid, B.J., Chao, C., 2014. The effects of sewage sludge and sewage 523
sludge biochar on PAHs and potentially toxic element bioaccumulation in Cucumis sativa L. 524
Chemosphere 105, 53-61. 525
Wellburn, A.R., 1994. The Spectral Determination of Chlorophylls a and b, as well as Total 526
Carotenoids, Using Various Solvents with Spectrophotometers of Different Resolution. Journal of 527
Plant Physiology 144, 307-313. 528
Yoshitomi, K.J., Shann, J.R., 2001. Corn (Zea mays L.) root exudates and their impact on 14C pyrene 529
mineralization. Soil Biology and Biochemistry 33, 1769-1776. 530
Zhang, M., Zhu, L., 2009. Sorption of Polycyclic Aromatic Hydrocarbons to Carbohydrates and Lipids 531
of Ryegrass Root and Implications for a Sorption Prediction Model. Environmental Science & 532
Technology 43, 2740-2745. 533
534
14
15
Fig. S1 Hexane-acetone extractable concentrations of PAHs in planted (+P) and unplanted (-P) 16
contaminated soil with different biochar treatments, C: control, PB: pine woodchip biochar amended 17
soil, MB: maize husk biochar amended soil, AC: activated carbon amended soil. Mean ± SE (n=3-4). 18
Different letters signify differences between groups at p<0.001. Data were log transformed to fit 19
homoscedasticity for post hoc tests. 20
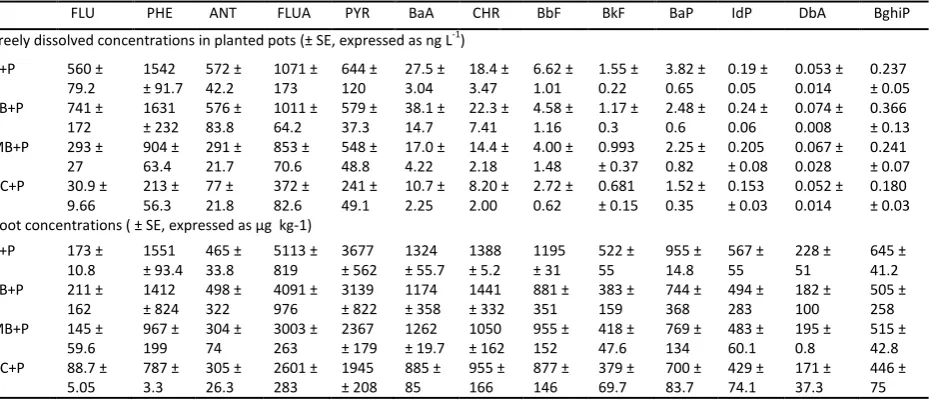
[image:26.595.65.530.101.237.2]Table S1 Averaged values for individual PAH compounds in porewater (POM) and roots (n=3-4 POM, 22
n=2-4 roots). Individual data points from +P data were used to compare root predictions using POM 23
to actual root data. 24
FLU PHE ANT FLUA PYR BaA CHR BbF BkF BaP IdP DbA BghiP
Freely dissolved concentrations in planted pots (± SE, expressed as ng L-1)
C+P 560 ±
79.2 1542 ± 91.7 572 ± 42.2 1071 ± 173 644 ± 120 27.5 ± 3.04 18.4 ± 3.47 6.62 ± 1.01 1.55 ± 0.22 3.82 ± 0.65 0.19 ± 0.05 0.053 ± 0.014 0.237 ± 0.05
PB+P 741 ±
172 1631 ± 232 576 ± 83.8 1011 ± 64.2 579 ± 37.3 38.1 ± 14.7 22.3 ± 7.41 4.58 ± 1.16 1.17 ± 0.3 2.48 ± 0.6 0.24 ± 0.06 0.074 ± 0.008 0.366 ± 0.13
MB+P 293 ±
27 904 ± 63.4 291 ± 21.7 853 ± 70.6 548 ± 48.8 17.0 ± 4.22 14.4 ± 2.18 4.00 ± 1.48 0.993 ± 0.37 2.25 ± 0.82 0.205 ± 0.08 0.067 ± 0.028 0.241 ± 0.07
AC+P 30.9 ±
9.66 213 ± 56.3 77 ± 21.8 372 ± 82.6 241 ± 49.1 10.7 ± 2.25 8.20 ± 2.00 2.72 ± 0.62 0.681 ± 0.15 1.52 ± 0.35 0.153 ± 0.03 0.052 ± 0.014 0.180 ± 0.03 Root concentrations ( ± SE, expressed as µg kg-1)
C+P 173 ±
10.8 1551 ± 93.4 465 ± 33.8 5113 ± 819 3677 ± 562 1324 ± 55.7 1388 ± 5.2 1195 ± 31 522 ± 55 955 ± 14.8 567 ± 55 228 ± 51 645 ± 41.2
PB+P 211 ±
162 1412 ± 824 498 ± 322 4091 ± 976 3139 ± 822 1174 ± 358 1441 ± 332 881 ± 351 383 ± 159 744 ± 368 494 ± 283 182 ± 100 505 ± 258
MB+P 145 ±
59.6 967 ± 199 304 ± 74 3003 ± 263 2367 ± 179 1262 ± 19.7 1050 ± 162 955 ± 152 418 ± 47.6 769 ± 134 483 ± 60.1 195 ± 0.8 515 ± 42.8
AC+P 88.7 ±
5.05 787 ± 3.3 305 ± 26.3 2601 ± 283 1945 ± 208 885 ± 85 955 ± 166 877 ± 146 379 ± 69.7 700 ± 83.7 429 ± 74.1 171 ± 37.3 446 ± 75 25
Method used to predict root values from POM data 26
Klip and Kch values were taken from the SI section of Gomez Eyles et al ( 2011). Lipid and carbohydrate
27
fractions used (1.1% for lipids and 15.3% for carbohydrates in the roots of wheat plants) were taken 28
from Li et al ( 2005). 29
The equation used for calculating predicted data was taken from Zhang and Zhu (2009): 30
Croot-predicted= Cfree(flipKlip + fchKch)
31
Where Croot-predicted is the predicted root concentrations, Cfree is the freely dissolved calculation
32
measured by POM, flip is the lipid fraction (0.011 in this study) Klip is the lipid partitioning coefficient,
33
fch is the carbohydrate fractions (0.153 in this study) and Kch is the carbohydrate partitioning
34
coefficient 35
References 37
Gomez-Eyles, J.L., Jonker, M.T.O., Hodson, M.E., Collins, C.D., 2011. Passive Samplers Provide a 38
Better Prediction of PAH Bioaccumulation in Earthworms and Plant Roots than Exhaustive, Mild 39
Solvent, and Cyclodextrin Extractions. Environmental Science & Technology 46, 962-969. 40
Li, H., Sheng, G., Chiou, C.T., Xu, O., 2005. Relation of Organic Contaminant Equilibrium Sorption and 41
Kinetic Uptake in Plants. Environmental Science & Technology 39, 4864-4870. 42
Zhang, M., Zhu, L., 2009. Sorption of Polycyclic Aromatic Hydrocarbons to Carbohydrates and Lipids 43
of Ryegrass Root and Implications for a Sorption Prediction Model. Environmental Science & 44
Technology 43, 2740-2745. 45