City, University of London Institutional Repository
Citation
:
Spanos, P. D. and Giaralis, A. (2008). Statistical linearization based estimation of the peak response of nonlinear systems subject to the EC8 design spectrum. 2008 SEISMIC ENGINEERING CONFERENCE COMMEMORATING THE 1908 MESSINA AND REGGIO CALABRIA EARTHQUAKE, PARTS 1 AND 2, 1020, pp. 1236-1244. ISSN 0094-243XThis is the accepted version of the paper.
This version of the publication may differ from the final published
version.
Permanent repository link:
http://openaccess.city.ac.uk/918/Link to published version
:
Copyright and reuse:
City Research Online aims to make research
outputs of City, University of London available to a wider audience.
Copyright and Moral Rights remain with the author(s) and/or copyright
holders. URLs from City Research Online may be freely distributed and
linked to.
Statistical linearization based estimation of the
peak response of nonlinear systems subject to
the EC8 design spectrum
Pol D. Spanos
aand Agathoklis Giaralis
baL. B. Ryon Chair in Engineering, Rice University, MS 321, P.O. Box 1892, Houston, TX 77251, USA bDepartment of Civil and Environmental Engineering, Rice University, MS 318, P.O. Box 1892,
Houston, TX 77251, U.S.A.
Abstract. A stochastic approach is proposed to obtain reliable estimates of the peak response of
nonlinear systems to excitations specified via a response/ design seismic spectrum. This is achieved without resorting to numerical integration of the governing nonlinear equations of motion. First, a numerical scheme is utilized to derive a power spectrum which is compatible in a stochastic sense to a given elastic design spectrum. This spectrum is then treated as the excitation spectrum in the context of the statistical linearization method to determine effective parameters, damping and stiffness, corresponding to an equivalent linear system (ELS). The obtained parameters are used in conjunction with the linear design spectrum, for various values of damping, to estimate the response of certain nonlinear systems. The case of single-degree-of-freedom systems with cubic stiffness nonlinearity and hysteretic systems whose restoring force traces a bilinear law are considered in conjunction with the elastic design spectrum prescribed by the European aseismic code provisions (EC8). Monte Carlo simulations pertaining to an ensemble of non-stationary EC8 design spectrum compatible accelerograms are conducted to confirm that the average peak response of the nonlinear systems compare reasonably well with that of the ELS. This is true, even in cases where the response of the nonlinear oscillators deviates significantly from the linear one. In this manner, the proposed approach yields ELS which can reliably replace the original nonlinear systems in carrying out computationally efficient analyses in the initial stages of the aseismic design of structures under severe seismic excitations. Furthermore, the potential of this approach for developing inelastic design spectra from a given elastic design spectrum is established.
Keywords: Statistical linearization, inelastic design spectrum, bilinear, hysteretic, EC8
INTRODUCTION
A considerably different approach in dealing with nonlinear systems is to employ a linearization method. That is, to approximate the a priori unknown response of the nonlinear systems by considering the response of an appropriately defined “equivalent” linear system (ELS). In general, the dynamical characteristics of the ELS depend on the nonlinear system, on the input excitation, and on the various assumptions made by the particular linearization method.
In an early study by Iwan and Gates [4] the potential of various linearization techniques to estimate the peak response of certain single-degree-of-freedom (SDOF) hysteretic oscillators exposed to strong ground motion was assessed. This was done vis-à-vis numerical results obtained by integrating the nonlinear equations of motion pertaining to an ensemble of 12 recorded accelerograms. All the linearization techniques considered in the aforementioned study define deterministically the ELSs without considering the statistical attributes of the seismic excitation.
Along similar lines, Koliopoulos et al. [5] pursued a comparative assessment of the applicability of certain linearization techniques for the case of bilinear hysteretic SDOF systems. In this case a small ensemble (9) of artificial accelerograms whose average response spectra was relatively close to a specific design spectrum prescribed by the European aseismic code provisions (EC8) was used for the numerical validation of the techniques considered. One of these techniques involved a random vibration-based linearization scheme relying on the solution of an underlying Fokker-Planck equation, necessitating the limiting assumption of white noise input.
Furthermore, Basu and Gupta [6] derived inelastic spectra pertaining to certain recorded seismic accelerograms also based on a statistical linearization formulation. This formulation required the minimization of the error of the mean square of the peak responses between the original nonlinear and an ELS. A piecewise linear non-hysteretic type of nonlinearity was considered with a fixed value for the yielding displacement selected so that the system experiences mild non-linear behavior.
Herein, the potential of estimating the peak responses of inelastic systems by utilizing effective (equivalent) linear parameters ([7]) and power spectra derived to be compatible with given response/design spectra is explored. The cases of SDOF Duffing and bilinear hysteretic oscillators are considered and numerical examples pertaining to the EC8 design spectrum [8] are provided. It is emphasized that the purpose of the present work is not to assess the accuracy of the statistical linearization technique, a well-studied theme in the literature (see e.g. [9] and references therein). Instead, it aims to take advantage of the concept of response spectrum-compatible stationary power spectra for developing inelastic response spectra from a given elastic spectrum without resorting to the numerical integration of the underlying nonlinear equations of motion.
RESPONSE SPECTRUM-COMPATIBLE POWER SPECTRA
Given a design/response pseudo-acceleration seismic spectrum Sα, the core equation for relating it to a one-sided power spectrum G(ω) reads (e.g. [10])
(
)
2, ,
,
a j j G j j G
where λj,n,G denotes the spectral moment of order n of the response of a SDOF system
of natural frequency ωj and ratio of critical damping ζ excited by a stationary process g(t) characterized by the spectrum G(ω) in the frequency domain. Namely,
( )
(
) (
)
, , 2 2 2 2
0 2
n j n G
j j
G
d
ω ω
λ ω
ω ω ζωω
∞ =
− +
∫
. (2)The “peak factor” ηj,G appearing in Eq. (1) is the critical parameter establishing the
equivalence, with probability p, between the Sa and G(ω) and can be estimated by the
semi-empirical formula [10]
(
)
(
)
{
1.2}
, 2ln 2 , 1 exp , ln 2 ,
j G vj G qj G vj G
η = ⎡⎢ − − π ⎤⎥
⎣ ⎦ , (3)
where
(
)
1 2,2, ,1,
, ,
,0, ,0, ,2,
ln ; 1
2
j G j G
s
j G j G
j G j G j G
T
v λ p q λ
π λ λ λ
−
= − = − . (4)
For the purpose of this study p is taken equal to 0.5 in Eq. (4), so that Eq. (1) prescribes the following compatibility criterion: considering an ensemble of stationary samples of the process g(t), half of the population of their response spectra will lie below Sa (i.e. Sa is the median response spectrum). Furthermore, Ts is the duration of
the process g(t) corresponding to the strong -motion part exhibited by typical recorded accelerograms pertaining to historical seismic events.
Given a design spectrum Sa, an estimate of the power spectrum G(ω) conforming
with the aforementioned criterion can be recursively evaluated at a specific set of natural frequencies ωj equally spaced by Δω apart using the equation [10],[11]
(
)
[ ]
2 1 0 2 1 1 , 0 , 4 , 40 , 0
j j
k j k
j j j N j
j
S
G G
α ω ζ
ζ ω ω ω
ω π ζω η ω ω ω − = − ⎧ ⎛ ⎞
⎪ ⎜ − Δ ⎟ >ω
⎪ − ⎜ ⎡ ⎤ = ⎨ ⎣ ⎦ ⎝ ⎪ ≤ ≤ ⎪⎩
∑
⎟⎠ . (5)
In this equation, ω0 is the lowest frequency for which Eq. (3) is defined, and N(ω) is
assumed to be clipped white noise of unit strength on the interval [0, ωb] where ωb
signifies the maximum frequency of interest.
The, thus, obtained discrete power spectrum G[ωj] can be further modified
iteratively to improve the matching of the associated response spectrum A[ωj,ζ] with
the target design spectrum Sα according to the equation at the ν-th iteration (e.g. [12],[13]) ( ) ( ) ( ) 2 1 , , a j v v
Next, it is proposed to use the obtained design spectrum compatible power spectrum G[ωj], as a surrogate for determining effective natural frequency and
damping parameters associated with a nonlinear restoring function; this well- established in standard references ([7], [9]) procedure is briefly reviewed in the following sections. These effective parameters can then be used in conjunction with the family of the elastic seismic spectra to estimate the seismic response of the nonlinear system.
STATISTICAL LINEARIZATION: DUFFING OSCILLATOR
In implementing the proposed approach, the governing equation of motion for a unit-mass quiescent SDOF system with linear-plus-cubic type of stiffness (Duffing oscillator) and ratio of critical viscous damping ζ base-excited by the stationary acceleration process g(t) is considered. Specifically, (e.g. [9])
( )
2( )
2(
( )
3( )
)
( ) ( )
;( )
n n
x t + ζω x t +ω x t +εx t = −g t x 0 =x 0 0
= , (7)
where x(t) is the displacement trace of the non-linear oscillator relative to the motion of the ground, ωn is the natural frequency of the system for small oscillations, ε is a
constant controlling the severity of the nonlinearity, and the dot over a symbol denotes differentiation with respect to time t. Introducing the dimensionless time τ= ωnt and
displacement y= x/ λn,0,G , and the quantity ρ= ελn,0,G Eq. (7) is written as (e.g. [9])
( )
( )
( )
(
( )
)
( )
( )
( )
2
2
2 2
,0,
0
2 1 ; 0
n n G
d y dy g dy
y y y
d d d
τ τ τ
ζ τ ρ τ
τ + τ + + = −ω λ = τ =0 (8)
The statistical linearization method utilizes the response ( ˆx) of an ELS of natural frequency ωeq and damping ratio ζeqgiven by the equation
( )
( )
2( )
( ) ( ) ( )
ˆ 2 eq eqˆ eqˆ ; ˆ ˆ
x t + ζ ω x t +ω x t = −g t x =x
0 0 =0, (9)
to approximate the response (x) of the non-linear oscillator of Eq. (7) [9]. According to the original and most widely-used form of statistical linearization the above linear system is defined by minimizing the expected value of the difference (error) between Eqs. (7) and (9) in a least square sense with respect to the quantities ωeq and ζeq (i.e.
the dynamical properties of the equivalent linear system), [7],[9],[14]. For the Duffing oscillator, the aforementioned minimization operation yields [9]
2 2 2
,0,
3 ; n
eq n n eq G eq
eq
ω
ω ω ω ελ ζ ζ
ω
= + = . (10)
STATISTICAL LINEARIZATION: BILINEAR OSCILLATOR
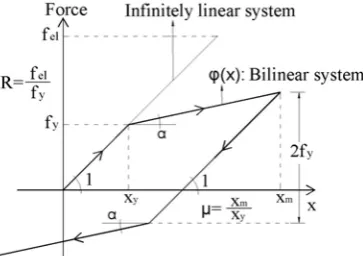
The proposed approach is also implemented for the response of a unit-mass quiescent viscously damped SDOF whose restoring force traces the bilinear law φ(x)
as depicted in Fig. 1. Its motion is governed by the equation [15]
( )
2( )
2( )
( )
;( )
( )
n n
x t + ζω x t +ω ϕ x = −g t x =x
0 0 =0. (11)
In determining the effective parameters of the ELS (Eq. (9)), the previously described statistical linearization method yields the following expressions ([7],[15])
(
)
22 2
3 1
8 1 1 1
1 1ex
eq n
a z
z
z z
ω ω
π θ θ
∞
⎧ − ⎛− ⎞ ⎫
⎪ ⎛ ⎞ ⎪
= ⎨ − ⎜ + ⎟ − ⎜ ⎟ ⎬
⎝ ⎠
⎪ ⎝ ⎠ ⎪
⎩
∫
p dz⎭, (12)and
2 1
1
n n eq n
eq eq
a
erf
ω ω
ζ ζ
ω ω
1
πθ θ
⎛ ⎞ − ⎛ ⎛ ⎞⎞
= +⎜⎜ ⎟⎟ ⎜ − ⎜⎝ ⎟⎠
⎝ ⎠
⎝ ⎠ ⎟, (13)
where
,0, 2 2 eq G
y
x
λ
θ = . (14)
[image:6.595.209.391.476.604.2]A similar iterative procedure as in the case of the Duffing oscillator must be employed to solve numerically the non-linear system of Eqs. (2) and (12)~(14) to obtain ωeq and ζeq which depend on ωn, ζ, a (defined in Fig.1) and G(ω) [9].
FIGURE 1. Bilinear force-displacement law considered in Eq. 11 and definitions of the reduction
factor R, the ductility μ and the post-yield to pre-yield stiffness ratio α.
NUMERICAL APPLICATION TO THE EC8 DESIGN SPECTRUM
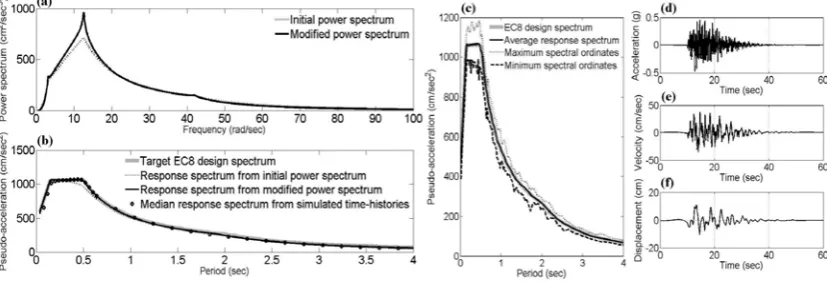
initially obtained by means of Eq. (5) for Δω=0.1 rad/sec and Ts= 20sec (dotted line in
[image:7.595.91.505.254.395.2]Fig. 2(a). Performing four iterations using Eq. (6) a modified power spectrum (black line in Fig. 2(a)) is obtained which achieves enhanced matching with the target spectrum as evidenced in Fig. 2(b). The dotted and solid black lines of Fig. 2(b) are computed via Eqs. (1)~(4) while the dots correspond to the median spectral ordinates of 1000 20sec long stationary signals compatible with the modified power spectrum generated using an auto-regressive-moving-average filtering technique [16]. Evidently, the criterion posed by Eq. (1) is satisfactorily met for the modified power spectrum. The latter is considered as the input spectrum for statistical linearization in all of the ensuing numerical results.
FIGURE 2. EC8 design spectrum compatible power spectra (a) and associated compatibility
verification (b); Response spectra of an ensemble of 40 EC8 design spectrum compatible artificial non-stationary accelerograms used for the Monte Carlo analysis (Fig. (4)) (c); Time-history of one of these
accelerograms (d) and its corresponding velocity (e) and displacement trace (f).
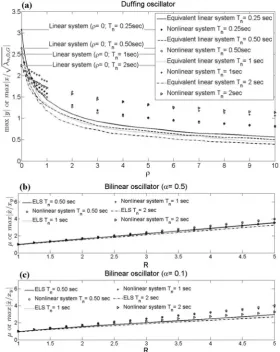
Figures 3(a) and 3(b) provide the properties of the ELSs obtained by iteratively solving Eq. (2) and (10) for Duffing oscillators of various levels of nonlinearity ρ and natural periods Tn= 2π/ωn, while Figs. 3(c)~3(f) provide the properties of the ELSs
obtained by iteratively solving Eqs. (2) and (12)~(14) for bilinear oscillators of various reduction factors R (defined in Fig.1), post to pre-yield stiffness ratios α (defined in Fig.1) and natural periods Tn= 2π/ωn. In all cases the viscous damping ratio of the
[image:7.595.92.509.575.701.2]nonlinear systems (ζ) is fixed to 5%.
FIGURE 3. Properties of equivalent linear systems corresponding to various Duffing and bilinear
In Fig.4 appropriately normalized averaged peak responses obtained via numerical integration of the various nonlinear systems considered (dots of various shapes) are compared with similar results obtained from the corresponding ELSs (lines of various types) for an ensemble of 40 non-stationary artificial seismic accelerograms compatible with the target EC8 design spectrum of Fig.2. These accelerograms have been generated by a wavelet-based stochastic approach recently proposed by the authors [17] (see also Figs. 2(c)~2(f)). As expected, the quality of agreement between the peak response of the nonlinear and ELSs decreases as the level of the nonlinearity expressed by the quantities ρ for the Duffing and R for the bilinear oscillators increases and as the natural period of for small oscillations Tn increases [6], [9], [15].
FIGURE 4. Assessment of the capability of the equivalent linear systems (ELSs) to approximate the
peak response of various Duffing and bilinear hysteretic oscillators via Monte Carlo simulations.
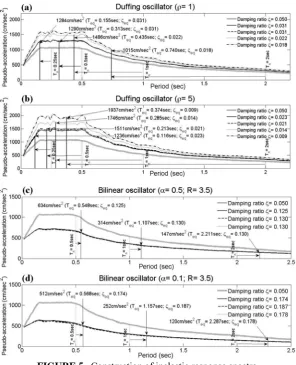
by the statistical linearization as proposed herein and “read” the related spectral ordinate. Obviously, for the case of the Duffing oscillator, this procedure can be facilitated by having available a collection of elastic design spectra for corresponding to various levels of viscous damping. Remarkably, in the case of the bilinear systems the significant increase of the viscous damping ratio of the equivalent linear systems which accounts for the hysteretic damping is practically independent of Tnas implied
[image:9.595.149.446.291.657.2]in Figs. 3(d) and 3(f). Thus, only one spectrum (black practically overlapping lines in Figs. 5(c) and 5(d)) corresponds to all possible bilinear oscillators once the α and R properties are specified. More importantly, in this latter case this response spectrum curve is amenable to a dual interpretation: it can be construed both as an elastic response spectrum characterizing linear oscillators of increased viscous damping compared to the initial ζ (=5% in all examples herein considered), and as an inelastic response spectrum corresponding to a certain force reduction ratio R (see Fig. 1) [2].
FIGURE 5. Construction of inelastic response spectra.
CONCLUDING REMARKS
proposed approach relies on first determining a power spectrum which is equivalent, stochastically, to the given design spectrum. This power spectrum is then used to determine, via statistical linearization, effective natural frequency and damping parameters for the considered nonlinear system. These parameters are utilized to readily estimate the peak seismic response of the nonlinear system using standard linear response spectrum techniques. Obviously, this approach can serve for developing inelastic response spectra from a given elastic response/ design spectrum without the need for integrating numerically the nonlinear equations of motion. Numerical data supporting the reliability of the proposed approach have been provided; they pertain to the Duffing and the bilinear hysteretic kinds of nonlinear systems with respect to the EC8 elastic design spectrum. Future work will include the incorporation of more sophisticated nonlinear hysteretic models to account for system degradation combined with more elaborate statistical linearization schemes [18].
ACKNOWLEDGMENTS
The financial support of this work by a grant from NSF is greatly acknowledged.
REFERENCES
1. E. Miranda and V.V. Bertero, Earthq. Spectra10, 357-379 (1994).
2. A. K. Chopra, Dynamics of Structures: Theory and Applications to Earthquake Engineering, Second Edition, New Jersey, Prentice Hall, 2000.
3. B. Borzi, G. M. Calvi, A. S. Elnashai, E. Faccioli and J. J. Bommer, Soil Dyn. Earthq. Eng.21,
47-61 (2001).
4. W. D. Iwan and N. C. Gates, J. Eng. Mech. Div. ASCE105, 391-405 (1979).
5. P. K. Koliopoulos, E. A. Nichol and G. D. Stefanou, Eng Struct.16, 5-10 (1996).
6. B. Basu and V.K. Gupta, Earthq. Eng. Struct. Dyn. 25, 421-433 (1996).
7. T. K. Caughey, J. Appl. Mech. ASME27, 649-652 (1960).
8. CEN, Eurocode 8: Design of Structures for Earthquake Resistance-Part 1: General Rules, Seismic Actions and Rules for Buildings; EN1998-1:2003 E, Brussels, 2003.
9. J. B. Roberts and P. D. Spanos, Random Vibration and Statistical Linearization, New York, Dover Publications, 2003.
10. E. H. Vanmarcke, “Structural response to earthquakes,” in Seismic Risk and Engineering Decisions, edited by C. Lomnitz and E. Rosenblueth, Amsterdam, Elsevier, 1976, pp. 287-337.
11. P. Cacciola, P. Colajanni and G. Muscolino G, J. Struct. Eng. ASCE130, 47-55 (2004).
12. M. Di Paola and L. La Mendola, Eur. Earthq. Eng.VI(2), 36-44 (1992).
13. I. D. Gupta and M. D. Trifunac MD, Soil Dyn. Earthq. Eng.17, 89-99 (1998).
14.S. H. Crandall, Prob. Eng. Mech.16, 169-176 (2001).
15. W. D. Iwan and L. D. Lutes, J. Acoust. Soc. Am.43, 545-552 (1968).
16. P. D. Spanos and B. Zeldin, Appl. Mech. Rev.51, 219-237 (1998).
17. A. Giaralis and P. D. Spanos, Soil Dyn. Earthq. Eng. (in press).