TOWARDS WHOLE BUILDING MOISTURE MODELLING OF THE IMPACTS OF
SHORT DURATION MOISTURE RELEASE
AnastasiosMarkopoulos
1,Paul Strachan
1, Nick Kelly
1, Paul Baker
21
University of Strathclyde, Energy Systems research Unit
2
Glasgow Caledonian University, Centre for Research on Indoor Climate and Health
ABSTRACT
Considerable progress has been made in the field of building simulation for combined heat, air and mass transfer processes occurring in the indoor environment, yet concerns persists over the reliability and suitability of moisture property data integrated into available tools and the approaches taken in modelling physical phenomena. Particular interest lies in predicting the impact of indoor moisture production schemes and sources observed in housing, linked to occupant activity. To this end, the work included in this paper includes activities to verify and develop the capabilities of the building simulation tool ESP-r in modelling indoor environmental conditions resulting from occupant-related moisture production. The activities include modelling a realistic scenario taken from IEA Annex 41, a laboratory based experiment focused on short-duration, high moisture loading pulses and the development of a moisture release model associated with the passive drying of clothes.
INTRODUCTION
Relationships have been identified between perceived building indoor air quality (IAQ) and the presence of moisture (Heinrich 2011). IAQ is the result of occupant activity and the product of other biological and toxicological emissions. It is intrinsically linked to the air being supplied to the indoor environment as part of mechanical integrated air management systems and/or passive movement of air between the indoor and outdoor environment, driven by pressure gradients (Sherman and Walker 2011). Recent improvements, focused on improving building energy efficiency and indoor thermal comfort have tended to neglect the issue of IAQ.. Indeed, as reducing infiltration rates and increasing the level of insulation are some of the the main energy efficiency actions being taken, IAQ could deteriorate through increasing concentrations of airborne contaminants including moisture (Jones 1999).
The presence of moisture in the indoor environment, commonly measured as relative humidity (RH), is influential on the overall perception of thermal comfort and IAQ. Elevated levels of RH have been linked to enhanced transfer of certain types of biological contaminants, such as moulds (Hersoug
2005), which have been associated with adverse effects on occupant respiratory symptoms (Haverinen et al 2003) and even the durability and integrity of building materials (Cerolini et al 2009). Subsequently, developing methods for managing and analysing indoor air humidity conditions has become a major concern in building design.
The work presented in this paper focuses on the modelling of the moisture performance of the indoor environment. The coupled nature of the heat, air and moisture (HAM) related events that are commonly observed in the indoor environment have been investigated and modelled through a series of modelling exercises and assessed by looking at the level of agreement achieved between measured and predicted data. This work was carried out using the whole building integrated simulation system, ESP-r (Clarke 2001).
After a brief summary of some relevant moisture sorption measurement techniques and moisture response characterisation, the paper focuses on tests to check on ESP-r’s HAM modelling capabilities, with a view to modelling the factors affecting the indoor environmental conditions associated with short duration occupant-related moisture release. The main application is on the impact of passive drying within dwellings (Porteous et al 2012).
(Kumaran 2006) and is highly dependent on the manner in which the procedures are conducted and the process used to interpret the resultant data i.e. different specimens of the same material display inconsistency in material properties (Pedersen 1992). For this reason it is necessary to conduct sensitivity studies to estimate the degree of uncertainty on modelling predictions, some of which are reported in this paper. The final exercise focuses on modelling the short-duration moisture release rate from passive indoor drying of clothes, which is common practice in UK social housing and is a common cause of poor IAQ.
RELEVANT
MATERIAL
MOISTURE
RESPONSE CHARACTERISICS
The modelling of passive drying requires the
knowledge of a number of moisture related
material properties. These are outlined in the
following paragraphs and will be used later
in the paper as part of the experimental
study.
Experimental techniques
The water vapour transmission test, commonly referred to as the cup-method (and further classified as a wet or dry cup test), is used to determine the moisture permeability of a material, assuming the transfer of moisture through the sample is governed by Fick’s Law for vapour diffusion. Gravimetric test procedures are used to derive the sorption isotherms for materials, functions describing the relationship between moisture content and relative humidity. This entails conditioning a specimen at different relative humidities and recording the sample weight when the equilibrium moisture content is reached at a predefined relative humidity point. Both the absorption and desorption isotherms can be obtained (Roels et al 2010).
Characterisation of moisture response
Applying material property data to the numerical modelling domain requires reliable quantification of the hygrothermal behaviour observed under a number of environmental scenarios and considers the relevant physical factors influencing the material response. These include ventilation, moisture emission rates, surface transfer coefficients, heat and moisture transfer in the pore domain and sorption properties of the hygroscopic material (Cunningham 2003). The complete quantification of the materials hygric response to these factors is complicated as there are several physical phenomena that require further detailed measurement. Simplified methods for characterising the hygrothermal behaviour of hygroscopic materials have therefore been developed (Abadie and Mendonca 2009).
For example, the NordTest protocol calculates the moisture buffering performance of building envelope
materials and indoor component materials, characterising the buffering performance as a Moisture Buffer Value (MBV), which is further classified as a practical and an ideal MBV (kg/m2.%RH) (Rode et al 2007). Both methodologies involve measuring the weight change of a sample material per unit area and change in RH under the influence of varying surrounding RH conditions. The NordTest protocol uses an 8hr period of high moisture exposure (75%RH) followed by 16h of low moisture exposure (33%RH). Both tests are carried out at a constant temperature of 23°C. Equation (1) gives the practical MBV.
MBV
prac=
m
max−
m
minA
s⋅ ∆
RH
(1)The ideal MBV (MBVideal) is the amount of moisture
exchange at the surface of a material during a period of time where there is a change in RH. Equation (2) illustrates the function used to determine the amount of surface moisture flux using standard material parameters:
MBV
ideal≈
G
(
t
)
∆
RH
=
0.00568
⋅
p
s⋅
b
m⋅
t
p (2) A further production adaptive characterisation protocol for assessing the moisture buffering potential of interior elements has been formulated (Janssen and Roels 2009), which enables a wider range of moisture production rates and interior elements to be included in a whole room moisture buffering performance analysis. Assumptions are made in these models when attempting to reproduce the climatic conditions witnessed in reality. In addition, the surface mass transfer coefficient is estimated by employing the heat and mass transfer analogy (Li et al 2012), due to the level of difficulty associated with measuring this property accurately. Local surface hygrothermal conditions are therefore discounted (Steeman et al 2009a), resulting in a detrimental impact on the accuracy of modelling moisture transfer at the air-material interface (Steeman et al 2009b).The Nordtest results are compared to ….
VERIFICATION OF ESP-r’s
MODELLING CAPABILITY
Modelling approach
In the work reported in this paper, a number of tests were undertaken to assess the integrated approach to building physics modelling within ESP-r, with particular focus on the relevant hygrothermal processes taking place in a building subject to shorter period moisture injections.
• Secondly, an experimental/simulation comparison and MBV calculation was carried out using measured data obtained from laboratory experiments.
• Finally, a simulation study was carried out to assess the application of the modelling approach to a clothes drying process, with particular focus on surface parameters influencing mass flow rates.
Validation Tests: Test building with two parallel rooms
[image:3.595.322.511.550.602.2]The results from this exercise typify ESP-r’s performance in modelling the moisture response of a space. This exercise is one of a range of tests developed in IEA Annex 41 .Two adjacent test rooms, were used as an initial case study for a simulation based investigation into hygrothermal whole building behaviour. The interior walls were lined with a selection of finishing materials in three separate modelling steps, so that the impact of the wall lining materials on internal relative humidity could be compared between the two rooms. One of the rooms had a standard gypsum plaster with a latex coating (CGP) and is used as a benchmark case. The walls of the adjacent test room were lined with aluminium foil initially; the second step introduced uncoated gypsum plasterboard (UGP) to the walls before finally applying the plasterboard to the ceiling in the final step. Both rooms had a constant air temperature of 21°C with infiltration rates of 0.63 and 0.66ac/h in the Reference and Test room, respectively. A total moisture load of 2.4kg/day was introduced to both rooms. A basic moisture production of 25g/h was applied to the rooms to represent plants and pets. Between 6 and 8am the production level increased to a peak of 400g/h, simulating human activity before dropping back to the basic level. Moisture production increased again between 4 and 10pm to 200g/h, accounting for activities such as cooking. To model these rooms, the convective surface heat transfer coefficients were set to fixed values at each building façade as follows:
Table 1 Surface Convective Heat Transfer Coefficient data for building model
Surface Heat Transfer Coefficients W/m2.K
hc,i hc,e
Internal wall 8 8 External wall 8 18
Ceiling 8 8
Floor 8 100
The convective mass transfer coefficient β (s/m) is then calculated in ESP-r by using the following analogy with the heat transfer coefficient (Equation 3):
β
=
h
c⋅
M
H2O⋅
(0.85)
ρ
⋅
C
p⋅
R
⋅
T
(3)The value 0.85 is representative of the Lewis number at standard atmospheric pressure.
The moisture permeability is determined by using Equation (4), substituting in the vapour diffusion resistance function and the relevant transfer coefficients:
δ
=
δ
aµ
=
δ
a1
a
+
be
cφ
∴
δ
=
δ
a×
(
a
+
be
cφ
)
(4)
Equation (5) is used in ESP-r to calculate the moisture content of a building material:
u
=
u
h1 .0
−
ln
φ
A
−1
n
(5)
A detailed description of ESP-r’s approach to modelling moisture transport and storage in building materials and the method used to discretise the building model spatially and temporally is given in Nakhi (1995)
[image:3.595.80.281.615.691.2]The moisture transport coefficients applied in equations 4 and 5 above describing the hygroscopic performance of theinternal wall lining materials are listed in Tables 2 and 3..
Table 2 Moisture Permeability data for Coated Gypsum Plaster (CGP) and Uncoated Gypsum
Plasterboard (UGP)
Moisture Permeability data
a b c
CGP 4.9e-05 (-) (-) UGP 0.0712 2.81e-03 4.1
Table 3 Sorption Isotherm data for Coated Gypsum Plaster (CGP) and Uncoated Gypsum Plasterboard
(UGP)
Sorption Isotherm data
Uh A n
CGP 0.012 0.007 0.015 UGP 150.0 2.99e-04 4.81
[image:3.595.311.522.658.708.2]fixed ground temperature of 2°C. The simulation timestep resolution was 15mins and 6 moisture nodes were applied to each layer in the building envelope construction. Using the gypsum plasterboard as an example, the spatial discretisation used translates to a moisture node applied every 2mm in a 12mm thick sample of gypsum plasterboard.
[image:4.595.69.287.238.480.2]The simulations were run over specified periods of the year (be specific – what periods?). The RH profiles for selected parts of the simulation periods for steps 1-3 are presented in Figures 1, 2 and 3.
[image:4.595.69.288.559.718.2]Figure 1 Measured vs. Predicted RH in Test Room (25.1.2005-26.1.2005)
Figure 2 Measured vs. Predicted RH in Test Room (17.2.2005-18.2.2005)
Figure 3 Measured vs. Predicted RH in Test Room (4.4.2005-5.4.2005)
Validation – Results and Discussion
In Figure 1, ESP-r is able to model the moisture balance in the Test Zone with close agreement to the measured data. The impact of coated moisture
permeable material in the Reference room on peak internal RH is not dissimilar to that of the peak humidity levels observed in the Test room. The RH fluctuations between moisture loading periods were smaller in the Reference room due to the damping effect of the moisture buffering potential in the walls. The results shown in Figure 2 show that the introduction of the uncoated Gypsum Plasterboard in the Test room walls raised the average RH, so that the dynamics of the RH profile in both rooms was similar. The predicted results for the Test room were not too dissimilar from the measured data, indicating that the modelling of the buffering effect of the material was adequate.
The addition of Gypsum Plasterboard to the ceiling of the Test room however, did result in a decrease of peak RH levels. The RH fluctuations and peak RH levels were dampened further in Figure 3 as more hygroscopic material was introduced to the Test Zone. The predicted peak humidity results for the Test Zone were similar to the measured peaks, showing the modelling of the absorption phase in the materials is reasonable. The average RH however, increased and was greater than that found in measured data. ESP-r models the absorption and desorption phases using the average of the two or the absorption isotherm alone. The higher RH observed in the Test Zone may be due to the increased release of moisture back into the zone and the omission of hysteresis effects in absorption/desorption of the material.
Comparisons with Other Tools
The performance of ESP-r illustrated in this paper is similar to other heat and moisture modelling tools. The overall reliability of ESP-r and other tool’s moisture predictions is requires further validation tests.. This is evidenced in in Figure 4. Here, a number of simulation tools (including ESP-r) were used to model another case study designed during the IEA Annex 41 programme. Clearly, there is little agreement and a large range of predictions.
Figure 4 Predictions of indoor RH conditions from a
range of building simulation tools (IEA Annex 41 – Subtask 1; Common Exercise 1 “Realistic” Case)
highlighting the variability in HAM modelling
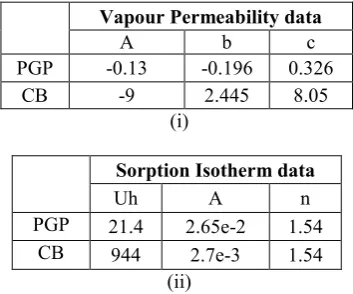
[image:4.595.307.525.562.726.2]As mentioned previously a key element of this paper is to assess ESP-r’s ability to model the response of a building to short duration moisture inputs. The NordTest procedure referred to earlier focused on relatively long periods of moisture injection. However, some shorter period experiments were conducted and these can be used as a reference against which to test ESP-r’s predictive capabilities. Using an environmental test chamber, two sample material specimens were exposed to a short duration period (2h) of high moisture loading, in the range 50-90%RH. The duration of the moisture exposure is closer to the lengths of moisture productions periods experienced in buildings (examples?). Accurate measurement of the material response under realistic time and moisture conditions is vital in reliably quantifying the material response (Janssen and Roels 2008). The materials tested were painted Gypsum Plasterboard (PGP) and Clayboard (CB) (manufactured product name is Claytec). The air temperature inside the chamber was maintained constant at 23°C. The conditioned air supplied to the chamber had a flow velocity of 0.5m/s and measured data (automatically weighed samples) was recorded at 10min intervals. The exact surface boundary conditions of the material specimens were not measured and the assumption was made that the air was well mixed and air flow over the samples was laminar. A convective heat transfer coefficient value of 2.3 W/m2.K was calculated using an expression for air flow through a square duct and applied to the ESP-r model as a constant.
[image:5.595.90.267.559.706.2]Tables 3 (i) and (ii) display the hygrothermal performance coefficients used for the materials used in the ESP-r model. The surfaces of the climate chamber were impermeable to moisture and therefore hygrothermal data for these was not required to set up the moisture model.
Table 3 Hygrothermal material property data for eqns 4 and 5, respectively.
Vapour Permeability data
A b c
PGP -0.13 -0.196 0.326 CB -9 2.445 8.05
(i)
Sorption Isotherm data
Uh A n PGP 21.4 2.65e-2 1.54
CB 944 2.7e-3 1.54 (ii)
The thicknesses of the Gypsum Plasterboard and Clayboard samples are 12.5 and 20mm respectively.
Short Duration Moisture Loading - Results and Discussion
A noticeable difference is recognised between moisture flux predictions made using a fixed vapour resistance factor and a RH-dependent function for vapour permeability. Figure 5 presents the results produced for the two materials when using a fixed vapour diffusion resistance factor (4 for CB and 7 for PGP) and a dynamic RH dependent function (equation 4?) for vapour permeability for both materials. Poor agreement between the measured and predicted data is observed when the resistance to moisture is represented by a fixed value for both the CB and PGP. The importance of having a comprehensive set of measured data for the permeability of both materials is apparent.
Further, a sensitivity analysis was conducted investigating the impact of the surface convective mass transfer coefficient by using a range of convective heat transfer coefficients. These were calculated using Nusselt numbers derived for laminar flow in ducts of varying geometry (Incropera 2002) and over a flat plate with fixed temperature (Neale et al 2007).
Figure 5 Comparison between measured and predicted surface moisture flux for range of materials
and hygrothermal properties
Figure 6 Impact of surface mass transfer coefficient on surface moisture flux predictions for Clayboard
Discussion
Simulations undertaken have indicated the importance and strong influence of material property data in moisture modelling. Integrating RH dependent material properties into this modelling exercise has been shown to have significant influence on predictions. By using a constant value to represent a materials vapour resistance, the observed modelled response of the PGP and CB under high RH was poor. Only during the initial stage of RH conditioning in the chamber, where there was a high vapour pressure difference between the air in the chamber and the material surface, was there a more pronounced effect on the resultant surface moisture flux. Applying a surface coating to one of the test samples did not greatly influence the predicted surface moisture flux. Using the moisture permeability properties for an uncoated gypsum plasterboard (UGP) sample, the magnitude and profile of the predicted moisture flux did not change dramatically when compared to results obtained using material properties for a painted surface (PGP). Previous studies have also shown that the permeability of a material may not be affected at all when applying surface coatings e.g. paint (Ramos et al 2010).
Moisture release model
The primary aim of this exercise was to ensure that ESP-r was able to adequately model moisture release rates, as a specific interest of this modelling investigation was the passive drying of domestic laundry. This process was investigated by modelling an item of clothing being dried passively on a clothes airer in a real home environment. The indoor climate variables measured at 1min intervals were the RH at three different points on the airer and in the air surrounding the clothes; and the indoor air temperature (which was reasonably steady). The average indoor air temperature imposed on the model. The indoor RH was measured to be approximately constant at 67RH%. An infiltration rate of 0.5ac/h was applied to the model. Particular focus was on the moisture evaporation taking place at the surface of the clothing and being able to predict this behaviour within reasonable agreement to
measured data. A more detailed investigation of the drying process would require more accurate knowledge of the material moisture properties and surface boundary conditions in order to replicate the different stages of this dynamic process. However, material homogeneity was assumed and emphasis was on ensuring the dynamic characteristics of the moisture released by evaporation alone at the surface of the material could be adequately modelled. The heat transfer coefficients were calculated based on buoyancy forces at the surface thus taking into account changes in surface temperature, which is the default approach used in ESP-r. Again, a more detailed investigation would include a more accurate representation of the boundary conditions based on direct measurements being applied to the model. The drying period of a range of clothing items was hence measured and the mass of each item was recorded every 1 to 2 hours. The clothes were assumed initially saturated, discounting the effects of the different drying stages and hence the different modes of moisture transfer taking place through the pore network of the clothing.
Four variants of the equation used to calculate the evaporation rate are shown below. The sources of these equations were developed and tested.
p air surf s c
h
h
A
C
e
ev
=
⋅
⋅
⋅
(
ω
−
ω
)
/
(6)p air surf s
c
A
C
h
ev
=
⋅
⋅
(
ω
−
ω
)
/
(7) tair sat surf
sat s
m
A
p
p
h
ev
=
⋅
⋅
(
,−
(
φ
⋅
,))
exp (8)t air sat surf
sat s m
h
h
A
p
p
e
ev
=
⋅
⋅
⋅
(
,−
(
φ
⋅
,))
exp (9)The term eh has been formed to represent the ratio
between the moisture evaporated and the initial moisture at the material surface. This is calculated using the following expression:
i e h
m
m
e
=
1
.
0
−
(12)Results and Discussion - Drying
[image:6.595.71.290.68.199.2]Figure 7 Comparison between measured data and predicted results for drying T-shirt
Discussion - Drying
Equation (7) was the original equation implemented in ESP-r to calculate the rate of evaporation from a surface. This incorporates a simplified version of the Lewis relationship for determining the mass transfer coefficient. The predicted results showed good agreement at the initial stages of the drying period. However, the correlation with measured data deteriorated after this initial stage. Equation (6) was adapted from the original version of the evaporation rate equation by introducing the evaporative history coefficient. This allowed for the model to take into account what moisture had already evaporated in addition to the difference calculated between surface and air humidity ratios at each time step. With the exception of the facecloth, the level of agreement between predicted and measured data was poor although the profile of the moisture release rate was more in line with that of the measured data. Equation (8), based on the original equation found in Tang and Etzion (2004), introduces the heat and mass transfer analogy used in ESP-r to determine the convective mass transfer coefficient. Reasonable agreement at the initial stage of drying was observed for most of the clothes items. For items with a higher hygroscopicity such as jeans, the correlation between predicted and measured was worse. Finally, Equation (9) was a case of adding the evaporative history coefficient to Equation (8). Good agreement was produced for the majority of the items except for the towel and jeans.
The empirical approach used for this particular study allowed a reasonable model of the moisture release process to be developed with satisfactory agreement between measured and predicted surface moisture concentrations.
A detailed model of the moisture transfer and storage processes experienced by the clothing materials would be a further improvement. However, this requires significant further study.
CONCLUSION
This paper presented the application of the moisture modelling facility in the integrated whole building simulation tool ESP-r for analysing a range of short-duration moisture related scenarios commonly observed in the building environment. These included modelling a realistic case taken from the IEA Annex 41 with focus on the moisture buffering performance of different materials. Reasonable agreement was observed between predicted and measured data when (a) assessing the impact of impermeable internal wall linings materials, thus indicating the air mass balance model is adequate; and (b) simulating the absorption phase of permeable internal wall lining materials. The level of correlation was not as strong during the desorption phase, raising concern over the omission of hysteresis phenomena and surface transfer parameters, such as the effects of surface air flow velocity, in the model. The level of uncertainty however, between simulation tools modelling another IEA Annex 41 case study, was highlighted. A second exercise involved the numerical modelling of the hygrothermal effect of a short duration, high intensity moisture loading cycle on a Clayboard and Painted Gypsum Plasterboard sample. Adequate agreement was observed between predictions of the material surface moisture flux and measured data for painted gypsum plasterboard. The predictions for the Clayboard followed the profile and dynamics of the measured data although a difference in magnitude was observed. A number of issues arose from this exercise with relation to material moisture property data, signifying the importance of integrating dynamic material property functions. The sensitivity of predictions to the surface mass transfer coefficient was also presented, prompting the need for more detailed study of air flow conditions in the experimental procedure. Following on from this, a final exercise was conducted to assess the modelling of moisture release rates from drying laundry. This involved another sensitivity analysis on the influence of the surface mass transfer coefficient and the evaporation rate calculation. The performance of the model showed improvement when compared to measured data as the evaporation equations adopted were applied. In order to develop the model further, additional properties should be investigated. Air flow conditions at the surface of the clothes however were not known, hence ignoring the intrinsic effect on heat and mass transfer. Sorption properties of the clothes items would need to be measured, thus recognising the moisture behaviour and associated phases in the pore structure. This includes the liquid and vapour diffusion that may occur and the different driving forces associated with the different drying periods. The model developed was applied to assess the options for passive drying of clothes through a series of parametric simulation tests and are described in Porteous et al (2012).
a = experimentally determined coefficient (-) A = experimentally determined coefficient (-) Mmax = maximum mass of moisture in sample (g) As = exposed surface area of sample (m2) b = experimentally determined coefficient (-) bm = moisture effusivity (kg/m2.Pa.s1/2) c = experimentally determined coefficient (-) Cp = specific heat capacity of air (J/kg.K) ev = evaporation rate (kg/s)
eh = evaporative history coefficient (-) expt = exponent
G(t) = total moisture flux at the surface (kg/m2) hc = convective heat transfer coefficient (W/m
2
.K) hc,i = internal surface convective heat transfer coefficient (W/m2.K)
hc,e = external surface convective heat transfer coefficient (W/m2.K)
hm = convective mass transfer coefficient (s/m) HIR* = Hygric Inertia of a Room (kg/m2.%RH) MBV* = Moisture Buffer Value (kg/%RH) Mmin = minimum mass of moisture in sample (g) MH2O = molecular weight of vapour (kg/kmole) me = mass of evaporated moisture (kg) mi = initial mass of moisture at surface (kg) n = empirically fixed component (-) ps = saturation vapour pressure (Pa) R = universal gas constant (J/kmole.K) tp = time period (h)
T = air temperature (K) u = moisture content (kg/m3)
uh = maximum hygroscopically bound water (kg/m3)
α = weighting factor (-)
β
= convective mass transfer coefficient (s/m)
δ = moisture permeability (kg/m.s.Pa)
δa = moisture permeability of stagnant air (kg/m.s.Pa)
∆
RH
= change in relative humidity (-)
µ = vapour resistance factor (-)
ρ = density of material (kg/m3)
φ = relative humidity (-)
ωair = humidity ratio of air (kg/kg dry air)
ωsurf = humidity ratio at surface (kg/kg dry air)
REFERENCES
Abadie MO, Mendonca KC, 2009, Moisture performance of building materials: From material characterization to building simulation using the Moisture Buffer Value concept, Building and Environment, 44: 388-401
Cerolini S, D’Orazio M, Di Perna C, Stazi A, 2009, Moisture buffering capacity of highly absorbing materials, Energy and Buildings, 41: 164-168 Clarke J A (2001) Energy Simulation in Building
Design (2nd Edn), London: Butterworth-Heinemann, ISBN 0 7506 5082 6
Cunningham MJ, 2003, The building volume with hygroscopic materials – an analytical study of a
classical building physics problem, Building and Environment, 38: 329-337
Defraeye T, Blocken B, Derome D, Nicolai B, Carmeliet J, 2012, Convective heat and mass transfer modelling at air-porous material interfaces: Overview of existing methods and relevance, Chemical Engineering Science, 74: 49-58
Goto Y, Wakili KG, Frank T, Stahl T, Ostermeyer Y, Ando N, Wallbaum H, 2012, Heat and moisture balance simulation of a building with vapor-open envelope system for subtropical regions, Building Simulation, 5: 301-314
Haverinen U, Vahteristo M, Moschandreas D, Nevalainen A, Husman T, Pekkanen J, 2003, Knowledge-based and statistically modeled relationships betwenn residential moisture damage and occupant reported health symptoms, Atmospheric Environment, 37: 577-585
Heinrich J, 2011, Influence of indoor factors in dwellings on the development of childhood asthma, Int Journal of Hyg and Env Health, 214: 1-25
Hersoug LG, 2005, Viruses as the causative agent related to ‘dampness’ and the missing link between allergen exposure and onset of allergenic disease, Indoor Air, 15: 363:366 IEA Annex 41, 2008, Whole Building Heat, Air and
Moisture Response ,
(www.ecbcs.org/annexes/annex41.htm) Incropera FP, Dewitt DP (2002) Fundamentals of
Heat and Mass Transfer (5th Edn), John Wiley & Sons, ISBN 0-471-38650-2
Jansen H, Roels S, 2008, The dependable characterisation of the moisture buffer potential of interior claddings, Proceeding of the “Nordic Symposium on Building Physics 2008”, Copenhagen, Denmark
Janssen H, Roels S, 2009, Qualitative and quantitative assessment of interior moisture buffering by enclosures, Energy and Buildings, 41: 382-394
Jones AP, 1999, Indoor air quality and health, Atmospheric Environment, 33: 4535-4564 Kumaran MK, 2006, A Thermal and moisture
property database for common building and insulation materials, ASHRAE Transactions, 112: 1-13
Li Y, Fazio P, Rao J, 2012, An investigation of moisture buffering performance of wood paneling at room level and its buffering effect on a test room, Building and Environment, 47: 205-216
Nakhi A E, 1995, Adaptive Construction Modelling within Whole Building Dynamic Simulation, University of Strathclyde
Conference on Building Science and Technology, Banff, Alberta, Canada
Pedersen CR, 1992, Prediction of Moisture Transfer in Building Constructions, Building and Environment, 27: 387-397
Porteous CDA, Sharpe TR, Menon RA, Shearer D, Musa H, Baker PH, Sanders CH, Strachan PA, Kelly NJ, Markopoulos A, 2012, Energy and environmental appraisal of domestic laundering appliances, Building Research and Information, 40: 679-699
Ramos NMM, Delgado JMPQ, de Freitas VP, 2010, Influence of finishing coatings on hygroscopic moisture buffering in building elements, Construction and Building Materials, 24: 2590-2597
Rode C, Peuhkuri R, Time B, Svennberg K, Ojanen T, 2007, Moisture Buffer Value of Building Materials, Journal of ASTM International, Volume 4, Issue 5
Roels S, Taludkar P, James C, Simonson CJ, 2010, Reliability of material data measurements for hygroscopic buffering, Int Journal of Heat and Mass Transfer, 53: 5355-5363
Sherman MH, Walker IS, 2011, Meeting residential ventilation standards through dynamic control of ventilation systems, Energy and Buildings, 43: 1904-1912
Steeman HJ, Janssens A, Carmeliet J, De Paepe M, 2009a, Modelling indoor air and hygrothermal wall interaction in building simulation: Comparison between CFD and a well-mixed zonal model, Building and Environment, 44: 572-583
Steeman HJ, Belleghem MV, Janssens A, De Paepe M, 2009b, Coupled simulation of heat and moisture transport in air and porous materials for the assessment of moisture related damage, Building and Environment, 44: 2176:2184 Tang R, Etzion Y, 2004, Comparative studies on the
water evaporation from a wetted surface and that from a free water surface, Building and Environment, 39: 77-86