City, University of London Institutional Repository
Citation:
Lau, W.H.W. (1988). The behaviour of clay in simple shear and triaxial tests. (Unpublished Doctoral thesis, City University London)This is the accepted version of the paper.
This version of the publication may differ from the final published
version.
Permanent repository link:
http://openaccess.city.ac.uk/8347/Link to published version:
Copyright and reuse: City Research Online aims to make research
outputs of City, University of London available to a wider audience.
Copyright and Moral Rights remain with the author(s) and/or copyright
holders. URLs from City Research Online may be freely distributed and
linked to.
City Research Online: http://openaccess.city.ac.uk/ [email protected]
THE BEHAVIOUR OF CLAY IN
SIMPLE SHEAR AND TRIAXIAL TESTS
by
William Hon Wai LAU
13.Sc., M.Sc., D.I.C.
A thesis submitted for the degree of
Doctor of Philosophy
at
The City University
Civil Engineering Department
CONTENTS
Page
List of tables 8
List of figures 10
Acknowledgements 22
Declaration 23
Abstract 24
List of symbols 25
CHAPTER 1 INTRODUCTION 32
CHAPTER 2 BASIC THEORY 34
2.1 Introduction 34
2.2 Preliminaries 34
2.2.1 Stresses and strains in soils 34
2.2.2 The principle of effective stress 35
2.2.3 Pure shear strain and engineer's shear strain 35
2.2.4 Mohr's circles of stress and strain 35
2.2.5 Definition of stress parameters 36
2.2.6 Definition of strain parameters 37
2.2.7 Correspondence between parameters for
stress and strain 38
2.2.8 Relationships between ordinary strains
and natural strains 39
2.3 Analysis of stresses and strains in simple
shear tests 40
2.3.1 Analysis of stresses 40
2.3.2 Analysis of strains L3
2.4 Elasticity and plasticity for soils 45
2.4.1 Purely elastic stress-strain behaviour 45
2.4.2 Purely plastic stress-strain behaviour 49
2.4.3 Elasto-plastic stress-strain behaviour 51
2.5 The critical state model 53
2.5.1 One-dimensional compression 53
2.5.2 One-dimensional consolidation 55
2.5.3 Critical states 57
2.5.4 The state boundary surface 62
2.5.5 Stress-strain relationships inside the
state boundary surface 64
2.5.6 Stress-strain relationships on the
2.6 Normalising test data 66
2.6.1 Idealised soil behaviour 66
2.6.2 Normalised critical states 67
2.6.3 Normalised state paths 69
2.6.4 Normalised tangent stiffnesses 71
2.7 Summary 73
CHAPTER 3 A REVIEW OF PREVIOUS WORK 76
3.1 Introduction 76
-I
3.2 Shear testing of soils 76
3.2.1 Shear testing apparatus 76
3.2.2 Basic designs of simple shear apparatus 78
3.3 Problems with simple shear apparatus 80
3.3.1 Non-uniformities of stresses and strains 80
3.3.2 Methods for estimating states of stress 84
3.4 Application of triaxial parameters to plane
strain conditions 91
3.5 Previous test results 94
3.5.1 Results on Cowden till 94
3.5.2 Results on London clay 96
3.6 Summary 101
CHAPTER 4 ENGINEERING GEOLOGY 103
4.1 Introduction 103
4.2 Locations of soils 1 03
4.2.1 Cowden till 103
4.2.2 London clay 1 03
4.3 Regional geology 104
4.3.1 Cowden till deposit 1 04
4.3.2 London clay deposit 105
4.4 Drift geology 106
4.4.1 Cowden till test bed site 106
CHAPTER 5 EQUIPMENT AND TESTING PROCEDURES 109
5.1 Introduction 109
5.2 Equipment for sample preparation and setting up 110
5.2.1 Simple shear samples 110
5.2.2 Triaxial samples with 38 mm diameter 110
5.2.3 Triaxial samples with 100 mm diameter 111
5.2.4 Shear box samples 111
5.3 NGI simple shear apparatus 111
5.3.1 General description 111
5.3.2 Calibration and accuracy 113
5.4 Stress path testing equipment for samples with
38 mm diameter 115
5.4.1 General description 115
5.4.2 Calibration and accuracy 119
5.5 Stress path testing equipment for samples with
100 mm diameter 122
5.5.1 General description 1 22
5.5.2 Calibration and accuracy 125
5.6 Shear box apparatus 1 26
5.6.1 General description 126
5.6.2 Calibration and accuracy 128
5.7 Procedures for preparation of simple shear samples 128
5.7.1 Undisturbed Cowden till 1 28
5.7.2 Undisturbed London Clay (brown and blue) 129
5.7.3 Remoulded Cowden till 129
5.7.4 Remoulded London clay (brown and blue) 130
5.7.5 Reconstituted Cowden till 1 30
5.8 Procedures for preparation of triaxial samples 131
5.8.1 Reconstituted London clay (blue) with
38 mm diameter 131
5.8.2 Undisturbed London clay (brown and blue)
with 100 mm diameter 132
5.9 Procedures for preparation of shear box samples 1 32
5.9.1 Undisturbed Cowden till 132
5.9.2 Undisturbed London clay (brown) 1 32
5.9.3 Remoulded Cowden till 133
5.9.4 Remoulded London clay (brown) 1 33
5.10 Procedures for simple shear tests 133
5.10.1 Setting up 133
5.10.2 One-dimensional compression and
5.10.3 Shearing 1 34
5.10.4 Post-shearing 135
5.11 Procedures for stress path tests on samples with
38 mm diameter 136
5.11.1 Setting up 1 36
5.11.2 One-dimensional compression 138
5.11.3 Shearing 1 38
5.11.4 Post-shearing 139
5.12 Procedures for stress path tests on samples with
100 mm diameter 139
5.12.1 Setting-up 139
5.12.2 Pre-shearing and pre-probing 140
5.12.3 Shearing and stress probing 1 41
5.12.4 Post-testing 1 142
5.13 Procedures for shear box tests 1 42
5.13.1 Setting up 142
5.13.2 One-dimensional compression 1 43
5.13.3 Shearing 143
5.13.4 Post-shearing 1 43
CHAPTER 6 TEST RESULTS 144
6.1 Introduction : 1 44
6.2 Classification tests 144
6.3 One-dimensional compression 1 44
6.3.1 Cowden till 145
6.3.2 London clay (brown) 1 45
6.3.3 London clay (blue) 146
6.3.4 Normal compression lines and
swelling lines 1 46
6.4 One-dimensional consolidation 147
6.4.1 Cowden till 147
6.4.2 London clay (brown) 147
6.4.3 London clay (blue) 1 48
6.5 Simple shear tests 148
6.5.1 Cowden till 1 48
6.5.2 London clay (brown) 148
6.5.3 London clay (blue) 1 48
6.6 Shear box tests 149
6.6.1 Cowden till 149
6.7 Stress path tests on samples with 38 mm diameter 149
6.7.1 London clay (blue) 149
6.8 Stress path tests on samples with 100 mm diameter 150
6.8.1 London clay (brown and blue) 150
CfJAPTER 7 ANALYSES AND DISCUSSIONS 151
7.1 Introduction 151
7.2 Discussion on classification test results 151
7.2.1 Cowden till 151
7.2.2 London clay (brown) 1 52
7.2.3 London clay (blue) 153
7.3 Discussion on one-dimensional compression 153
7.3.1 Cowden till 153
7.3.2 London clay (brown) 155
7.3.3 London clay (blue) 156
7.4 Discussion on one-dimensional consolidation 1 58
7.4.1 Cowden till 158
7.4.2 London clay (brown) 159
7.4.3 London clay (blue) 159
7.5 Critical states in shear tests and triaxial tests 160 7.5.1 Identification of critical and peak states 160 7.5.2 Difference between constant and
constant volume simple shear tests 164
7.5.3 Influence of K 0 on critical states 1 66
7.5.4 Undrained shear strength 169
7.5.5 Normalised critical states 171
7.5.6 Summary 172
7.6 State paths for simple shear tests and triaxial
tests 174
7.6.1 Discussion on state paths 174
7.6.2 Discussion on normalised state paths 178
7.7 Stiffnesses determined from simple shear tests
and stress path tests 180
7.7.1 Tangent stiffnesses from simple shear
and triaxial tests 180
7.7.2 Tangent stiffnesses from probing tests 184
7.7.3 Normalised tangent stiffnesses from
simple shear and triaxial tests 188
7.7.4 Normalised tangent stiffnesses from
probing tests 190
CHAPTER 8 CONCLUSIONS ANT) RFX1)MMFNDTTON.S POP
FURTHER WORK 193
8.1 Conclusions for one-dimensional compression
and consolidation 193
8.2 Conclusions for critical states 193
8.3 Conclusions for state paths 194
8.4 Conclusions for stiffnesses 1 95
8.5 Practical implications of conclusions 196
8.6 Recommendations for &rther work 197
APPENDICES
APPENDIX A
APPENDIX B
APPENDIX C
APPENDIX D
APPENDIX E
198
Expressions for anisotropic elastic parameters
Expressions for normalised tangent stiffness parameters
Estimation of inaccuracy in volumetric
strain due to deformation of reinforced membrane of simple shear apparatus
Effect of pins on shear strain and slips in simple shear tests
Excess pore pressures in simple shear samples during shearing
198
199
202
203
204
List of tables
3.1 Critical state parameters for Cowden till (after Ng,1988)
3.2 Summary of classification test results for London clay
5.1 Summary of estimated maximum values for inaccuracies in NGI simple shear apparatus
5.2 Resolutions of measurements obtained by stress path testing equipment for samples with 38 mm diameter
5.3 Typical values of ina;curacies of measurements obtained by stress path testing equipment for samples with 38 mm diameter
5.4 Resolutions and typical values of inaccuracies of measurements obtained by stress path testing equipment for samples with 100 mm diameter
5.5 Borehole numbers, sample tube numbers and depths of undisturbed samples
5.6 Sequence and values of vertical stresses applied on simple shear samples during one-dimensional compression
6.1 Results of classification tests
6.2 Summary of one-dimensional compression and swelling parameters
6.3 Results of one-dimensional consolidation for Cowden till simple shear samples
6.4 Results of one-dimensional consolidation for London clay (brown) simple shear samples
6.5 Results of one-dimensional consolidation for London clay (blue) simple shear samples
6.6 Summary of states before shearing and type of shearing for Cowden till simple shear samples
6.7 Summary of states before shearing and type of shearing for London clay simple shear samples
6.8 Summary of states before shearing for Cowden till and London clay (brown) shear box samples
6.9 Summary of states before undrained shearing of 38 mm reconstituted triaxial samples of London clay (blue)
6.10 Summary of states before undrained shearing of 100 mm undisturbed triaxial samples of London clay (blue)
7.1 Peak and critical states for simple shear tests on Cowden till
7.2 Peak and critical states for simple shear tests on London clay (brown)
7.3 Peak and critical states for simple shear tests on London clay (blue)
7,4 Peak and critical states for shear box tests on Cowden till
7.5 Peak and critical states for shear box tests on London clay (brown)
7.6 Peak and critical states for stress path tests on 38 mm reconstituted London clay (blue) samples
7.7 Peak states for stres path tests on 100 mm undisturbed London clay (blue) samples
7.8 Estimation of O ç t values for undisturbed simple shear and shear box samples
E.1 Excess pore pressures in simple shear sample U39 during shearing
List of figures
2.1 Two-dimensional stresses and strains
2.2 Pure shear strain and engineer's shear strain
2.3 Mohr's circles of stress and strain
2.4 External loads, boundary displacements and increment of simple shear strain
2.5 Stresses in simple shear sample
2.6 Nohr's circle of stress for simple shear sample
2.7 Planes subjected to maximum stress ratio
2.8 Strain increments of simple shear sample
2.9 Mohr's circles of strain increment for simple shear sample
2.10 Directions of zero strain increment
2.11 Mohr's circle of strain increment for constant volume shearing
2.12 Mohr's circle of stress increment for an isotropic elastic simple shear sample
2.13 Examples of stress-strain behaviour of purely plastic soils
2.14 Yield curves at different specific volumes for a purely plastic soil
2.15 Projection of yield curves on p',q' plane
2.16 Example of stress-strain behaviour of an elasto-plastic soil
2.17 Elastic walls of an elasto-plastic soil
2.18 The complete state boundary surface (after Atkinson and Bransby, 1 978)
2.19 (a) Constant volume section of state boundary surface and (b) wet and dry side of critical
2.20 The J(time) curve fitting method
2.21 Influence of K 0 Ofl
Pcs'
for simple shear tests 2.22 Critical state lines for simple shear tests2.23 Idealised behaviour of soil in undrained triaxial compression tests
2.25 2.26 :3.1 3.2 3.3 3.4 3.5 3.6 3.7 3.8 3.9 3.10 3.11 3.12 3.13 3.14 3.15 3.16 3.17 3.18 3.19 3.20
Ideal normalised behaviour of soil in triaxial compression tests
Normalising parameters for simple shear tests
Basic designs of simple shear apparatus
Arrangement of load cells in Cambridge simple shear apparatus
Pattern of non-uniform stress distribution due to lack of complementary shear stress
Stress distributions on simple shear sample calculated by mathematical analyses (after Roscoe, 1953)
Stress distributions on simple shear sample calculated by finite element analyses lafter Lucks et al, 1972)
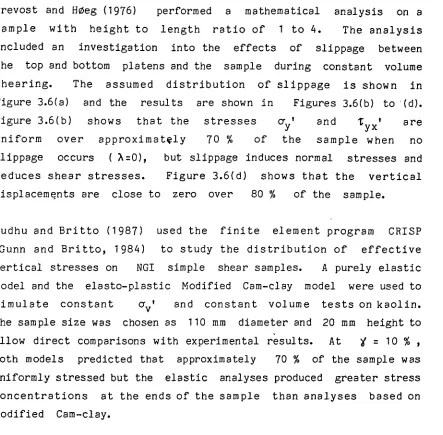
Effects of slippage (after Prevost and Hoeg,1976)
Finite element analyses (after Duncan and Dunlop, 1969)
Three areas of a simple shear sample
Stress distributions on the principal third of normally compressed kaolin samples (Airey,1984)
Comparison of average and sample core shear stresses in a constant o' test (Airey,1984)
Possible modes of failure in simple shear proposed by De Josselin de Jong (1972)
Results of an undrained simple shear test on normally compressed kaolin (Borin,1973)
Possible stress state at failure in simple shear suggested by Ladd and Edgers (1972)
Load cell measurements from the principal third of a Cambridge simple shear sample (after Budhu and Wood, 1979)
Rotations of principal axes of stress and strain increment for a simple shear test on kaolin (after Bonn, 1973)
Relation between stress ratio and rotation of principal stress axes
Comparison of Mohr's circles of stress at failure constructed using two different methods (Airey,1984)
Basic test data obtained using MGI simple shear apparatus with radial stress measurements (Dyvik and Zimmie, 1983)
Effective stress paths and Mohr's circles of stress plotted using data shown in Figure 3.18
3.21
Relation between stress ratio and rotation of principal stress
axes plotted using data shown in Figure 3.18
3.22
Comparison of triaxial test and plane strain test results for
Brasted sand (after Cornforth, 1964)
3.23
Comparison of triaxial test and plane strain test results for
Weald clay (after I-ienkel and Wade,1966)
3.24
Test results on Cowden till (after Gens and E-iight, 1979)
3.25 Effective stress paths for undrained triaxial tests on Cowden
till (after Atkinson et al, 1985a)
3.26
Critical states for reconstituted and remoulded samples and end
states for undisturbed samples of Cowden till (after Atkinson
et al, 1985a)
3.27
Results of oedometer tests on London clay (Sorn,1968)
3.28 Estimation of maximum previous effective vertical stress
due to overburden in the ground for undisturbed samples
(after Som, 1968)
3.29
Stress states at peak deviator stress for undisturbed London
clay (after Sandroni, 1977)
3.30
Test results on undisturbed London clay (after Apted, 1977)
3.31
Results of standard shear box tests on undisturbed London clay
(after Agarwal, 1967)
3.32
Stress-strain curves for undrained triaxial tests on
undisturbed London clay (after Sandroni, 1977)
3.33
Stress-strain curves for undrained triaxial tests on
undisturbed London clay (after Costa Filho, 1980)
4.1
Location of BRE Cowden till test bed site
4.2
Location of BRE London clay test bed site
4.3
Surface contours of chalk at Cowden (after Marsland and Powell,
1985)
4.4
Possible extent of Quaternary ice sheets (after Marsland and
Powell, 1985)
4.5
Possible extent of glacial advances during the Devensian (after
Marsiarid arid Powell, 1985)
4.6
Regional geology of the London basin (after Som, 1968)
4.7
Cross-section through the London basin (after Sherlock, 1962)
4.8
Geology of the Brent area
4.10 Typical soil profile at Cowden till test bed site (after Marsiand and Powell, 1985)
4.11 Particle size distribution of Cowden till
4.12 Typical soil profile at London clay test bed site (after Powell and IJglow, 1986)
4.13 Typical mineralogy of London clay (after Burnett and Fookes, 1974)
5.1 Equipment for preparing and setting up simple shear samples
5.2 NGI simple shear apparatus
5.3 Calibration curves for proving rings of NGI simple shear apparatus
5.4 Shear resistance of reinforced membrane of NGI simple shear apparatus
5.5 Compliance of vertical loading system of NGI simple shear apparatus
5.6 Diagrammatic layout of Spectra system
5.7 Bishop and Wesley hydraulic stress path cell for samples with 38 mm diameter
5.8 Main feed-back control loop of 'SPCTRA' program (after Atkinson et al, 1985b)
5.9 Calibration of pressure transducers for stress path testing
5.10 Calibration of axial displacement transducer for stress path testing
5.11 Diagrammatic layout of stress path testing equipment for
samples with 100 mm diameter (after Atkinson and Clinton, 1984)
5.12 Diagrammatic layout of hydraulic stress path cell for samples with 100 mm diameter (after Clinton, 1987)
5.13 Preparation of reconstituted Cowden till simple shear sample
5.14 Reconstituted Cowden till simple shear sample
5.15 Preparation of reconstituted London clay (blue) triaxial sample with 38 mm diameter
5.16 Pre-shearing effective stress paths specified for stress path tests on undisturbed London clay (blue) samples with 100 mm diameter
5.17 Specified effective stress paths and specified rates of loading for stress probing test TUB1
6.1 6.2 6.3 6.4 6.5 6.6 6.7 6.8 6.9 6.10 6.11 6.12 6.13 6.14 6.15 6.16 6.17 6.18 6.19 6.20
Results of particle size distribution tests
Results of one-dimensional compression from Cowden till simple shear samples
Results of one-dimensional compression from Cowden till shear box samples
Results of one-dimensional compression from London clay (brown) simple shear samples
Results of one-dimensional compression from London clay (brown) shear box samples
Results of one-dimensional compression from London clay (blue) simple shear samples
Results of one-dimensional compression from 38 mm reconstituted London clay (blue) triaxial samples
Results of one-dimensional consolidation from simple shear samples
Results of shearing from remoulded Cowden till simple shear samples
Results of shearing from reconstituted Cowden till simple shear samples
Results of shearing from undisturbed Cowden till simple shear samples
Results of shearing from remoulded London clay (brown) simple shear samples
Results of shearing from undisturbed London clay (brown) simple shear samples
Results of shearing from remoulded London clay (blue) simple shear samples
Results of shearing from undisturbed London clay (blue) simple shear samples
Results of' shearing from undisturbed Cowden till shear box samples
Results of shearing from remoulded Cowden till shear box samples
Results of shearing from undisturbed London clay (brown) shear box samples
Results of shearing from remoulded London clay (brown) shear box samples
6.21 Results of shearing from 100 mm undisturbed London clay (blue) triaxial samples
6.22 Results of stress probing from 100 mm undisturbed London clay (brown) triaxiel sample TUB1
6.23 Results of stress probing from 100 mm undisturbed London clay (blue) triexial sample TUL5
6.24 Shear stress versus shear strain curves for probing tests on 100 mm undisturbed London clay triaxial samples
7.1 Comparison of results from particle size distribution tests
7.2 Comparison of results for one-dimensional compression
7.3 Variation of stress ratio with shear strain for remoulded Cowden till simple shear samples
7.4 Variation of stress ratio with shear strain for reconstituted Cowden till simple shear samples
7.5 Variation of stress ratio with shear strain for undisturbed Cowden till simple shear samples
7.6 Variation of stress ratio with shear strain for remoulded London clay (brown) simple shear samples
7.7 Variation of stress ratio with shear strain for undisturbed London clay (brown) simple shear samples
7.8 Variation of stress ratio with shear strain for remoulded London clay (blue) simple shear samples
7.9 Variation of stress ratio with shear strain for undisturbed London clay (blue) simple shear samples
7.10 Variation of stress ratio with shear strain for undisturbed Cowden till shear box samples
7.11 Variation of stress ratio with shear strain for remoulded Cowden till shear box samples
7.12 Variation of stress ratio with shear strain for undisturbed London clay (brown) shear box samples
7.13 Variation of stress ratio with shear strain for remoulded London clay (brown) shear box samples
7.14 Variation of stress ratio with shear strain for 38 mm reconstituted London clay (blue) triexiel samples
7.15 Variation of stress ratio with shear strain for 100 mm undisturbed London clay (blue) triexiel samples
7.17 Critical states for simple shear tests on undisturbed Cowden till
7.18 Critical states for simple shear tests on remoulded London clay (brown and blue)
7.19 Critical states for simple shear tests on undisturbed London clay (brown and blue)
7.20 Critical and peak states for 38 mm reconstituted London clay (blue) triaxial samples
7.21 Peak states for 100 mm undisturbed London clay (blue) triaxial samples
7.22 Variation of angle of rotation for principal stresses and principal strain increme;ts in simple shear tests on normally compressed remoulded London clay (brown)
Critical state Mohr's circles of stress for simple shear tests on remoulded London clay (brown)
Developments of Mohr's circles of stress in simple shear tests on normally compressed remoulded London clay (brown)
Relationships among
0 cs
'
' Pcs' and 9csRelationship among
0
cs ' ' Pcs'
and K0Variation of K 0 with OCR measured from 38 mm reconstituted triaxial samples
Variation of 'v'1°v'cS with OCR and for remoulded and reconstituted simple shear samples of Cowden till
Variation of (tv'/clv')cs with OCR and K 0 for remoulded simple shear samples of London clay (brown and blue)
Variation of v''0v')cs with OCR for undisturbed simple shear samples
Variation of v"°v'cs with OCR for undisturbed shear box
samples
Variation of critical state lines with OCR for simple shear
samples
Comparisons of ('j') and cu from simple shear tests with c from triaxial tests or London clay
Normalised critical states for simple shear tests on remoulded
Cowden till
Normalised critical states for simple shear tests on undisturbed Cowden till
Normalised critical states for simple shear tests on remoulded London clay (blue)
7.37
Normalised critical states for simple shear tests on undisturbed London clay (blue)7.38
Nornalised critical and peak states for stress path tests on38
mm reconstituted London clay (blue) samples7.39
State paths for remoulded Cowden till simple shear samples7.40
State paths for reconstituted Cowden till simple shear samples7.41
State paths for undisturbed Cowden till simple shear samples7.42
State paths for remoulded London clay (brown) simple shear samples7.43
State paths for undisturbed London clay (brown) simple shear samples7.44
State paths for remoulded London clay (blue) simple shear samples7.45
State paths for undisturbed London clay (blue) simple shear samples7.46
State paths for38
mm reconstituted London clay (blue) triaxial samples7.47
State paths for 100 mm undisturbed London clay (blue) triaxial samples7.48
Estimated simple shear stress paths on p',q' plane7.49
Normalised state paths for remoulded Cowden till simple shear samples7.50
Normalised state paths for reconstituted Cowden till simple shear samples7.51
Normalised state paths for undisturbed Cowden till simple shear samples7.52
Normalised state paths for remoulded London clay (brown) simple shear samples7.53
Normalised state paths for undisturbed London clay (brown) simple shear samples7.54
Normalised state paths for remoulded London clay (blue) simple shear samples7.55
Normalised state paths for undisturbed London clay (blue) simple shear samples7.56
Roscoe surface for remoulded Cowden till simple shear samples7.57
Roscoe surface for remoulded London clay (blue) simple shear samples7.59
7.60
7.61
7.62
7.63
7.64
7.65
7.66
7.67
7.68
7.69
7.70
7.71
7.72
7.73
7.74
7.75
7.76
Normalised state paths for 100 mm undisturbed London clay (blue) triaxial samples
Comparison of normalised state paths for undisturbed and reconstituted London clay (blue) triaxial samples
Variation of shear stress with logarithm of shear strain for remoulded Cowden till simple shear samples
Variation of shear stress with logarithm of shear strain for reconstituted Cowden till simple shear samples
Variation of shear stress with logarithm of shear strain for undisturbed Cowden till simple shear samples
Variation of shear stress with logarithm of shear strain for remoulded London clay (brt*in) simple shear samples
Variation of shear stress with logarithm of shear strain for undisturbed London clay (brown) simple shear samples
Variation of shear stress with logarithm of shear strain for remoulded London clay (blue) simple shear samples
Variation of shear stress with logarithm of shear strain for undisturbed London clay (blue) simple shear samples
Variation of shear stress with logarithm of shear strain for
38
mm reconstituted London clay (blue) triaxial samplesVariation of shear stress with logarithm of shear strain for 100 mm undisturbed London clay (blue) triaxial samples
Variation of tangent shear stiffness with logarithm of shear strain for remoulded Cowden till simple shear samples
Variation of tangent shear stiffness with logarithm of shear strain for reconstituted Cowden till simple shear samples
Variation of tangent shear stiffness with logarithm of shear strain for undisturbed Cowden till simple shear samples
Variation of tangent shear stiffness with logarithm of shear strain for remoulded London clay (brown) simple shear samples
Variation of tangent shear stiffness with logarithm of shear strain for undisturbed London clay (brown) simple shear samples
Variation of tangent shear stiffness with logarithm of shear strain for remoulded London clay (blue) simple shear samples
Variation of tangent shear stiffness with logarithm of shear strain for undisturbed London clay (blue) simple shear samples
7.78 Variation of tangent shear stiffness with logarithm of shear strain for 100 mm undisturbed London clay (blue) triaxial samples
7.79 Comparison of tangent shear stiffnesses from constant and constant volume simple shear tests on Cowden till
7.80 Comparison of tangent shear stifmnesses from constant o ' and constant volume simple shear tests on London clay (brown1
7.81 Comparison of tangent shear stiffnesses from constant cry' and constant volume simple shear tests on London clay (blue)
7.82 Comparison of tangent shear moduli from constant volume simple shear and undrained triexial tests on London clay (blue)
7.83 Variation of shear stress with logarithm of shear strain for probing test on 100 mm unisturbed London clay (brown) triexial sample TUB1
7.84 Variation of shear stress with logarithm of shear strain for probing test on 100 mm undisturbed London clay (blue) triaxial sample TUL5
7.85 Tangent stiffnesses from probing test on 100 mm undisturbed London clay (brown) triaxiel sample TtJB1
7.86 Tangent stiffnesses from probing test on 100 mm undisturbed London clay (blue) triaxial sample TUL5
7.87 Comparison of measured and predicted shear strains for probing test TUB1
7.88 Comparison of measured and predicted volumetric strains for probing test TUB1
7.89 Comparison of measured and predicted shear strains for probing test TUL5
7.90 Comparison of' measured and predicted volumetric strains for probing test TUL5
7.91 Variation of normalised tangent shear stiffness with logarithm of shear strain for remoulded Cowderi till simple shear samples
7.92 Variation of' norrnalised tangent shear stiffness with logarithm of' shear strain for reconstituted Cowden till simple shear samples
7.93 Variation of normalised tangent shear stiffness with logarithm of shear strain for undisturbed Cowden till simple shear
samples
7.94 Variation of normalised tangent shear stiffness with logarithm of shear strain for remoulded London clay (brown) simple shear samples
7.96 Variation of normalised tangent shear stiffness with logarithm of shear strain for remoulded London clay (blue) simple shear samples
7.97 Variation of normalised tangent shear stiffness with logarithm of shear strain for undisturbed London clay (blue) simple shear samples
7.98 Variation of normalised tangent shear stiffness with logarithm of shear strain for 38 mm reconstituted London clay (blue) triaxial samples
7.99 Variation of normalised tangent shear stiffness with logarithm of shear strain for 100 mm undisturbed London clay (blue)
triaxial samples
7.100 Comparison of normalised tangent shear stiffnesses from
constant o' and constant volume simple shear tests on Cowden till
7.101 Comparison of normalised tangent shear stiffnesses from
constant a ' and constant volume simple shear tests on London clay (brownY
7.102 Comparison of normalised tangent shear stiffnesses from
constant and constant volume simple shear tests on London clay (blue)
7.103 Variation of normalised tangent shear stiffness with
overconsolidation ratio for 38 mm reconstituted London clay (blue) triaxial samples
7.104 Comparison of normalised tangent shear moduli from constant volume simple shear and undrained triaxial tests on London clay
(blue)
7.105 Comparison of normalised tangent shear stiffnesses from probing tests TUB1 and TtJL5
7.106 Comparison of normalised tangent bulk stiffnesses from probing tests TUB1 and TUL5
C.1 Reinforced membrane approximated as thin ring
0.1 Effect of pins on shear straining
0.2 Effect of pins on a typical shear stress versus shear strain curve
E.1 Determination of oc for simple shear tests on normally consolidated samples
E.3 Changes in with time approximated as a series of step increments for test U69
E.4 Determination of t 1 from one-dimensional consolidation data by I(time) curve fitting method
E.5 Determination of for each increment of in test UB9
E.6 Variation of average degree of consolidation with J(time) during consolidation after shearing suddenly stopped
E.7 Changes in with time approximated as a series of step increments for test MC9
E.8 Determination of t 1 from one-dimensional consolidaton data by I(time) curve fitting method
E.9 Determination of for each increment of in test NC9
E.1O Comparison of results obtained from two samples with same pre • -shearing state sheared at different rates under constant
Acknowledgements
The author is very grateful to his supervisor Professor John Atkinson
for his guidance and provision of the facilities for this research.
Thanks are also due to Dr. Phil Lewin for supervision of experimental
work. Members of staff and fellow students of the research centre have
contributed by giving their advice and practical assistance. The
technicians, Mr. Keith Osborne and his crew, were always ready and
willing to deal with any equipment problem.
The project was sponsored by the Building Research Establishment
through Mr. John Powell who has been most helpful and supplied the
Declaration
I grant powers of discretion to the University Librarian to allow this
thesis to be copied in whole or in part without further reference to
me. This permission covers only single copies made for study purposes,
Abstract
The main objective of this work is to study the applications of
critical state soil mechanics to simple shear testing. The problems
with the simple shear apparatus and the approach for interpreting
simple shear test results are described. Laboratory tests were
conducted using the NGI simple shear apparatus, standard shear box arid.
computer controlled stress path testing equipment for samples with
38 mm and 100 mm diameter. The test programme comprised simple shear
and shear box tests on remouled, reconstituted and undisturbed
samples of Cowden till and London clay, undrained triaxial tests on
reconstituted arid undisturbed London clay and stress probing tests on
undisturbed London clay. Simple shear samples were tested under either
constant effective vertical stress or constant volume condition.
Basic results for one-dimensional compression arid for shearing
obtained from 72 simple shear tests , 27 shear box tests and 16 stress
path tests are presented.
Analyses of the simple shear test results indicate that the critical
state friction angle for horizontal planes cs' is dependent on
whether the sample was sheared under constant Ov' or constant volume condition and on the pre-shearing value of K 0 which is a function of
overconsolidation ratio. A theory for the critical states of simple
shear tests which takes into account the influence of K 0 is proposed.
The normalised test data show that the overall patterns of the simple
shear and triaxial tests are as predicted by the critical state model.
Tangent stiffnesses instead of secant stiffnesses were calculated
For simple shear tests, the shear stifTnesses obtained from constant
\' shearing are the same as those obtained from constant volume
shearing. For London clay, the norm alised shear moduli for undrained
triaxial tests have the same order of magnitude as those for constant
volume simple shear tests. Results of probing tests show that
undisturbed London clay is linear anisotropic elastic. The elastic
parameters for the constitutive equations can be measured from special
A 5 to A A E E G3 H K' K'S Kus
List of symbols
Ae to De
F F5 Fa G' G S K0 L LL
parameters in constitutive equations for cross-anisotropic elastic material
parameters in constitutive equations for elasto-plastic material under simple shear
activity
are a
Young's modulus
•1
Young's modulus in terms of effective stresses
Young's modulus for undrained (constant volume) loading in terms of total stress
flow parameter
flow parameter for simple shear
axial force
elastic shear modulus
elastic shear modulus for undrained loading in terms of total stress
elastic shear modulus for simple shear
elastic shear modulus for constant volume loading in terms of total stress for simple shear
hardening parameters for simple shear
specific gravity of soil grains
maximum drainage path
elastic bulk modulus
elastic one-dimensional bulk modulus for simple shear
elastic one-dimensional bulk modulus for constant volume loading in terms of total stress for simple shear
coefficient of earth pressure at rest
length
b
C,
Cu
cv
d
dh,dv
e
g,h
h
k
k
n
LI liquidity index
normal load on horizontal planes of simple shear sample
OCR overconsolidation ratio in terms of
PL plastic limit
F' plasticity index
overconsolidation ratio in terms of p'
sv shear load on horizontal planes of simple shear sample
T time factor
'it average degree of corfolidation
V volume
vw volume of water
w work done
10 2'3' '-cr3t)
cohesion
undrained shear strength
coefficient of consolidation
diameter
horizontal displacement, vertical displacement
voids ratio
soil constants defining the Hvorslev surface
soil constants defining the Hvorslev surface for simple shear
height
coefficient of permeability
soil constant in the empirical relationship k tan8 for simple shear
coefficient of volume compressibility
pt Pcsl pe, p0t ppt peak' p q' q0' peak' q' q r t ti t U U0 U V vcs V0 VP Vpeak v/co (1/3)(o1 '2'°3'
value of p' at critical state
equivalent stress - value of p' on the normal compression line at the same specific volume
pre-shearing value of p'
maximum previous stress - value of p' at the intersecting point of the normal compression line and the swelling line of an overconsolidated sample
value of p' at peak q'/p' state
(1/3)(01+02+03)
value of q' at critical state
pre-shearing value of q'
value of q' at peak q'/p t state
yield stress
)2J
radius
time
time for calculation of c in I(time) curve fitting method
thickness
pore pressure
steady-state pore pressure
excess pore pressure
specific volume
value of v at critical state
pre-shearing value of v
value of v at peak state for simple shear and shear box
value of v at peak qt/pt state
VI&ZS,V b specific volume of one-dimensionally overconsolidated soil
swelled to
o,'1.O
kPa for simple shear and shear boxv specific volume on reference section with p'1.O kPa
specific volume on reference section with o'=1.O kPa for simple shear
w water content
x,y,z reference axes (y for vertical)
r
specific volume on rference section with p'l.O kPa at critical statespecific volume on reference section with o1.O kPa at critical state for simple shear
large increment of
M slope of critical state line on p',q' plane
M c value of H for triaxial compression test
Me value of M for triaxial extension test
N specific volume of isotropically normally compressed soil at p'1.O kPa
N 0 specific volume of one-dimensionally normally compressed soil at p'l.O kPa
specific volume of one-dimensionally normally compressed soil at o-,'1•O kPa for simple shear and shear box
E sumof
45°^(Ø'/2), angle defining planes with maximum '/a'
pore pressure parameter for simple shear
45°+( '/2), angle defining directions of zero strain increment
engineer's shear strain; shear strain parameter for simple shear and shear box
unit weight
En,In
6
Ea6r
strains for planes parallel with the directions of zero strain increment
small increment of
strain
axial strain, radial strain
(J/3)[(61_E2)2+(E_63)2+(E_E )2 ]
volumetric strain parameter for simple shear and shear box
E1 ,E2 , 3 principal strains (subscripts 1,2,3 denote major, intermediate and minor respectively)
'2' q'/p'
9 angle of rotation of directions of principal stresses
S angle of rotation of directions of principal strain increments
slope of swelling line on v,ln p' plane
slope of swelling line on v,ln o' plane for simple shear and shear box
A slope of normal compression line on v,ln p' plane
slope of normal compression line on v,ln plane for simple shear and shear box
K'/3G'
factor for calculating rate of dissipation of excess pore pressure in Equation (E.3)
Poisson's ratio
Vu 0.5, Poisson's ratio for constant volume (undrained) loading in terms of total stresses
angle of shearing resistance on horizontal planes
PC5' angle of shearing resistance on horizontal planes at critical state
P settlement
a, effective normal stress
(' V I)cs
VP
(I-),
cJ cs
a- total normal stress
effective axial stress, effective radial stress
a
-h' effective normal stress on vertical planes
effective octahedra]. normal stress
effective normal stress parameter for simple shear and shear box
value of o' at critical state for simple shear and shear box
value of Ov' at peak ¶v'/crv' state for simple shear and shear box
0ve equivalent stress - value of 0v' on the normal compression line at the same specific volume for simple shear
pre-shearing value of'
maximum previous stress - value of at the intersecting point of the normal compression line and the swelling line of' an overconsolidated sample for simple shear and shear box
effective principal stresses (subscripts 1,2,3 denote major, intermediate and minor respectively)
V effective shear stress
t total shear stress
effective shear stress parameter for simple shear and shear box
oct
0'
øcs,
0'
p
value of 't,' at critical state for simple shear and shear box
Value of ' at peak ','Ia-,' state for simple shear and shear box
effective octahedral shear stress
maximum angle of shearing resistance
maximum angle of shearing resistance at critical state
maximum angle of shearing resistance at peak shear stress
angle of dilation
angle of shearing resistance on vertical planes
Superscripts
effective stress e.g. c'
e elastic
p plastic
Subscripts
a axial
b shear box
cs critical state
e equivalent stress - stress on the normal compression line at the same specific volume e.g. crve'
h horizontal
o ordinary strain
Oct octahedral
ps plane strain
-r radial
s simple shear
u undrained; constant volume
v vertical
x,y,z reference axes (y for vertical)
CHAPTER 1 INTRODUCTION
Over the last twenty years critical state soil mechanics have
been developed into a simple and powerful model for understanding
the mechanical behaviour of soils. The strength of the model
lies in its unification of the fundamental concepts of
consolidation, compression, yielding and failure of soils for both
undrained and drained loading. Most of the ideas in the critical
state theory originated from and are supported by laboratory test
results obtained from the triaxi%al apparatus. There are, however,
various loading conditions in the field which are not simulated by
the triaxial test. One of these conditions is simple shear loading
characterized by shearing associated with the rotation of principal
stress directions under plane strain conditions. Such a loading
condition occurs, for example, in slope stability problems, adjacent
to friction piles or beneath foundations of off-shore platforms.
Although the simple shear test existed even before the development
of the critical state theory, there have been very few studies
which relate simple shear testing to the critical state model. The
main objective of this project is to examine the applications of
the critical state theory to simple shear tests on saturated
clays. A secondary objective is to compare soil behaviour in
triaxial tests and simple shear tests.
The layout of this thesis follows the usual conventions observed
by most dissertations based on experimental work. Chapter 2
outlines the basic concepts of the critical state model to
provide a framework for the analyses of data obtained from
laboratory tests. The current knowledge on simple shear testing
and on the two clays, Cowden till and London clay are described
in Chapter 3. Chapter 4 gives the engineering geology
background of the two clays which is useful for understanding the
behaviour of undisturbed samples. The equipment used and the
testing procedures followed are described in Chapter 5 and the
raw test data are presented in Chapter 6. Chapter 7 brings
together the previous chapters to develop new understanding of
mechanics through analyses and discussions. Chapter 8 sums up
the conclusions drawn in Chapter 7 and recommends possible future
CHAPTER 2 BASIC THEORY
2.1 Introduction
The purpose of this chapter is to form a basis for the theory which
will be used to analyse the test data presented in
Chapter 6. In the beginning of the chapter, the preliminaries
section defines the parameters to be used and the conventions to be
adopted. Then, the approach or analysing the states of stress
and strain in simple shear samples will be outlined and the basic
concepts of elasticity and plasticity will be described in terms of
idealised stress-strain behaviour. The critical state model will
provide the overall framework for analyses and discussions in
Chapter 7. Finally, procedures for normalising test data which
enable experimental results to be compared with theoretical
predictions will be given.
2.2 Preliminaries
2.2.1 Stresses and strains in soils
In the analysis of stress and strain in soils, the soil mass is
approximated to a continuum so that all infinitesimal elements
have the same properties as the mass. The normal and shear stresses
acting on a small two-dimensional element OABC are shown in
Figure 2.1(a) and the associated normal and shear strains are
shown in Figure 2.1(b). The same orientation of the orthogonal
reference axes x , y and z as defined in Figure 2.1 will be
used throughout this study. Compressive normal stresses and
strains are defined as positive and shear stresses and shear
strains associated with increases in the angles in the
positive quadrants of the element are defined as positive.
Therefore, all the stresses and strains shown in Figure 2.1
2.2.2 The principle of effective stress
The principle of effective stress was first stated by Terzaghi (1936).
Based on results from numerous experiments on various saturated
materials including sand and clay over a wide range of total normal
stresses o and pore pressures u, Terzaghi concluded that all the
measurable effects of a change of stress, such as deformation and a
change of shearing resistance, are exclusively due to changes of
effective stresses a' where
cr' a - u (2.1)
For engineering purposes, zero value of the stresses a and u is
atmospheric pressure.
2.2.3 Pure shear strain and engineer's shear strain
Figure 2.2(a) shows the strained element O'A'B'C' with shear strains
E xy and B rotating the element counter-clockwise about 0'
through an angle E,, Figure 2.2(b) is obtained. This shows that
+ (2.2)
but
6xy Eyx (2.3)
therefore, 2E (2.4)
Similarly,
'ixy 2Ey (2.5)
and 6yx are pure shear strains and and are engineer's
shear strains. The engineer t s shear strain consists of a component
of pure shear strain together with a numerically equal component of
body rotation. It gives a measure of the change of angle between
two initially orthogonal fibres embedded in the x,y plane.
2.2.4 Mohr's circles of stress and strain
to the states of stress and strain in Figure 2.1 are shown in
Figure 2.3. For
plotting Mohr's circles, counter-clockwise shearstresses
and shear strains are defined as positive. Hence, thecounter-clockwise shear stress and shear strain in
Figure 2.1 are positive in Figure 2.3 and the clockwise shear stress
and shear strain are negative. Stresses and strains
associated with the element at different orientations with respect to
the x,y axes can be obtained from the pole of planes P.
2.2.5 Definition of stress parameters
For triaxial tests, the stress parameters used are stress invariants
which are independent of the orientation of the reference axes and are
measures of the three-dimensional stress states of the samples. The
invariants for effective normal and shear stresses are p' and q'
respectively. In terms of effective axial stress
0
a' and effectiveradial stress crr' which are principal stresses, p' and q' are defined
as
pt (1/3)(a' + 2r
(2.6)
q'
0a' -
(2.7)
For general states of stress, where
0
2' may not be equal to cr3t,p' and
qt
are defined aspt (2.8)
(1/I)[(oi '2' )
2
+( 2 ' 3t)2^(yty t)2] (2.9)For simple shear tests and shear box tests, the stress parameters are
not invariants. They are the average stresses determined from the
normal load N and shear load S, acting on the horizontal
boundaries of the sample. The forces Nv,Sv acting on a simple shear
sample are shown in Figure 2.4. The total normal stress and shear
stress parameters are defined as
=
Nv /A
and
= Sw/A (2.10)the current horizontal cross-sectional area is used in calculating
both normal stress and shear stress. The corresponding effective
stress parameters are
- u and (2.11)
where u is the pore pressure in the sample.
2.2.6 Definition of strain parameters
For triaxial tests, the strain parameters used are strain invariants
which are independent of the orientation of the reference axes and are
measures of the three-dimensional states of strain of the samples.
The invariants for volumetric strain and shear strain are and
respectively. In terms of axial strain
5a and radial strain Er Which are principal strains, and are defined as
+ 26 r) (2.12)
- 5r (2.13)
For general states of strain, where
2 may not be equal to 5 3 , they
are defined as
-Ev C51+2+E3) (2.14)
6 5 (JI3)[(El_E2)2+(e2_53)2+(63_6l)2] (2.15)
For simple shear tests and shear box tests, the strain parameters are
not invariants. They are strains determined from increments of
vertical displacement Sy and increments of horizontal displacement
Lx measured at the boundaries of the sample. The volumetric strain
and shear strain parameters are defined as
6v
E(-
y / h)
and = (-6x/h) (2.16)2.2.7 Correspondence between parameters for stress and strain
Stress and strain parameters are correctly chosen if the sum of the
products of corresponding parameters of stress and of strain gives
the work done by external loads and pressures. The work done by
external loads and pressures is an invariant but the corresponding
stress and strain parameters are not necessarily invariants.
For triaxial tests, the correspondence between the stress parameters
p', q' and the strain parameters Ev E have already been
demonstrated by Atkinson and Bransby (1978).
For simple shear tests, the correspondence between the stress
parameters and the strain parameters , ' can be
demonstrated in a similar manner. The work done by external loads and
pressures is first calculated by considering the sample under simple
shear shown in Figure 2.4. During a small time interval, the
vertical force and shear force Sv acting on the horizontal
boundaries of the sample caused the deformations -x and -by.
Assuming the pore pressure has a constant value u and the volume of
water expelled is , the work done W by the external loads
and pressures is
(2.17)
= S(-x) + N(-y) - U V
[-q ence, the work done per unit volume is
-. . (_\ + I- /
—)+
y\ U-V A hi A h/ V
where V is the change in volume of the sample. Therefore,
sw/V = _v
' + - uv
+ C; - u)&
Using Equation (2.11),
sw/V = + vv
(2.18)
(2.19)
parameters is
SW/V 'V,,'' + (2.20)
Since Equations (2.19) and (2.20) lead to identical expressions for
SW/V, the strain parameters '',E., are correctly associated with the
stress parameters 1',o,' for simple shear tests.
2.2.8 Relationships between ordinary strains and natural strains
The importance of using natural trains in the analysis of soil test
data has been considered by Richardson (1984a). To distinguish
between ordinary strains and natural strains a subscript 'o' is added
to ordinary strain parameters.
For normal strains the relationship between ordinary strains and
natural strains is
E .-ln(1 - 6) (2.21)
Equation (2.21) allows natural strain parameters
13 to be
calculated from ordinary strain parameters
1'3• The triaxial natural strain parameters are then calculated from 61,63
using Equations (2.12) and (2.13).
For simple shear tests, the relationship between ordinary and natural
volumetric strain is derived as
= -by/h (2.22)
since y = h, the accumulated strain is
h 1
Jo 1h0 h
where h0 is the reference height at the start of the test. Therefore,
= -ln(h/h 0 ) (2.23)
but, 6vo = -(h-h0)/h
giving h0/h (2.25)
so, -ln(l-6) (2.26)
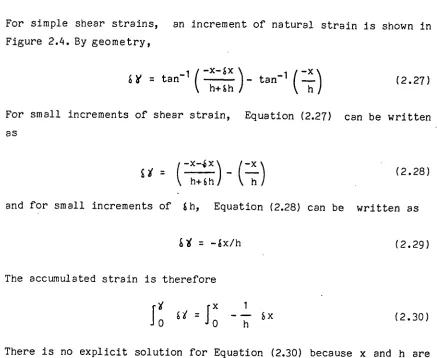
[image:41.595.75.512.91.449.2]For simple shear strains, an increment of natural strain is shown in
Figure 2.4. By geometry,
I-x-x\ -x
tan1 ( h+h ) tan1 () (2.27)
For small increments of shear strain, Equation (2.27) can be written
as
(
X-X\
I-x
+) -
(2.28)and for small increments of Sh, Equation (2.28) can be written as
-ax/h (2.29)
The accumulated strain is therefore
X 1
I--Jo O h (2.30)
There is no explicit solution for Equation (2.30) because x and h are
independent variables. Values of Y can only be calculated numerically
by summing up individual values of £.
2.3 Analysis of stresses and strains in simple shear tests
2.3.1 Analysis of' stresses
In an ideal simple shear test, effective stresses as shown in
Figure 2.5 are uniformly imposed on the sample. The Mohr's circle of
stress corresponding to the state of stress in Figure 2.5 is shown in
Figure 2.6. The major principal effective stress o' and minor
principal effective stress
O 3 rotate through an angle 9 during
shearing. The intermediate principal effective stress
2'
coincideswith crz' because shear stresses and
t''
acting on the x,yplane are both zero. The pole of planes is at P and the principal
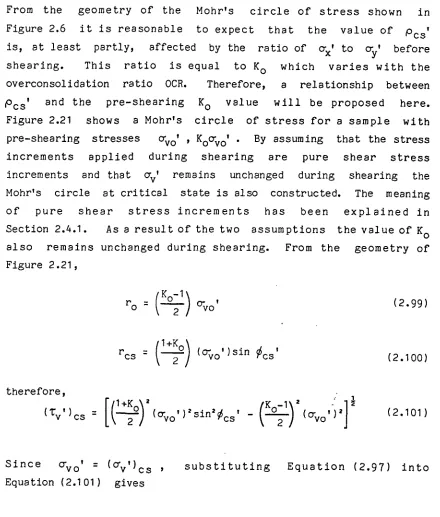
From the geometry of Figure 2.6 the maximum angle of shearing
resistance mobilised in the soil mass 0' is defined as
-1 0'l
-ç6'sin
I
+ (2.31)The angle of shearing resistance mobilised on the horizontal plane is
defined as
tan ( (2.32)
\o-' /
and the angle of shearing resistance mobilised on the vertical plane
is defined as
It I\
tan I xy \ (2.33)
The angles çb', p' and c' vary during shearing and at critical state,
the theory of which will be outlined later, they become 0cs" Pcs' and
The angle
0cs' is assumed to be a soil constant.
For tests in the NGI simple shear apparatus, assuming the stresses in
the sample are uniform, the stresses measured are the
stresses
y"yx' The angle p' can be obtained from Using
Equation (2.32). However, without also knowing ore, the Mohrts
circle of stress cannot be drawn and the stress state of the sample
cannot be determined. Furthermore, the angle and the soil constant
0cs' cannot be calculated from the stresses alone. Methods
of estimating the stress state, and hence, 0' will be discussed in Section 3.3.2.
The relationships among the parameters 0', p' and e can be obtained from the geometry of Figure 2.6. For the case of O yt > before
shearing,
1 1
= sin 1 sin(2e)
(2e)j
(2.34)
Ltan p'
-p' = tan
1 sin(29) -1
sin 0' + cos(2e)j
ii
1 sin P')+p'j
for 29 900
+Ø' (2.36a)8 [Sin
(sin
ii
1 sinp'\i
9 900 - _isin_I
sin
p
'
)-
Pj
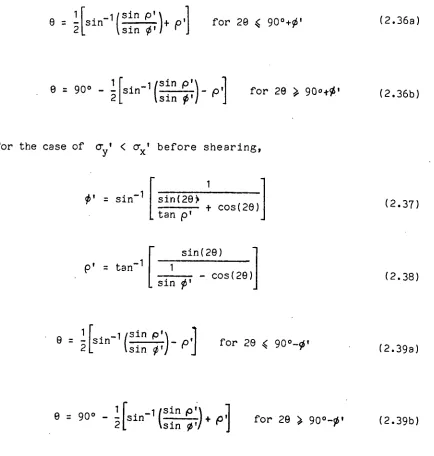
for 28 90o+.t (2.36b)For the case of < before shearing,
r
sin
1
I
sin(29]
(2.37) [ tan p'
sin(28)
p' tan
1
[1
-
(29)]
(2.38)sin '
/sin
p'\1
[
sin_1
tsin
p'] for 28 90°-p'(2.39a)
if
-1sin
P')+ p']for 29
9
90° - -Isin (
sin
Ø
Similar equations which apply to critical state can be written by
substituting the parameters ', p', 6 by the critical state
parameters cs''Pcs''8cs• Equations (2.36a) and (2.36b) show that
knowing
p'
and 0' there are two possible values of 9. This is because
each point is associated with two possible Mohr's circles,
one with 29 < 90°^Ø' and the other with 29 > 90 0 +0 g . For the special
case when (Oy'yx') lies on the
0'
envelope, there is only one
possible Mohr's circle and both Equations (2.36a) and (2.36b) become
[image:43.595.81.515.57.513.2]9 (90°+p').
Figure 2.7 shows that two planes are subjected to a maximum stress
ratio of tan 6'. The directions of these two planes are defined by the
oc 450 + . 01 (2.40)
2.3.2 Anaylsis of' strains
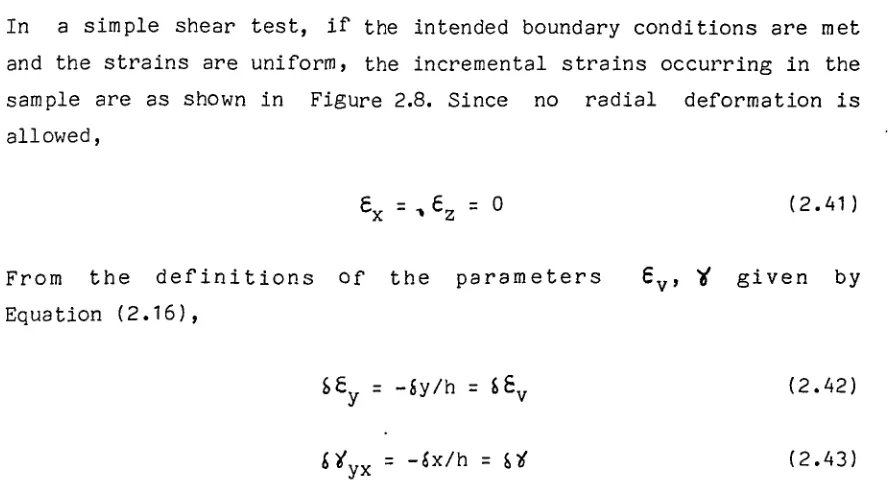
In a simple shear test, if the intended boundary conditions are met
and the strains are uniform, the incremental strains occurring in the
sample are as shown in Figure 2.8. Since no radial deformation is
allowed,
0 (2.41)
From the definitions of the parameters Y given by
Equation (2.16),
-Sy/h (2.42)
-ax/h (2.43)
Equation (2.43) shows that a simple shear strain increment is an
engineer's shear strain increment. Mohr's circles of strain
increment for a compressing sample and for a dilating sample are shown
in Figures 2.9(a) and (b) respectively. The major principal strain
increment and minor principal strain increment 66 3 rotate
through an angle 9 during shearing. The intermediate principal strain
increment 2 coincides with 6 E because shear strains and 'zy
are both zero and from Equation (2.41),
6E2 0 (2.44)
Equation (2.44) indicates that the sample deforms under plane strain
condition. The pole of planes is at P and the principal planes for
[image:44.595.69.513.151.400.2]SE1 and 653 are rotated through the angle 8. From the geometry of
Figure 2.9,
+ +
1 = 2 (2.45a)
- /[()2 + (l)2)
E 3 =
Is
_tan) (2.48)
Combining Equations (2.15), (2.44), (2.45a) and (2.45b),
3
[se V + - ()2 (2.46)
4 J
The angle of dilation W which represents the relative magnitudes of
normal and shear strains is defined as
+ -sin I
- e3)
(2.47)
and, in terms of' the simple shear strain parameters,
The angle W is positive for negative (dilational) volumetric strain
and negative for positive (compressive) volumetric strain. Hence, from
the geometry of Figure 2.9,
2e - 90 0 (2.49)
In each of Figures 2.9(a) and (b), there are two planes represented
by broken lines for which increments of normal strain are zero and the
directions of zero strain increment (also called zero extension lines)
are normal to:these planes. One of these planes is vertical and the
other, from the geometry of Figure 2.9 is inclined at an angle of 5"
to the horizontal.
Figure 2.10 shows the directions of zero strain increment
corresponding to the planes represented by the broken lines in
Figure 2.9(a). One of these directions is horizontal and the other,
from the geometry of Figure 2.9(a), is inclined at an angle of 5" to
the vertical. The directions of zero strain increment can also be
defined by the angle 1e which, from the geometry of Figure 2.10, is
given by
(2.50)
The increments of shear and normal strains for planes parallel with
the directions of' zero strain increment are marked as From
the geometry of Figure 2.10, g6 and the tangents to
the £6 axis.
For the case of constant volume shearing, for which no volume change
is allowed to take place during shearing, Equation (2.48) shows that
' is zero. According to Equation (2.49), 9 becomes a constant value
of 45° so that there is no rotation of and £
3
during constantvolume shearing and the Mohr's circle of strain increment Is as shown
in Figure 2.11. Equation (2.50) shows that for !^' 0, the directions
of zero strain increment are the horizontal and vertical directions.
This is so because during constant volume shearing the sample is not
allowed to deform in the horizontal and vertical directions.
2.4 Elasticity and plasticity for soils
2.4.1 Purely elastic stress-strain behaviour
When a purely elastic material Is loaded, the energy transferred from
external forces to the material is fully recoverable when the material
is unloaded. Elastic strain increments are related to increments of
stress and the stress-strain behaviour of an ideal isotropic elastic
material is given by the generalised form of Hooke's law as
6E
(1/E')Uot_
V'Scr'- V'o
') (2.51a)(1IE')Ucr'_ V'
o
'- V'S0') (2.51b)(1IEt )(
S
crt_. V'kTt_ V'o')
2.51c)c,e
(2/E')(l
+
V')
ST ' (2.51d)° xy xy
(2.51e)
(21E')(l + V' ) °
(2/E')(l + V' ) aT ' (2.511)
where E' and i," are the Young's modulus and Poisson's ratio for
changes of effective stress. If the material is linear elastic E'
and /'
are constants.
(2.55)
stresses and strains, Equations (2.51) become
6E (lIE')(6a1'-V'o2'_y'&cr3')
(1/E')(8c72L.VIk,.3I_Vt-1t) (2.52)
(1/E')(Scr3'-
"'8a•i'-
V'cr2')
For triaxial tests, with
803'and
2
E
3
,
Equations (2.52)
give
ee
2(1^V') -15 3E' 3G'
3(1-2V')
1
=
-E'
K'
(2.53)
(2.54)
where G' is the shear modulus, K' is the bulk modu1us, and they are
related to E' and 'y" by
E'/[2(1+ V')] and K' = E'/[3(1-2V')]
For simple shear tests, Equation (2.51d) gives
2
1- (1i-I')
r '
i--
'
E'
5(2.56)
where G 3 ' is the shear modulus and
it is related to E' andby
G
5 '
E'/[2(1+V')](2.57)
The subscript 's' of G 5 ' indicates that the parameter G 5 ' is
appropriate for simple shear tests, and from no.w
onsubscripts 's'
will be added to all simple shear parameters. Although the stress and
strain parameters for triaxial and simple shear tests are different,
Equations (2.55) and (2.57) show that the shear moduli for the two
types of tests are the same.
0
0
hence, [
y'/(l-V')]
(2.58)Substituting Equation (2.58) into Equation (2.51b),
1 1 (1+V')(1-2V')
£0-' (2.59)
V E' (i-y')
and the modulus K5 ' is related to E' and '/' by
K ' - [(1- '/')E'] / [(1+ 5 - V') (1-2 V' )1 (2.60)
From Equations (2.54) and (2.59), it can be seen that both the bulk
modulus K' and the modulus K 5 ' relate an effective normal stress
increment to an elastic volumetric strain increment. On the other
hand, K' is appropriate for three-dimensional stress and strain
increments whileas K 5 ' is only appropriate for one-dimensional stress
and strain increments. Therefore, K 5' is referred to as an
one-dimensional bulk modulus.
Equations (2.53) and (2.56) demonstrate that increments of elastic
shear strains are dependent only on the corresponding increments of
shear stresses and Equations (2.54) and (2.59) demonstrate that
increments of elastic volumetric strains are dependent only on the
corresponding increments of normal stresses. As a result, the stress
and strain increments of an isotropic elastic material are said to be
decoupled.
Using Equations (2.51a) to (2.51c), it can be shown that for both
constant volume and constant
°Y
simple shear tests on isotropic elastic material, &cr ' = Scry ' = 0. Hence, the Mohr's circle of stressincrement is as shown in Figure 2.12. Such stress increments, with
£cr'= -cT3', are known as pure shear stress increments. The effect of
superposing pure shear increments on any initial stress state is that
the Mohr's circle of stress will change in size but the centre of the
Mohr's circle remains unchanged. From the geometry of Figure 2.12,
cr1 ' is inclined to the vertical at an angle of 45°. If cr 1 ' is