City, University of London Institutional Repository
Citation: Dewar, J.D. (1997). Development of a theory of particle mixtures and its
application to aggregates, mortars and concretes. (Unpublished Doctoral thesis, City University London)This is the accepted version of the paper.
This version of the publication may differ from the final published
version.
Permanent repository link: http://openaccess.city.ac.uk/7574/
Link to published version:
Copyright and reuse: City Research Online aims to make research
outputs of City, University of London available to a wider audience.
Copyright and Moral Rights remain with the author(s) and/or copyright
holders. URLs from City Research Online may be freely distributed and
linked to.
Development of a
Theory of Particle Mixtures
and its application to
aggregates, mortars and concretes
Author
Joseph Duncan Dewar
Qualification
PhD
submission
Institution
City University
Department
School of Engineering
Department of Civil Engineering
10
11
12
13
15
16 20 22 23 23 24 29 29 30 31 31 31 33 37 38 38CONTENTS
ACKNOWLEDGEMENTS DECLARATION ABSTRACT NOTATION1. INTRODUCTION
1.1 Modelling principles and techniques 1.2 The investigation
2. THE PRINCIPAL PROPERTIES AND TEST METHODS
2.1 Mean size
2.1.1 Mean sizes of aggregates
2.1.2 Mean sizes of cements and other powders
2.2 Relative Density
2.2.1 Relative densities of aggregates and fillers 2.2.2 Relative densities of cements and other powders.
2.3 Voids ratio
2.3.1 Influences on voids ratio
2.3.1.1 Influence of moisture environment on compaction. 2.3.1.2 Influence of the energy level of compaction. 2.3.2 Voids ratios of aggregates
2.3.3 Voids ratios of cements and other powders
2.4 Overview
3. THEORY OF PARTICLE MIXTURES
403.1 General theory of particle mixtures developed for mixtures of two single sized
components 40
3.1.1 Modeling of particles and voids 40
3.1.2 Voids ratio diagrams. 45
3.1.2.1 Overview of simple theoiy in relation to voids ratio diagrams 50 3.1.3 Analysis of voids ratio diagrams for real particle mixtures 50 3.1.4 Overview- Summaiy of the key formulae for the construction of voids ratio diagrams and calculations of quantities for mixtures of two components. 59
3.2 illustrations of the main mechanisms and interactions within particle mixtures. 62
3.2.1 Particle interference in dry particle mixtures. 62
3.4 General theory of particle mixtures developed for mixtures of three or more
components 71
3.5 Situations requiring special care or treatment. 72
4. EXTENSION OF THE THEORY OF PARTICLE MIXTURES TO
PASTES, MORTARS AND CONCRETES
74
4.1 Reference slump for mortars and concretes 74
4.2 Pastes- Extension of theory of particle mixtures to cement-water pastes and other
powder-water pastes 74
4.2.1 Extension of theory of particle mixtures to composite cement in water paste and to
cement-addition combination in water paste. 74
4.3 Mortars- Extension of theory of particle mixtures to cement-sand mortars 77 4.4 Concretes- Extension of theory of particle mixtures to concrete 78
4.4.1 Illustration of the process of applying the theory and models to concrete made with 3
materials. 83
4.4.2 Extension to multi-component concretes 89
4.4.3 Extension from the reference slump to other slumps 89
5. ALLOWANCE FOR ADMIXTURES, AIR AND OTHER FACTORS ON
WATER DEMAND AND STRENGTH OF CONCRETE
92
5.1 Influence of admixtures on the water demand of concrete 92 5.1.1 Overview of allowance for the effects of admixtures on water demand 95
5.2 Air content 96
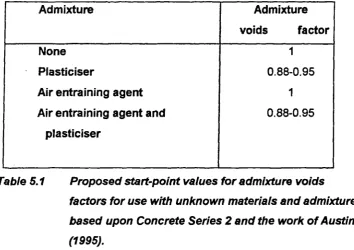
5.2.1 Start-point values for effects of plasticisers and air entraining agents on water
demand. 100
5.3 Time and temperature effects 100
5.4 Strength 103
5.4.1 Relations between strength and w/c at 28 days 103
5.4.2 Effects of cement strength on relations between concrete strength and w/c 108 5.4.3 Effect of aggregates on relations between strength and w/c 110 5.4.3.1 Influence of maximum size of aggregate on strength v w/c relations. 112 5.4.3.2 Influence of workability and aggregate content on strength v w/c relations. 113 5.4.4 Relations between strength and w/c at other ages than 28 days 113 5.4.5 Relations between strength and cement content 120
5.4.6 Influence of air on strength 122
5.4.7 Composite effects of plasticiser and air entrainer on the relation between strength and
cement content of concrete at constant slump 126
5.4.8 Effects of additions on strength 127
5.4.9 Overview of modelling for strength 129
5.5 Examples of Computerized Input and Output Screens for Concretes modelled using
the Theory of Particle Mixtures. 130
6.1 Aggregate mixture trials 133
6.1.1 Method 133
6.1.1.1 Observations 136
6.1.1.2 Results of the main Series of tests 136
6.1.1.3 Overview of results from aggregate mixture trials. 142
6.2 Mortar trials 143
6.2.1.1 Overview of results from mortar trials 145
6.3 Concrete trials 146
6.3.1 Concrete Series 1-covering a range of cement and aggregate sources 146 6.3.1.1 Overview of the resuLts from Concrete Series 1. 159
6.3.2 Concrete Series 2-including adnüxtures and air entrainment 161 6.3.2.1 Over view of the results from Concrete Series 2 for concrete with admixtures and
air entrainment. 175
6.3.3 Concrete Series 3- including additions 176
6.3.3.1 Concretes with fly ash 176
6.3.3.2 Concretes with ground granulated blastfurnace slag 179 6.3.3.3 Overview of the results from Concrete Series 3 for concrete with additions 181
7. PROPORTIONS AND PROPERTIES OF CONCRETE PREDICTED BY
THE USE OF THE THEORY OF PARTICLE MIXTURES
182
7.1 Fine/total aggregate percentage (Per-cent fines) 182
7.2 Water demand 184
7.2.1 Influence of cement properties on concrete water demand 184 7.2.1.1 Combined theoretical effects of mean size and void ratio of cement on the water
demand of concrete. 185
7.2.2 Influence of coarse aggregate on concrete water demand 186 7.2.2.1 Combined theoretical effects of mean size and void ratio of coarse aggregate on
the water demand of concrete. 187
7.2.3 Influence of fine aggregate properties on concrete water demand 189 7.2.3.1 Combined theoretical effects of mean size and void ratio of fine aggregate on the
water demand of concrete. 191
7.2.4 Influence of percent fines on the water demand of concrete 192 7.2.5 Influence on concrete water demand of the selected value of cohesion factor 193 7.2.6 Influence of fillers or aggregates of intennediate size between cements and fine
aggregates. 194
7.3 Overview 195
8. CASE STUDIES
196
8.1 A mineral addition for concrete 196
8.2 Investigation of fine aggregate performance 198
8.3 Design of concrete incorporating heavy weight aggregates. 200 8.4 The concept of an ideal grading curve for aggregates or for concrete 201 8.4.1 Continuous gradings v gap gradings for aggregates for concrete. 206 8.4.2 Design of concrete to match the materials
9. CONCLUSIONS
212
9.1 Recommendations for future work 213
9.1.1 General 213
9.1.2 Particular 214
APPENDICES
A Effects of compaction methods on voids ratio
216
Al General considerations 216
A2 Effect of compaction energy level on voids ratios 217 A3 Relation between z, the bandwidth factor, and r, the size ratio 220
A3.1 Low energy levels 220
A3.2 High energy levels 223
A3.3 Comparison between low and high energy levels 225 A4 Overview of effects of energy level of compaction 227
B Adjustment of input data
229
C Relations between cement and concrete properties
234
Cl Research of Rendchen on cement and concrete properties 235 Cl. 1 Relations between cement properties and concrete water demand 235
C1.2 Relations between cement strength and concrete strength 243 C2 Research of Bennett, Sumner, Sprung, Krell and others 245
C3 Additional supporting information 247
C4 Analysis of cement and concrete data from C & CA from the 1960s 248 CS Overview in respect of selected cement properties and
their relationship to concrete properties. 251
D Comparison between different models for simulating
aggregate combinations
252
Dl Overview of alternative models 255
TABLES
Table 2.1 Properties and test methods 23
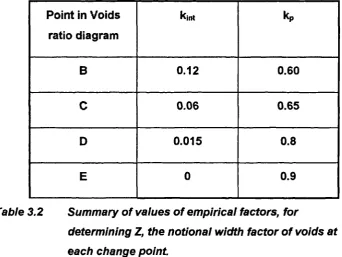
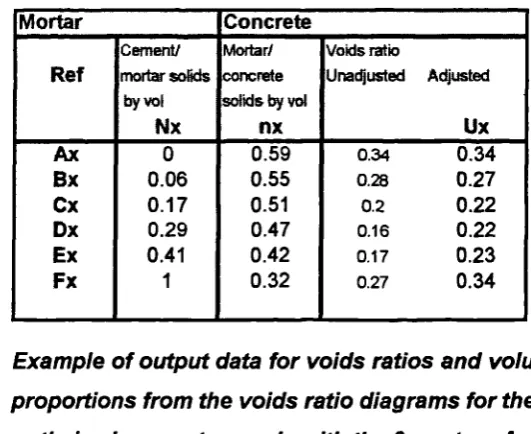
Table 2.2 Data on 22 cements as reported by Rendchen (1985) 27 Table 2.3 Typical values for the main properties of cements and aggregates 39 Table 3.1 Summary of values for spacmg factors, in, for coarse particles 52 Table 3.2 Summary of values of empirical factors, for determining Z 56 Table 3.3 Description of the main features of particle interference 68 Table 4.1 Voids ratio adjustment constants for the concretes at the 6 change points 82 Table 4.2 Mean sizes and voids ratios for Concrete Series 1- F2 84 Table 4.3 Data calculated for the mortar voids ratio diagram 84 Table 4.4 Example of output data from the voids ratio diagrams for concretes 86 Table 4.5 Expansion of output data in Table 4.4 to cover 17 concretes 87 Table 4.6 Final output of 17 simulated concretes (Concrete Series 1, F2) 87 Table 5.1 Proposed start-point values for admixture voids factors 93 Table 5.2 Measured slumps for concretes designed by computer simulation 95
Table 5.3 Values for constants in Eqn 5.1 99
Table 5.4 Proposed start-point values for factors for use with unknown materials 100 Table 5.5 Values of age factor F for data of Ackroyd (1963) 115
Table 5.6 Slope factors in Figure 5.11 117
Table 5.7 Slope factors in Figure 5.12 for Concrete Series 2 (P4R1) 118 Table 5.8 Start- point values for aggregate and age factors 119
Table 6.1 Data 135
Table 6.2 Series JDD1- Experimental data for mixtures of single- sized aggregates. 137 Table 6.3 Series JDD2- Experimental data for mixtures of single- sized aggregates 139
Table 6.4 Series JDD3- Experimental data for mixtures 140
Table 6.5 Series JDD4- Experimental data for mixtures of graded aggregates. 141
Table 6.6 Materials input data for mortar 143
Table 6.32 Computer simulation of combination of fly ash and Portland cement. 176 Table 6.33 Concrete Series 3- water demands for concretes with and without fly ash. 177 Table 6.34 Concrete Series 3- per cent fines for concretes with and without fly ash. 178 Table 6.35 Concrete Series 3- fresh densities for concretes with and without fly ash. 179 Table 6.36 Concrete Series 3- 28 day strengths for concretes with ggb slag. 180
Table 7.1 Assumed properties of coarse aggregates 188
Table 7.2 Properties of BS 882 aggregates 191
Table 7.3 Example of effect of cohesion factor on per cent fines and water demand 194 Table 8.1 Comparison between water contents for standard consistence and 196
Table 8.2 A design for heavy weight concrete 201
Table 8.3 Void ratio of a combination of 11 materials to Popovics (1979) criteria 204 Table 8.4 Modification of Table 8.3 as a result of optimizing the distribution 205 Table 8.5 Results of providing gaps in the distribution 208 Table Al Data for aggregates under high energy compaction by Loedolff (1986). 217 Table A2 Data of de Larrard et al (1987,1994) under high energy compaction 218 Table A3 Constants in the formula for z, assuming no significant segregation 222 Table A4 Constants in the formula for estimating z when segregation occurs 227
Table Bi Situation before applying 'Solver' to adjustment of water demand 231 Table B2 Situation after applying 'Solver' to adjustment of water demand 231 Table B3 Situation after final compromise adjustment to water demand 232 Table B4 Adjustments made to data for cement for determining water demand 232 Table B5 Measured and adjusted materials data for Concrete Series 2. 233 Table Cl Properties of cements investigated by Rendehen (1985) 235 Table C2 Data on cement properties calculated from data of Rendchen (1985) 237 Table C3 Regression for water demand of concrete from cement properties 237 Table C4 Properties of concretes of 0.45 w/c for 22 cements of Rendchen (1985) 240 Table CS Properties of concretes of 0.60 w/c for 22 cements of Rendchen (1985) 240 Table C6 Differences between 'predicted' and observed properties of concrete 241 Table C7 Correlation coefficients from the regression analysis. 242
Table C8 Water demands for data of Bennett (1969) 244
Table C9 Analysis of cement and concrete data from C&CA for ci 960 249 Table ClO Regression for water demand of concrete from data in Table C9. 250
FIGURES
Figure 2.1 The basic principle of the Theory of Particle Mixtures 22 Figure 2.2 Relationship between mean size and fineness for Portland cement 26 Figure 2.3 Comparisons of methods for assessing mean size of cement 29 figure 2.4 Relationship between voids ratio and water content in the Vicat test 38
Figure 3.1 Particle and associated void 41
figure 3.2 Model of a particle, associated void and related particles. 41 figure 3.3 Dilated structure of coarse particles in a mixture containing fine particles. 43
figure 3 .4 Example of a voids ratio diagram 46
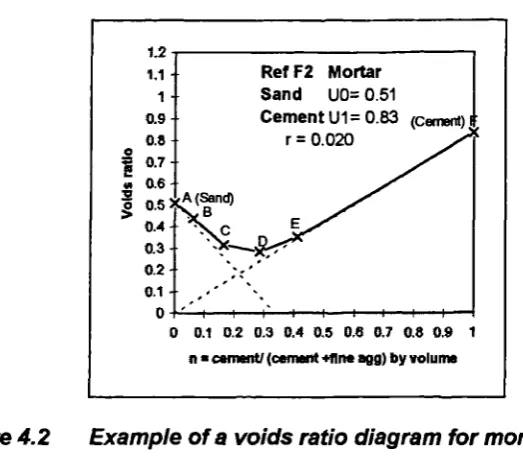
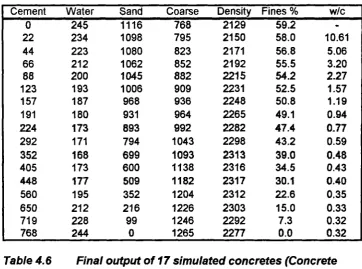
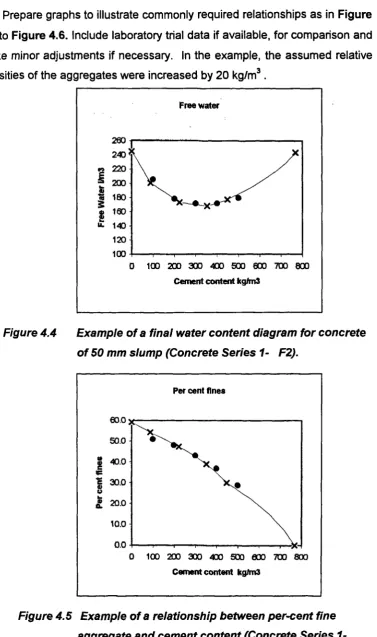
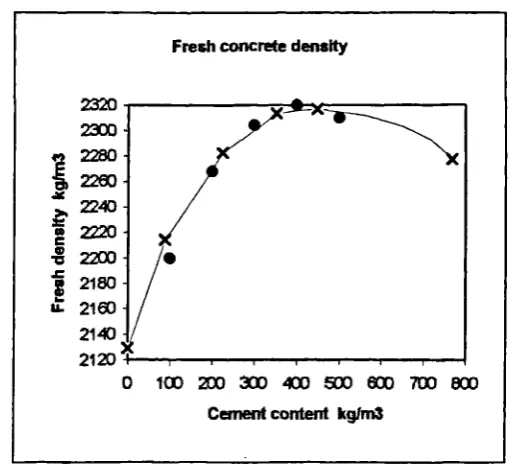
figure 3.11 Effect of particle interference due to introduction of coarse material. 63 Figure 3.12 Coarse and fine particle distribution at Change Point B 69 figure 3.13 Coarse and fine particle distribution at Change Point C 69 figure 3.14 Coarse and fine particle distribution at Change Point D 70 figure 3.15 Coarse and fine particle distribution at Change Point E 70 figure 4.1 Voids ratio diagram for sand cement mortar mixtures 78 Figure 4.2 Example of a voids ratio diagram for mortar (Concrete Series 1- F2). 85 figure 43 Example of one of the 6 concrete voids ratio diagrams 85 figure 44 Example of a final water content diagram (Concrete Series 1- F2). 88 figure 45 Relationship between per-cent fine aggregate and cement content 88 Figure 4.6 Example of a relationship between plastic density and cement content 89 figure 5.1 Effect of entrained air content on water reduction at different cement contents 97 figure 5.2 Water reduction for air entrained concrete in Concrete Series 2 98 Figure 5.3 Comparison between the data from Figure 5.1 and Figure 5.2 at 4.5 % air 99
Figure 5.4 Time or temperature-dependent effects 101
figure 55 Straight-line relationship between strength (logarithmic scale) and w/c 105 Figure 5.6 Relationship between strength and w/c based on Figure 5.5 106 figure 5.7 Dual-straight-line relationship between strength (log scale) against w/c 108 figure 5.8 Relationship between strength and w/c based on Figure 5.7 108 figure 59 Influence of cement strength on concrete; data from Visvesvaraya (1987) 110 figure 5.10 Influence of age on concrete strength v w/c relation from Ackroyd (1963) 114
figure 5.11 Effects of age of test on strength v w/c for concrete (McIntosh 1966) 116 figure 5.12 Relationships between 3, 7 and 28 day strength and w/c for (P4RI) 117 figure 5.13 Relations between 3 and 7 day v 28 day strength for (P4 Ri). 118 figure 5.14 Relationships for strength gain from early to 28 days for (P4R1). 119 figure 5.15 Complex relationship between strength and cement content 121 figure 5.16 Comparison of measured and predicted strengths allowing for air content 123
figure 5.17 Effect of entrapped air in reducing strength 123 Figure 0.18 Effect of entrapped air content on strength reduction 124 figure 5.19 Simulation of the strengths of air-entrained and non-air entrained concretes 126 figure 5.20 Simulation of the strengths of plasticised concretes 127 figure 5.21 Strength v water! (cement + e x fly ash) for Hobbs (1985) 128 figure 5.22 Strength v water! (cement + e x silica fume ) for Gutierrez (1996) 129 Figure 5.23 Computer spreadsheet input and output data for preliminary calculations 130 figure 5.24 Computer spreadsheet input screen for concrete simulation 131 Figure 5.25 Computer output screen for quantities of materials per m 3 for concrete. 131 Figure 5.26 Computer output screen for properties of concrete 132 Figure 5.27 Computer output screen for a concrete to meet a particular specification. 132 Figure 6.1 Voids ratio diagram demonstrating straight line relations and change points 135 Figure 6.2 Voids ratio diagrams for mixtures of single sizes of aggregates. 138 Figure 6.3 Straight line relationships and changes in gradient in voids ratio diagrams. 139 Figure 6.4 Void ratio diagrams for materials consisting of 1 or 4 components 140 Figure 6.5 Voids ratio diagrams for mixtures of graded fine and coarse aggregates. 142
Figure 6.6 Voids ratio diagram for cement-sand mortar at 50 nun slump. 144 Figure 6.7 Water demand of cement-sand mortar at 50 mm slump. 145 Figure 6.8 Concrete Series 1- theoretical and observed water demands of fresh concrete 151 Figure 6.9 Concrete Series 1- relationships between water content and cement content 152 Figure 6.10 Concrete Series 1- theoretical and observed per-cent fines 153 Figure 6.11 Concrete Series 1- relationships between per cent fines and cement content 155 Figure 6.12 Concrete Series 1- theoretical and observed densities 158 Figure 6.13 Concrete Series 1- relationships between density and cement content 159
Figure 6.18 Concrete Series 2- relationships for P1 R4 173 Figure 6.19 Concrete Series 2- properties of concrete with and without admixtures 175
Acknowledgments
The initial impetus for the work came from Dr. TC Powers' seminal book on
fresh concrete, his other published papers and from personal discussion in
the US and subsequent correspondence.
Professor PJE Sullivan and Dr C D'Mello tutored the last three years research
for this thesis and provided valuable encouragement, technical comment and
advice on presentation. For their kindness and the ready availability of staff
and facilities of the City University the author is much indebted.
Numerous individuals have assisted through discussion, correspondence and
the provision of published and unpublished information including Professor
CL Page and Dr. C Thornton of the University of Aston, Dr. G Lees of
Birmingham University, Professor G Lloedolff of the University of
Stellenbosch, Professor G Wischers of the VDZ in Dusseldorf, Professor E
Sellevold and Dr. E Mortsell of the Technical University of Trondheim,
Professor S Numata of Nishi-Nippon Institute of Technology, Japan, Dr. F de
Larrard of LCPC, France, Mr A Corish of Blue Circle Cement, Mr BV Brown
and Mr R Ryle of Readymix UK Ltd.
Mr P Barnes of Readicrete Ltd and Mr I Forder of Readymix (Western)
provided detailed results of concrete trials and Mr S J Martin of the Readymix
UK Ltd provided valuable help with tests of aggregates and data on mixtures
of additions and cement. Mr I Smith of Fosroc was particularly helpful in
answering queries concerning admixtures. Assistance was also provided in
this area by the Cement Admixtures Association, in particular by the chairman
Mr C Keeley and the secretary Mr J Buekett. Mr R Boulton of Minelco Ltd
supplied information on the use of the Theory of Particle Mixtures for
heavyweight concrete. Mr LKA Sear of Tarmac Topmix Ltd provided
information on strength v w/c at high values of w/c.
Thanks are due to those who over a number of years have assisted the
author with encouragement and advice including, Dr. TA Harrison of the
Quarry Products Association, Mr JM Uren of North East Slag Cement Ltd, Dr.
DD Higgins of CSMA, Dr. L Cassar of ltalcementi, Mr J Bennett of Questjay
Ltd, Mr N Greig of CCS Associates, Mr M Roberts of C & G Concrete Ltd, Mr
D Wimpenny of Sir William Haicrow and Prs, Mr PED Howes and Mr J Platt of
ARC Ltd, Mr JF Richardson of Redland Aggregates Ltd, Mr P Rhodes of
Tilcon Ltd, Mr CM Reeves of BFS Services and Mr KW Day, concrete
consultant from Australia.
A number of research projects at Universities, including Dundee, Leeds and
Queen Mary and Westfie'd have utilized earlier or current computerized
versions of parts of the Theory of Particle Mixtures.
particularly helpful in extending its use to concretes with plasticising admixtures.
The Centre for Concrete Information of the BCA made light work for the author by tracing and providing copies of recent research papers. In particular the monthly issue of "Concrete Current Awareness" enabled papers of potential interest to be identified and accessed quickly.
The author acknowledges with special gratitude, the help and forbearance of his wife, Gret, over many years in taking second place to a computer and for collating extracts from the literature for this thesis.
Declaration
Abstract
This thesis describes in detail the development of a Theory of Particle Mixtures by which certain aspects of the behaviour of mixtures may be predicted by computer simulation from a knowledge of the mean size, voids ratio and relative density of each of the components. The Theory involves mathematical formulae and geometrical models to explain the roles of void filling and particle interference which determine the properties of mixtures. The practical operation of the theory has been confirmed for application to aggregates, powder pastes, mortars and concretes covering such properties as water demand, cohesion and per cent fines, cement content and plastic density. Derived relationships are examined including those between water demand and cement content
The original concept proposed by the author in 1983 has been confirmed in principle and modified in detail on the basis of the current research and extended to include plasticising or water reducing and air entraining admixtures and the properties of air content and compressive strength together with derived relationships such as those between compressive strength and cement content. The influences on concrete strength due to cement strength, aggregate type and age at test are included as well as w/c and air content.
Confirmation of the validity of the Theory is provided from an extensive appraisal of the literature and from laboratory tests of aggregates, mortars and concretes. A number of case studies have been included to demonstrate application of the Theory to practice.
In particular, a technique has been developed to enable the complete particle size distribution of concrete to be synthesized and optimized by computer simulation for any number of component materials or size fractions; an example is provided for 11 size fractions.
8W lImor% e E % fcem N/mm2 fcu N/mm2 F F F m2/kg F % Fs G J k LBD kg/ms m n NOTATION
Symbol Units
A-F
a-f
a %
A,B
a,b,c
b
cJ
d,D Lm or mm
Definition
slope change points in voids ratio diagrams
slope change points in concrete voids ratio diagrams
air content
suffix i for entrapped air and 2 for entrained air factors for relating strength and water/cement
empirical factors for water content adjustments due to air entrainment
empirical factor for the z formula suffix 1,2,3 014
cohesion adjustment factor
d or Di for size of smaller material
D or Do for size of larger material mean size calculated on log basis
suffix c for cement, p for powder, fa for fine aggregate and ca for coarse aggregate
change in water demand
efficiency factor for an addition
entrapped air content
cement strength EN 196 mortar prisms
concrete strength BS 1881 standard cubes adjustment factor for size ratio r
empirical factors for strength
suffix age for age and agg for aggregate fineness (Blame)
entrained air content associated with plasticiser
water adjustment factor for slump normal cohesion factor
empirical adjustment factor
various empirical constants loose bulk density
spacing factor for coarse particles e.g. md
(1-n) n P % p,Q r R RD RS mm S SL mm Sc % T % U l/m
im or mm
m or mm WR x x x xo z V
proportion of coarse material by volume
slope of Rosin Rammier distribution
cumulative per cent passing a sieve size by volume
empirical concrete strength factors
ratio of smaller size/larger size composite strength factor for air
relative density
reference slump
solids content i.e. solids per unit total volume
slump
water content by mass of powder in Vicat test
total air content
voids ratio i.e. voids per unit Qlld volume suffix o for larger material and i for smaller material suffix " for effective voids ratio
suffix n when fine material has proportion n suffix x for safe cohesion
suffix jx for adjusted voids ratio for safe cohesion voids content i.e. voids per unit QJ volume suffix c for cement
suffix w for water, wadJ for adjustment for slump
suffix fa for fine aggregate
suffix ca for coarse aggregate
suffix a for air
water reduction for air
notional dimension of void
point of safe cohesion in voids ratio diagram for concrete
free water/cement by mass
characteristic size of Rosin Rammler distribution
1. Introduction
This work originated with an investigation by the author prior to 1983, to develop a Theory of Particle Mixtures, enabling the behaviour of fresh concrete to be predicted and economic designs to be prepared from a knowledge of readily available properties of the component materials. The results were published in Dewar (1983) and further work was published in Dewar (1986-1996).
The original work relied on the investigations of Powers (1964 and earlier) for introducing the benefits of voids ratio diagrams for demonstrating the behaviour of mixtures. By analysis of such diagrams for aggregates and the development of suitable models, the author was able to develop a tentative Theory of Particle Mixtures and to apply it to aggregates, mortars and concretes. Experience since 1983 identified the need for modifications and further development, and this present work was designed to achieve the following
• Confirm or modify the basic concepts of the Theory, and the empirical constants used in the formulae from more detailed experimental work by the author and others.
• Develop the Theory and formulae to cover more accurately size ratios between 0.15 and 1.
• Appraise published and unpublished research and other technical information, in particular that since 1983.
• Investigate and where appropriate take account of the influences of • different energy levels of compaction
• cement properties
• inclusion of plasticising admixtures and air- entraining agents • inclusion of additions such as fly ash, ground granulated slag
and silica fume
• Develop empirical formulae for including entrained air content and strength of concrete within the prediction system.
• Develop a method for optimizing multi-component mixtures for minimum voids ratio
Each of these aims has been achieved to a greater or lesser extent. Where uncertainties remain they have been identified for future workers.
1.1 Modelling principles and techniques
Hansen (1986) warns that a
is merely a theoretical description proposed to explain observed experimental facts and to provide additional insight into the behaviour of a material. A model cannot, and should not, be considered to be a correct description in any absolute sense. This is why more than one model may adequately interpret the known facts."
Beeby (1991) points out the dangers of modelling based on empirical curve fitting without a sound physical basis, albeit recognising that an engineer must be willing to employ empiricism and theory while understanding the limitations of both. Beeby considers that some engineers seem to over-value experience, empirical knowledge and rules of thumb and to under-rate theory, while others tend to the opposite fault.
Beeby also stresses the relative reliability of empirical methods for interpolation but unreliability for extrapolation and that only a fundamental understanding on the basis of sound theory provides confidence for moving forward into new areas.
The deliberately self-imposed constraint of using test methods and data commonly available to the concrete industry meant that for modelling of strength the author was reliant upon well-established empirical models, but again with useful aids from theoretical physical concepts as will be apparent from the discussion.
Hansen (1986) identified the need to bridge-the-gap between science and engineering and between scientists and engineers. The author echoes this view, because in many instances it has not been feasible to translate or transfer concepts from the different technologies. For example, the author was not able to adopt concepts such as those reviewed by Beaudoin (1994) on the influence of pore structure on strength of cement systems.
There are many sophisticated techniques, principally in the realm of Powder Technology, some involving particle-by-particle sequential packing taking account of such aspects as impact, elasticity and rebound during placement and subsequent movement during vibration, transport and discharge. For example, de Schutter (1993) utilizes a random particle method, employing 2 dimensional triangulation for the successive placing of particles in space. Other techniques such as fractal geometry are being applied, e.g. Kennedy (1993) utilizes this technique to characterize shapes of aggregate and powder particles. As the prime interest in this present work is the overall end-result rather than detailed process, these elegant and interesting methods have not been pursued.
Some of the relatively less sophisticated models rely on successive combination of component materials or size fractions rather than individual particles. For example, Lees(1970) proceeds successively from coarsest to finest material while Dewar (1983 etc) proceeds in the reverse direction.
reliance on computerization to remove the tedium of repetitive complex calculations. Indeed, many of the developments, including that of the author, are impracticable without the computer. It is not surprising therefore that the growth in interest in modelling has had to await the ready availability of computers both for analysis and for making the results usable in practice. Thus, today, relative complexity is much less of a bamer with regard to application, although it may remain a barrier with regard to persuasion.
Numata (1994) has developed a theory-based modification of the methods of Talbot and Richart and of Weymouth. Roy (1992), Palbol (1994) and Goltermann(1997) favoured use of the Toufar/Aim (1967) model of dry particle packing or a solid suspension model in association with the Rosin-Rammier size distribution parameters (see Section 2.1.2 for an explanation of the R-R distribution) . Some authors, e.g. Andersen (1989), Roy (1993), Goltermann (1997) and Palbol, utilize ternary diagrams or packing triangles. Sedran (1994) and de Larrard (1995) use a theory of viscosity developed by Mooney (1951). An assessment of the Toufar Aim models is provided in Appendix 0.
Some workers, notably Powers (1968), Lees (1970), Dewar (1983) and Loedolif (1985) amongst many others favour voids ratio diagrams because they yield straight line boundary relationships while some, e.g. Goltermann (1997) favour solid content diagrams possibly because of their simpler visual relation to bulk density.
Some workers, e.g. Dewar (1983) and Hope (1985) applied a systematic approach to design of concrete by first considering cement paste, then mortar and finally concrete recognising the need for an excess of mortar over that required to just fill the voids.
With regard to overall reviews, Larsen (1991) reviews a number of particle packing concepts but without detailed assessment. Popovics (1990) in a limited review was rather despairing of the state of prediction of water demand of concrete. He concluded that prediction was unreliable and valid only over a narrow range; the author's original work, Dewar (1983, 1986) was not included in this review.
Most workers are concerned with optimizing the design of concrete for maximum density, or minimum water demand, but Palbol (1994) and the author also consider the effects, or even benefits, of moving away from the optimum mixture.
Looking to the future, Frohnsdorf (1995) predicts that virtual cement and concrete technology will significantly influence development, through integration of knowledge systems, complementary simulation models and databases. Consistent with part of this prediction, Foo (1993 ) describes a knowledge-based expert system for concrete mixture design, based upon computer processing of input conditions against a substantial accumulated database for the development of a best solution. Anderson (1989) reported on the computer-aided simulation of particle packing in relation to the American Strategic Highway Research Program, which is based on the work of Roy (1992) who also combined theory with the database approach. Eventually, it is reasonable to expect that, as predicted by Frohnsdorff, a preferred approach or set of approaches will arise adopting the best of the developed systems, but at the present time the field is wide open.
voids with paste and provide stable air voids of the required size for frost
resistance without recourse to air-entraining admixtures.
There are many very useful and well established concrete mixture design
methods, having as their main purpose the recommended proportions for trial
concrete batches to be made and adjusted in the laboratory, before transfer
to production. Many of these were developed before general computer
availability and rely on simplification. For example, most assume that water
content is constant over a wide range of cement content.
Unfortunately, these simplified methods are of little use to concrete producers
wishing to work with economy for thousands of cubic metres of concrete. For
this reason, the prime aim of the author is to develop methods which are
more accurate than a single trial in the laboratory with a single set of samples
and much more accurate than is possible with simplified approaches.
1.2 The investigation
To achieve this aim, the author has used test data on aggregates to develop
a general Theory of Particle Mixtures based on considerations of void filling
and particle interference and involving geometrical and mathematical models
and the analysis of voids ratio diagrams. The author is reliant on the concepts
of Powers (1968 and earlier) in providing the foundation on which the Theory
has been constructed. Empirical constants have been used sparingly.
The Theory has then been extended to cover cement pastes, mortars and
concretes and the inclusion of additional fine powders and plasticising and air
entraining admixtures. The properties covered include water demand, slump,
cohesion, cement content, plastic density and compressive strength.
Many examples are provided comparing theoretical relationships or inferences with practice and a number of case studies are included to demonstrate the use of the Theory as a diagnostic and development tool.
Uncertainties identified but not resolved have been reported as recommendations for consideration in any future related work.
2. The principal properties and test methods
Smaller material
Combination
Larger
material
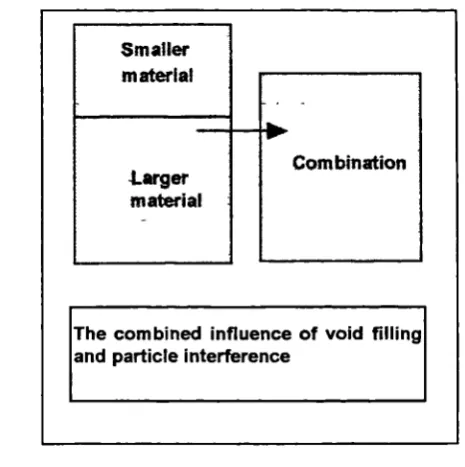
[image:23.595.181.414.142.376.2]The combined influence of void filling and particle interference
Figure 2.1 The basic principle of the Theory of Particle Mixtures
The basic concept of the Theory of Particle Mixtures, shown in Figure 2.1, is that, when two particulate materials of different sizes are mixed together, the smaller particles will attempt to fill the voids between the larger particles, but the structure of both coarse and fine materials will be disrupted by particle interference creating additional voids. The modelling process and associated Theory of Particle Mixtures require relevant properties to be defined and appropriate test methods to be selected in order to quantify the properties.
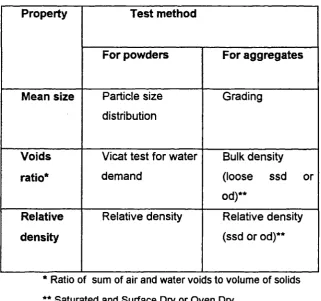
The main relevant properties are mean size, voids ratio and relative density, the latter being required only to convert data from mass to volume. The test methods in Table 2.1 were selected on the basis of perceived relevance to these properties, their common use in industrial practice and the availability of data.
Property Test method
For powders For aggregates
Mean size Particle size Grading
distribution
Voids Vicat test for water Bulk density
ratio* demand (loose ssd or
od)**
Relative Relative density Relative density
density (ssd or od)**
* Ratio of sum of air and water voids to volume of solids
[image:24.595.143.465.57.358.2]** Saturated and Surface Dry or Oven Dry
Table 21
Properties and test methods
2.1 Mean size
2.1.1 Mean sizes of aggregates
Popovics (1979) considered average particle size as a more accurate
numerical characteristic of the coarseness or fineness of an aggregate
fraction than maximum or minimum size. Popovics identified four
measurements of average particle size: these are arithmetic, geometric,
harmonic and logarithmic averages. Other possibilities include average
volume diameter and specific surface diameter, both based upon equivalent
spheres.
There is no consensus on the most relevant method. For example: Hughes
(1960) used mean size on an arithmetic basis rather than a logarithmic basis;
Powers (1968) preferred geometric mean because cumulative plot to
diameter for fine aggregates; Goltermann (1997) and others have adopted the position parameter of the Rosin-Rammier distribution (see Section 2.1.2 for an explanation of the R-R distribution).
Thus, size characterisation is an area where more work could be useful(y done to resolve the question of the most relevant method. Pro tem, the author has continued to use the logarithmic basis adopted by Dewar (1983).
Thus, the mean size of a single sized material is calculated from
Log (mean size) = 0.5 (log (upper size) - log (Lower size))
Eqn 2.1
For a graded material, the mean size is calculated from the grading as
Log (mean size)
= El
voLpropn x log (meansize
ofthe size fraction)]
Eqn 2.2
The size ratio of two materials to be combined in a mixture is defined as
- mean size of the smaller material
r -
mean size of the larger material
Eqn 2.3
Thus r is always 1.
2.1.2
Mean sizes of cements and other powders
When the full particle size distribution is not available, it is necessary either to assume the mean size on the basis of experience or to resort to alternative methods.
For cements, fineness measurements are commonly available and estimates of mean size may be made from them. The Blame values were the commonest basis used. Again it is recognised that other methods produce different answers and that standardisation or accurate conversion is needed for future work.
Fineness is related simply to the reciprocal of mean size, assuming that shape is a constant. UK data suggest that fineness of Portland cement and other powders can be converted approximately to mean size as shown in Figure 2.2, using the formulae in Eqn 2.4 or Eqn 2.5.
Mean size = kf /(RDx F) mm
Eqn 2.4
where
RD is the relative density of the powder and
F
is the fineness (Blame) in m2/kgis a constant typically 12 to 15 (14.4 from UK data; 12.2 from German data
or for a Portland cement, assuming a relative density of 3.2 (See later) and using k1 14.4
Mean size =4.5/F mm
0.025
0.020
-E
0 .015
-0.010 -
-0.005
0.000 -200 300 400 500 600 700 800
Fineness Cm2lkg)
Figure 2.2 Approximate relationship between mean size and fineness (Blame) for Portland cement (UK data)
Cement practitioners and researchers, e.g. Rendchen (1985) in Germany and
Sumner (1989) in the UK, commonly transform the particle size distributions
of cements and other ground materials by means of the Rosin-Rammler
distribution function which characterises a distribution by a size (or 'position')
factor ,
x0,
and slope,
n.The size factor, x0 is that associated with 63% of
the material passing. The mean size on a log basis
tipused by the author for
this present research corresponds to about 50% passing and is thus always
lower than
x .For example a typical cement might have a mean size
d,,of
13 .tm compared with a value of 22 p.m for
x0.
When the value of
x0
is known, but the full psd is not available, then it can be
assumed approximately that
d
,
=O.64xx o xn p.mEqn 2.6
or more accurately from
d,
= 1.06 x[lo(x o) -
o.53/t] p.111Rendchen (1985) has published data on 22 cements, having a wide range of properties, for which a summary is provided in Table 2.2, together with the results of an analysis made for this present work to examine different means of assessing mean size from the data.
Cement Fineness R-R constants Mean sze(Iog basis) mm
code m2lkg fl from pad from from R-R Accurate Approx lfrieress stn from; An from; & n Hi 271 31 0.85 0.0160 0.0144 0.0173 0.0176 0.0168 H2 293 32 0.82 0.0169 0.0135 0.0175 0.0178 0.0167 H3 300 28 0.89 0.0153 0.0132 0.0160 0.0164 0.0158 H4 308 28 0.79 0.0141 0.0126 0.0152 0.0152 0.0141 H5 321 27 0.87 0.0147 0.0122 0.0154 0.0156 0.0149 H6 282 18 1.09 0.0117 0.0138 0.0113 0.0117 0.0125 H7 344 19 0.91 0.0108 0.0114 0.0111 0.0113 0.0110 H8 361 14 1.11 0.0103 0.0109 0.0090 0.0092 0.0099 H9 373 16 0.94 0.0097 0.0107 0.0095 0.0097 0.0096 H10 371 13 1.04 0.0089 0.0107 0.0082 0.0083 0.0086 HIl 535 11 0.93 0.0069 0.0073 0.0067 0.0066 0.0065 H12 374 14 1.02 0.0090 0.0110 0.0087 0.0088 0.0091 NH1 403 17 0.95 0.0104 0.0098 0.0102 0.0103 0.0103 NH2 487 18 0.78 0.0095 0.0081 0.0100 0.0097 0.0089 NH3 602 11 0.89 0.0065 0.0066 0.0066 0.0064 0.0062 NH4 437 13 1.06 0.0093 0.0091 0.0082 0.0084 0.0088 NH5 517 11 1.08 0.0073 0.0077 0.0070 0.0071 0.0076 NH6 418 14 1.07 0.0098 0.0094 0.0088 0.0090 0.0095 SI 347 18 0.92 0.0106 0.0112 0.0106 0.0107 0.0105 S2 523 13 0.86 0.0078 0.0076 0.0076 0.0074 0.0071 53 341 14 1.15 0.0097 0.0113 0.0091 0.0094 0.0102 S4 510 10 1.03 0.0066 0.0076 0.0064 0.0063 0.0066
Average 0.0105 0.0105 0.0105 0.0106 0.0105
Table 2.2 Data on 22 cements as reported by Rendchen (1985) together with an analysis of different methods of assessing mean size on a log basis.
NOTE Cements coded H, NH and S are respectively normal commercial cements, more finely ground commercial cements and specially prepared cements with modified gypsum contents. HI to H 11 are Portland cements, H12 is a Portland blastfumace cement.
The methods investigated for estimating mean size were
1. Calculation direct from the reported particle size distribution.
2. The formula derived from the fineness and relative density. (Eqn
2.4)
3. Calculated straight-line distributions estimated from the reported
4. Calculation from the Rosin-Rammier parameters assuming that the mean size was coincident with the 50% point of the size distribution.(Eqn 2.7)
5. Calculation using a simplified formula involving the Rosin-Rammier
parameters. (Eqn 2.6)
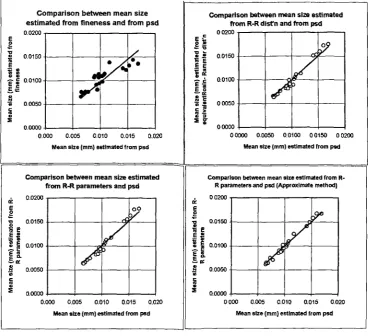
Taking Method 1, calculation direct from the psd, as the basis for comparison, the validity of the various other methods of assessing mean size can be judged from examination of Table 2.2 and Figure 2.3.
Comparison between mean size estimated from fineness and from psd 0.0200 - --F 0 0.0150
H
0.0100 4, 0.00500,0000 —4 — -0,000 0.005 0.010 0.015 0.020
Mean sIze (mm) estimated from pad Comparison between mean size estimated
from R-R parameters and psd 0.0200
-00
H
0.0100 . 0,0050 a,
C 'U
0.0000 -0.000 0.005 0.010 0,015 0.020
Mean size (mm) estimated from pad
Comparison between mean size estimated from R-R disVn and from psd 00200
-—x —sEe Eo 0.0150 0.0100 i;i 00050 C>
00000 -00000 0.0050 00100 00150 00200
Mean size (mm) estimated from pad Comparison between mean size estimated from
R-K parameters and pad (Approximate method) 00200— -F 0 0.0150 00100 0.0050 4)
0.0000 , -0000 0.005 0.010 0.015 0.020
[image:30.595.133.502.62.398.2]Mean sIze (mm) estimated from pad
Figure 2.3 Comparisons of methods for assessing mean size of cement, the basis of the comparison being the mean size on a log basis calculated from the reported particle size distribution.
For some very fine materials, e.g. silica fume, the mean particle size may be
uncertain, because of agglomeration and may be effectively much greater
than suggested by the literature. This is considered further for a particular
type of very fine powder in a case study in Section 8.1.
2.2 Relative Density
2.2.1 Relative densities of aggregates and fillers
It is assumed that the relevant volume of an aggregate particle is normally the
overall particle volume, including the pores occupied by air or water. The
relevant relative density for calculating this volume from tests of mass in air,
. Relative density on a saturated and surface dried basis to BS 812, if the bulk density tests were made on saturated and surface dried aggregates.
. Relative density on an oven-dried basis to BS 812, if the bulk density tests were made on oven dried aggregates.
It is assumed that the aggregates are used generally in production of concrete in both the plant and laboratory in a saturated condition, either as delivered and stored or after saturation, if pre-dried for laboratory purposes. Materials in other conditions, e.g. dry lightweight aggregate used dry, may need special consideration to ensure that the principles and calculations in this thesis remain valid. Fully saturated lightweight aggregates are fully within the scope.
For concrete calculations, the relevant relative density value of aggregates for converting from volume to mass is the
• Relative density on a saturated and surface dried basis.
This is compatible with the absorbed water and residual internal air being considered part of the volume and mass of the aggregate; the void content of the concrete is thus the sum of the volumes of free water and air external to the aggregate.
2.2.2
Relative densities of cements and other powders.
As cement operates in an aqueous environment in concrete, it is appropriate to use the value for relative density of Portland cement in water which is taken to be 3.2, corresponding to 3.12 - 3.15 in kerosene.
NOTE. The relative density of water is assumed to be unity although the actual value will be dependant on ions in solution.
For additions, e.g. fly ash, the relative density may be measured either in water or in kerosene.
For cements containing additions, allowance needs to be made for the re'ative densities of the components and for their proportions.
2.3 Voids ratio
The voids ratio of a particulate material is defined as the ratio of voids to solids under a stated method and energy level of compaction.
Factors, such as the range in particle size about the mean size and the shape and texture of particles, are accounted for in the assessment of the voids ratio of a material.
2.3.1 Influences on voids ratio
it is necessary to consider the medium in which the voids ratio is to be measured, i.e. whether the tests should be made in air or in water, and the energy level to be adopted in placing and compaction.
2.3.1.1 Influence of moisture environment on compaction.
Some workers, notably Powers (1968) and Loedolff (1985) have investigated the voids ratios of dry powders and dry mixtures of sand and cement under high energy compaction. Loedolif reported anomalous results on occasion in comparison with wet mixtures. This is not surprising for two reasons, viz.: the massive bulking effects with dry powders and the effects described in
Appendix A due to segregation under high energy compaction.
For typical aggregates, the voids ratios of the resulting mixtures are such that they may be simulated by compaction in air or water, but air is favoured for convenience by most workers.
For powders, the interparticle forces in air are substantially higher than in a saturated environment such as fresh concrete. Thus, it is more relevant for powders to be tested in a water medium at a consistence corresponding to typical concrete, as in the Vicat test.
In support of this, a number of workers have either adopted the Vicat test or have developed similar tests. For example, Chmielewski (1993 ) adopted the Vicat test as a measure of water demand of cement; Puntke (1996) developed a method for assessing fine components separately or together by determining voidage at saturation in water; de Larrard (1994) measured packing density of cement as a water-cement paste incorporating a plasticiser as necessary. The method of judging consistency was not described by de Larrard.
Contributions by Murphy and Newman to discussion of Murdock (1960) confirm the significance for concrete production of differences in the water demand of cement in the Vicat test.
As a further justification for using the Vicat test, Powers (1968) reported that typically, cement paste of normal consistency yields a slump of about 40-50mm. This was confirmed in laboratory tests by the author.
not done in the present work but is recommended to be considered for similar work in the future.
2.3.1.2 Influence of the energy level of compaction.
Opinion is divided on the question of the compactive effort to be adopted when simulating conditions of particles in most conventional concretes. It is clear that some workers have been attracted to higher energy levels, e.g. rodding or vibration, on the grounds of better reproducibility of test results and because of the approach to a lower limiting value for voids ratio or because of particular construction situations under consideration.
All methods of placing, with or without compactive effort, rely on displacement of air and in the process may encourage segregation of the placed material which in turn will introduce variations in void ratio within the mixture and affect the overall value.
NOTE In dry mixtures displacement of air is to be expected. In wet mixtures segregation of air and/or water needs to be considered
There are at least three main types of segregation to be avoided
• flow of fine particles downwards between coarse particles under the action of gravity, rodding or vibration
• movement of coarse particles downwards and fine particles upwards under the action of rodding or vibration
• movement of coarse particles upwards due to a circulatory or convection effect induced by strong vibration and the container walls.
With loose poured packing only the first is likely to be significant and only for low proportions of fine material. Rodding or vibration may introduce the other types of segregation.
- Hughes (1960) developed various parameters for size and voidage of aggregates. In particular, Hughes favoured loose bulk density as more relevant than vibrated bulk density because the particles are "relatively free to reorientate themselves under any external influence".
- Bloem (1963) considered that loose void content of fine aggregate was a useful means for evaluating effect on water demand of concrete. Bloem also considered that fine aggregate particle shape and texture had a readily discernible effect on water demand of concrete.
- Hughes (1975) favoured loose bulk density for assessment of effect of coarse aggregate on water demand of concrete.
- Gaynor (1983) favoured a loose voids test for assessing sands for concrete with respect to effects of shape and texture.
- Johnston (1990) considered that the loosely packed (poured) condition reasonably represents the aggregate packing in concrete while it is being placed before consolidation.
- Brown (1993) favoured loose bulk density of aggregates as a means of assessing the combined effects of grading and shape.
- Numata (1995) observed that the state of fine aggregate in concrete corresponds to the loosely packed state because of the presence of powder.
Considering next those workers having divided or intermediate views
- Powers (1968) favoured rodded, rather than loose or vibrated, bulk density while recognising that voids measurement is more sensitive to differences in shape, if it is based on the loose aggregate volume.
- Goltermann (1997) adopted a hand operated jolting table.
Considering those workers who favour higher energy compaction
- Talbot (1923) utilised rodded bulk density (bo) test of coarse aggregates for assessing the coarse aggregate content (b) of concrete by application of a reduction factor (bib0) of 0.65 to 0.75, typically. Talbot recognised that (b/b0) could not reach unity because of wedging action by the mortar and that coarse aggregate particles in concrete might not arrange themselves as well as when measured alone. The (b/b0) concept continues to be used in the ACI method of concrete mix design today.
- Stewart (1962) considered it to be important for the method of compaction of aggregates to be comparable with that used in concrete. Being concerned more with vibrated concretes, Stewart adopted vibration for assessing aggregates.
- Bloem (1963) used a factored volume assessed from the dry-rodded bulk density of coarse aggregate to calculate the volume to be used in all concretes irrespective of cement content. The multiplying factor varies between 0.35 and 0.85 dependent upon the fineness of the sand and maximum size of coarse aggregate.
- Lloedolff (1986) determined packing curves under intense vibration exeeding 20 mins for dry and wet (75 mm slump) materials for individual materials and in combinations including powders.
- The ACI (1993) uses the volumes of oven-dry rodded coarse and fine aggregate as a means of assessing the quantities required for concrete. For coarse aggregate this requires a substantial reduction factor, e.g. 0.72, to be applied to obtain the quantity to be used in practice to allow for interference from the sand and to allow for normal workability.
Finally, considering those workers who have compared methods
- Moncrieff (1953) compared bulk densities of natural and crushed fine aggregates in the loose and rodded condition. Whereas, compacted natural sand had a bulk density about 5% higher than in the loose condition, the difference increased to about 10% for the crushed stone. Thus, two materials having the same bulk density and voids ratio in the loose state could be expected to differ by about 5% in bulk density when compared in the compacted state, with the crushed material yielding the higher value. Thus, it is important firstly to decide on the most appropriate method to simulate practice and then to use the chosen method consistently.
- Hughes (1962) concluded that measurement of maximum bulk density under vibration was unreliable due to effects of containers and due to difficulty in determining a suitable end point. It was possible for continued vibration to decrease bulk density. Hughes adopted minimum or "loose" bulk density because it was easier to determine, confirming an earlier view of Worthington (1953).
Unfortunately, there is not a simple conversion from rodded or vibrated density to, or from, loose bulk density. Indeed an angular material may have a lower voids ratio than a round material under vibration but a higher voids ratio under loose packing conditions. Thus, the conversion process is suspect and is better avoided.
Some techniques may be more likely to promote forms of segregation which may not occur, or be less likely to occur, with concrete and with a low energy method.
introduce significant effects of segregation. For concretes of medium and high workability in common use today, the loose bulk density test in air is considered the more relevant for both fine and coarse aggregates.
Of course, there may be construction situations when a rodded or vibrated condition may be more appropriate than a loose condition, e.g. concrete of very low workability to be compacted by heavy vibration and/or pressure. These have not been considered to be within the scope of this present work.
Further considerations of the effects and pitfalls of high energy compaction of aggregates are provided in Appendix A.
2.3.2 Voids ratios of aggregates
Taking account of the discussion on moisture condition and energy level, the BS
812
method of assessing the loose bulk density of aggregates was selected as appropriate for work relating to mortars and concretes.The voids ratio of an aggregate can be calculated from its bulk density in air and from its relative density. The aggregate condition may be either oven dried or saturated and surface dried.
The formula for calculating the voids ratio,
U,
of an aggregate is1000 x RD LBD
Eqn 2.8
where RD is the relative density of the aggregate and LBD is the loose bulk density of the aggregate.
2.3.3 Voids ratios of cements and ofher powders
The voids ratio Ufor a powder can be estimated from the Vicat test using the following formula.
U=(RD x SC+a)/(1OO-a)
Eqn 2.9
where
RD is the relative density of the powder
SC is the water content of the paste at standard consistence in the Vicat test to EN 196, calculated as a percentage of the mass of cement
a1, is the air content (%) in the paste, say 1.5.
For Portland cements, a typical relation between voids ratio and water demand of the cement paste is shown in Figure 2.4.
__ /7'
__ __ 7,
-7,
7 ___ ___ ___
I-15 20 25 30 35
Water content %In Vtcat test
Figure 2.4 Relationship between voids ratio and water content In
the Vicat test for Portland cement having a relative density of 3.2 in water
A voids ratio of 0.825 corresponds to a typical paste water demand of 25%.
2.4 Overview
Three properties only are required to characterise each material for prediction
of properties of fresh mortars and concretes. These properties are mean size, 120
1.10
1.00
voids ratio and relative density. They can be estimated from commonly
available test data without need for additional tests or special equipment.
Typical values for common concreting materials are shown In Table 2.3.
,an size Voids Relative (mm) ratio density
Fine
aggregate 0.50 0.70 2.60
Coarse
aggregate 11 0.80 2.55
3. Theory of Particle Mixtures
In this section, the Theory of Particle Mixtures is developed from analysis of
tests of aggregates firstly to cover mixtures of
two single-sized components
two graded components
. three or more components
before extension to cover mortars and concretes in Section 4.
3.1 General theory of particle mixtures developed for
mixtures of two single sized components
Visual and mathematical models are used to explain the theory and to show
how the various constants and formulae have been derived. In particular, the
value of the voids ratio diagram is emphasized for understanding the
interactions between the various mechanisms.
Some comparisons between theoretical and actual voids ratio diagrams are
provided to assist judgment and to anticipate the more comprehensive
comparisons in later sections, without distracting from the general flow of the
development.
It is assumed that significant segregation does not occur.
3.1.1 Modeling of particles and voids
For analytical purposes, each real particle in a mixture of single-sized
particles is assumed to be associated with a single corresponding void, as in
Void
I-Figure 3.1 Particle and associated void
The voids ratio for the particular material, as used by Powers (1968) and in
this report, is defined as the ratio of total void volume to total solid volume
determined by compaction under stated conditions (See Section 2.3 earlier)
NOTE. Powers used the term 'specific void content' in his earlier work but adopted 'voids ratio' latterly.
The voids ratio is a function of the shape and surface texture of particles and
of the grading about the "mean" size of the particles.
For analyzing voids ratio diagrams, the author has developed a number of
3-dimensional geometric models, such as those shown in Figure 3.2 and Figure 3.3.
For both analytical purposes and for easy comprehension, a particle of
volume
D3is modelled as a cube having a "mean" size
D.It should be
understood that a cube is used merely for
conveniencein the visual model
and there is no assumption that this is a real, common or ideal shape.
By adopting a convenient arrangement for the composite structure as in
Figure
3.2,it is possible to model any mean size and voids ratio for any given
particulate material,. The use of an expanding or contracting "ins" or camera
diaphragm structure enables any voids ratio between 0 and unity to be
accommodated by increasing or decreasing
X,the side length of the cubical
void associated with a particle.
For the case, when X ^
D,then each particle is associated with a
corresponding void volume as in Figure 3.2 where X is the mean size of void
and
Dis the mean size of particle.
The voids ratio is given by
Eqn 3.1
Thus
X=DV1T
Eqn 3.2
For the particular case when the voids ratio is
unity,the coarse particles are
in contact only at the corners.
Where the nature of the material results in a voids ratio greater than unity,
e.g. due to a very unfavorable real shape, or due to agglomeration of
particles, then the model needs to be considered to expand beyond
X = D togive notional "cubical" particles not in contact.
are also, respectively, the volumetric proportions of the fine component in a
the two-size particle mixture for the two extreme situations of all coarse and
all fine material.
Thus, for the coarse particles alone
x03
U0 = and
D03 X0 = D 0
3JU7
Eqn 3.3 and for the fine particles alone
U13 and
X1=D13.JUT
Eqn 3.4
,nD
4 xo,,
,l0+rnD1.: -:""
_____________________
Figure 3.3 3-dimensional model of the dilated structure of coarse particles in a mixture containing fine particles.
The mixing of fine particles and coarse particles dilates the structure of the
coarse particles. This is modelled by assuming that the coarse particles
move apart, as in Figure 3.3, to occupy the centres of spaces which have the
same geometric relationship with the contained void, as existed in the model
Qijy
(D0+mDi) D0
-Eqn 3.5
where the coarse particles are spaced apart m times the fine particle mean
size
D1.The effective voids ratio of the coarse particles when the structure is dilated
is
3
1,,\3
,,'3
________________
(Do +mDi) -i-xo) —D0 = (li-mr)3 + D
(XO)
- 1
Uo=
Eqn 3.6
where the ratio of mean sizes, is
r=
Eqn 3.7
but from
Eqn 3.5 and Eqn 3.7
(x) 3 = U0(D0 -i-mDi) 3
=
U0(1+mr)3D
,,
3 / 3
i.e.
(x0)
/Do = U(1-,-mr)3
Substituting in
Eqn 3.6
then
=
(i + mr) 3
+
U0(i
+
mr) 3 - 1.
which simplifies to
= (1 +
U0)(i + mr) 3 —1
Eqn 3.8
1 ____ 1
i+u0J'
1
Eqn 3.9 In 3.1.2 a method is described for estimating U" 0 and m graphically using a
Voids Ratio Diagram.
3.1.2 Voids ratio diagrams.
Voids ratio diagrams, first introduced by Powers (1968 and earlier) are
essential tools for understanding the processes involved in the combination
of particulate materials. Figure 3.4 to Figure 3.7 show the basic elements of
such diagrams.
NOTE They have a particular advantage over other forms of diagram which
relate to the volume of the container, rather than to the volume of solids,
because the essential theoretical relationships are straight lines.
These types of diagram have been adopted by Lees (1970) and Al Jarallah
(1981) for dense asphaltic compositions, by Dewar (1983) and Loedolif
(1986) for aggregates and concretes and by Kantha Rao (1993) for polymer
concretes. Lees for example, identified size ratio, particle shape and texture,
void ratios of components, container size and compactive effort as relevant
parameters determining the shape and position of the diagram. Some
workers, while utilizing the concept, have used it primarily for display
purposes and others, notably Powers (1968), have used it for analytical
purposes and as a design aid. Loedolff (1986) utilized laboratory obtained
void ratio diagrams of aggregates before introducing finer materials e.g.
cement, fly-ash, ground slag or silica fume assessed in the same way.
Dewar(1983) used the diagrams to develop the first version of a Theory of
Particle Mixtures and applied it to aggregates, mortars and concretes.
To produce a voids ratio diagram, the voids ratios of the coarse and fine
components, U 0 and U 1 , of a two-material mixture are plotted on the left and