Incorporating Genomic Organisation, and Application to
Enterobacterial Plant Pathogens
Leighton Pritchard1*, Hui Liu1, Clare Booth2, Emma Douglas1, Patrice Franc¸ois3, Jacques Schrenzel3, Peter E. Hedley2, Paul R. J. Birch1,4, Ian K. Toth1*
1Plant Pathology Programme, SCRI, Dundee, Scotland, United Kingdom,2Genetics Programme, SCRI, Dundee, Scotland, United Kingdom, 3Genomic Research Laboratory, Infectious Diseases Service, Geneva University Hospitals and the University of Geneva, Geneva, Switzerland,4Division of Plant Science, College of Life Sciences, University of Dundee at SCRI, Dundee, Scotland, United Kingdom
Abstract
Microarray comparative genomic hybridisation (aCGH) provides an estimate of the relative abundance of genomic DNA (gDNA) taken from comparator and reference organisms by hybridisation to a microarray containing probes that represent sequences from the reference organism. The experimental method is used in a number of biological applications, including the detection of human chromosomal aberrations, and in comparative genomic analysis of bacterial strains, but optimisation of the analysis is desirable in each problem domain. We present a method for analysis of bacterial aCGH data that encodes spatial information from the reference genome in a hidden Markov model. This technique is the first such method to be validated in comparisons of sequenced bacteria that diverge at the strain and at the genus level:
Pectobacterium atrosepticumSCRI1043 (Pba1043) andDickeya dadantii3937 (Dda3937); andLactococcus lactissubsp.lactis
IL1403 andL. lactissubsp.cremorisMG1363. In all cases our method is found to outperform common and widely used aCGH analysis methods that do not incorporate spatial information. This analysis is applied to comparisons between commercially important plant pathogenic soft-rotting enterobacteria (SRE)Pba1043,P. atrosepticumSCRI1039,P. carotovorum193, and
Dda3937. Our analysis indicates that it should not be assumed that hybridisation strength is a reliable proxy for sequence identity in aCGH experiments, and robustly extends the applicability of aCGH to bacterial comparisons at the genus level. Our results in the SRE further provide evidence for a dynamic, plastic ‘accessory’ genome, revealing major genomic islands encoding gene products that provide insight into, and may play a direct role in determining, variation amongst the SRE in terms of their environmental survival, host range and aetiology, such as phytotoxin synthesis, multidrug resistance, and nitrogen fixation.
Citation:Pritchard L, Liu H, Booth C, Douglas E, Franc¸ois P, et al. (2009) Microarray Comparative Genomic Hybridisation Analysis Incorporating Genomic Organisation, and Application to Enterobacterial Plant Pathogens. PLoS Comput Biol 5(8): e1000473. doi:10.1371/journal.pcbi.1000473
Editor:Weixiong Zhang, Washington University in Saint Louis, United States of America
ReceivedFebruary 5, 2009;AcceptedJuly 16, 2009;PublishedAugust 21, 2009
Copyright:ß2009 Pritchard et al. This is an open-access article distributed under the terms of the Creative Commons Attribution License, which permits unrestricted use, distribution, and reproduction in any medium, provided the original author and source are credited.
Funding:This work was supported by the Scottish Government Rural and Environment Research and Analysis Directorate (RERAD) [SCR/908/03, SCR/842/04]. JS and PF were also supported by the European Union [COST C05.0103 to JS] and the Swiss National Science Foundation [3100A0-116075/1 to PF, 3100A0-112370/1 to JS]. The funders had no role in study design, data collection and analysis, decision to publish, or preparation of the manuscript.
Competing Interests:The authors have declared that no competing interests exist.
* E-mail: [email protected] (LP); [email protected] (IKT)
Introduction
Microarray comparative genomic hybridisation (aCGH) provides an estimate of the relative abundance of genomic DNA (gDNA) taken from comparator and reference organisms by hybridisation to a microarray containing probes that represent sequences from the reference organism. This method has been used in a number of biological applications, including the detection of human chromo-somal aberrations [1,2]; comparisons of bacterial human pathogens [3–10]; bacterial plant pathogens [11,12]; industrially-important bacteria [13]; and comparative transcriptomics ofXenopus laevis[14]. Numerous algorithms and software packages have been applied to the analysis of this aCGH data in prokaryotes. The majority of these partition reference organism sequences into two mutually exclusive classes: sequences that are ‘present’ and sequences that are ‘absent or divergent’ in the comparator organism [e.g. 5,12,15,16]. Observed hybridisation data are, in each case, assumed to be reliable proxies for these classes.
In this manuscript we describe and apply an improved method for analysis of aCGH data from bacterial genome comparisons. This method incorporates spatial information about CDS location on the reference genome in a hidden Markov model (HMM). This spatial information is expected to capture pertinent biological and evolutionary information, such as operon structure, and regions of lateral gene transfer. Our approach differs from previously proposed, and widely-used, methods applied to bacterial aCGH, such as GACK and MPP, that consider hybridisation intensities of each reference probe as measurements that are independent of their genomic location [15,16], and is thus more similar to methods such as ArrayLeaRNA [17], which incorporates predicted operon structure into interpretations of microarray expression data, for a restricted set of organisms. We compare the relative performance of our method to commonly used bacterial aCGH analysis algorithms and software.
observed hybridisation scores and ratios and the presence or absence of a reference CDS in the comparator organism do not always hold strongly, and that this is particularly the case for more distantly-related organisms. Our data in particular do not support a distinction between ‘present’ and ‘absent or divergent’ classes of sequence, but rather between those sequences in the reference organism that do, and those that do not, have putative orthologues in the comparator genome. We find that the HMM is a better predictor of reference sequences that do not have a putative orthologue in the comparator organism than the other methods tested.
Spatial organisation of sequences on the reference genome has previously been incorporated into methods applied to aCGH analyses of copy number variation in human genomes. This has been represented using HMM [18] and segmentation methods [19]. Simple smoothing methods have also been used to identify breakpoints in this data [20]. However, the problem domain of human copy number aCGH (detecting copy number variation in a known genome sequence) differs from the problem domain of bacterial comparative genomic aCGH (identifying the presence or absence of putative orthologues of known genes in a genome of unknown sequence). To the best of our knowledge, this study describes the first application of a method incorporating such spatial information to aCGH for comparative genomics of unsequenced bacteria, and the first demonstration of the applicability of the technique as a whole across bacterial genera.
Pectobacterium atrosepticum(Pba),Pectobacterium carotovorum(Pcc), and Dickeyaspp. are plant pathogenic soft-rotting enterobacteria (SRE) that share a common ancestor. Despite their many similarities, these commercially significant pathogens differ in their host range, geographical distribution, aetiology and environmental persistence [21]. The molecular origins of these differences are not well understood, but this ecological flexibility is likely indicative of a dynamic, plastic genome with ‘core’ and ‘accessory’ components. There are currently two publicly available annotated genomes for these organisms:Pbastrain SCRI1043 (Pba1043) [22], andDickeya dadantiistrain 3937 (Dda3937; https://asap.ahabs.wisc.edu/; v6b). The availability of these sequences has rapidly advanced our understanding of these organisms, but broader comparisons are expected to deliver greater insight into the evolution and function of the SRE.
The major common virulence factors of the SRE are plant cell wall degrading enzymes (PCWDE) that degrade the plant cell wall to release nutrients in a so-called ‘brute force’ attack [23–25]. Other
virulence factors include virulence-associated secretion systems, siderophores, cell-surface polysaccharides and agglutinins [26,27].
By contrast, bacterial plant pathogens such asPseudomonasspp. are associated with a biotrophic ‘stealth’ interaction with the host. These ‘stealth’ pathogens employ mechanisms such as the type III secretion system (T3SS) to translocate effectors into host cells. The effectors modulate the host plant’s biochemical responses, implementing a wide array of strategies to circumvent host immunity [28–31]. However,Pba1043,Dda3937, and other SREs also encode a functioning T3SS and other gene products associated with this ‘stealth’ interaction, indicating a more complex relationship with their hosts than simple ‘brute-force’ necrotrophy [22,32–36]. Key factors with a confirmed role in virulence include type IV and type VI secretion systems, and the phytotoxin coronafacic acid (CFA), which is synthesised by thecfa gene cluster [22,37]. Other factors associated with persistence in, and adaptation to, the wider environment have been identified, such as genes associated with opine uptake, biofilm formation, antibiotic production, and nitrogen fixation [22].
In many bacteria, such genes associated with pathogenicity, and other phenotypically-distinguishing characters, are frequently associated with islands of horizontal gene transfer (HGT). This gene complement is often variable between strains and species, and is sometimes termed the ‘accessory genome’, in order to distinguish it from the ‘core genome’ that provides functionality presumed to be essential to all related organisms [5,9,22,38–40]. We expect that observed differences between the gene comple-ments of SRE will reflect differences in their phenotypes, and adaptations to their distinct environments, and that these differences will be preferentially located in islands of genes in their genomes. We use aCGH and apply our analysis method to identify genomic islands in Pba1043 that do not have putative orthologues in the unsequenced Pba strain SCRI1039 (Pba1039) andPccstrain SCRI193 (Pcc193), and in the sequencedDda3937. In this study, coding sequences (CDS) from Pba1043 that are predicted by aCGH to be absent or divergent inPba1039,Pcc193 orDda3937 are of interest because they may potentially contribute to Pba1043-specific phenotypes, including host interactions. Pairwise comparisons betweenPba1043 and these three organisms span a range of evolutionary distances since their most recent common ancestor withPba1043, and represent variation at strain, species and genus levels.
Our results for the SRE support a hypothesis that the genomes of SRE continue to be modified by the acquisition of genomic islands, and the model of an ‘accessory genome’ of niche-specific functionality that is composed, at least in part, of horizontally-acquired genomic islands. We identify major differences in the CDS carried within the accessory genomes of SRE and, while these recapitulate previous observations of major genomic islands made using alternative approaches [22,38], we also find a number of unexpected differences that provide insight into, and may play a direct role in determining, variation amongst the SRE in terms of their environmental survival, host range and aetiology.
Materials and Methods
Genome Sequences and Annotations
Annotated genome sequences were obtained from GenBank for Pba1043 (accession: NC_004547), Lactococcus lactis subsp. lactis Il1403 (accession: NC_002662), and L. lactis subsp. cremoris MG1363 (accession: NC_009004). Equivalent data forDda3937 was obtained from ASAP (https://asap.ahabs.wisc.edu/; v6b). CDS annotations from these sources were not modified for this study.
Author Summary
Identification of Putative Orthologues
Putative orthologues of bacterial CDS were identified using reciprocal best hit (RBH) analyses. RBH were identified by using each annotated CDS from the reference genome as the query in a sequence search against the comparator genome, andvice versa. A RBH was called when the best match to a query sequence had the query sequence as its own best match in the reciprocal comparison [see also 22,38]. For protein comparisons, FASTA 3.4t25 was used, and BLASTN 2.2.11 was used for nucleotide comparisons. Reciprocal best hits were interpreted as putative orthologues, and converted to Boolean ‘present’ and ‘absent’ states for model development and training. We would usually employ a threshold for RBH of a minimum of 30% identity over a minimum of 80% of the sequence length for protein comparisons. However, for this analysis we relaxed both criteria completely, and considered the best hit in each direction without such a filter. The division of CDS into ‘present’/‘absent’ classes on the basis of RBH without these thresholds corresponds to a strict classifier for allocating CDS to the ‘absent’ class.
Under the usual circumstances in which we perform these comparative analyses, we wish to exclude weak reciprocal matches from the ‘present’ set in order to avoid inappropriate attribute transfer or assignment. In those cases, we would implement this filter to minimise misallocation of CDS to the ‘present/putative orthologue’ class.
However, in the case of this aCGH analysis, as we note that probes to reference organism sequences that have little or no sequence identity to the comparator may still give very high hybridisation strengths/ratios, we wish preferentially to avoid misallocation of CDS to the ‘absent’ class. Therefore, we aim in effect to give each reference sequence every possible opportunity to be classified as ‘present’ as a putative orthologue in the comparator on the basis of RBH. Any remaining reference CDS that are classified as ‘absent’ - even though no restrictions are made on the basis of sequence identity or match overlap – have no reciprocal similarity by BLAST to any sequence in the comparator.
Microarray Data: Acquisition
Genomic DNA was extracted from bacterial cell cultures (,1010 cells) using the QIAGEN Genomic-tip 100/G (Qiagen) as recommended and labelling was performed using modified Bioprime DNA Labelling System (Invitrogen). Briefly, 2mg gDNA in 21ml was added to 20ml random primer reaction buffer mix and denatured at boiling for 5 min prior to cooling on ice. To this, 5ml modified 106dNTP mix (1.2 mM each of dATP, dGTP, dTTP; 0.6 mM dCTP; 10 mM Tris pH 8.0; 1 mM EDTA), 3ml of either Cy3 or Cy5 dCTP (1 mM) and 1ml Klenow enzyme was added and incubated for 16 h at 37uC. Labelled samples for each array were combined (if applicable) and unincorporated dyes removed using Qiaquick PCR Purification Kit (Qiagen) as recommended, eluting twice with 1650ml sterile water. Hybrid-isations and washing were performed as recommended (Agilent Protocol v5.5). Genomic DNA fromDda3937 was hybridised to a Pba1043-specific microarray (ArrayExpress: E-TABM-600; man-ufactured by Agilent, AMADID 012663) carrying 5219 unique probes that represent 4450/4472 annotated CDS from the Pba1043 genome [37,41]. Hybridisations were carried out in the presence of Pba1043 reference gDNA, Pcc193 reference gDNA and in the absence of a reference sample, and all hybridisations were replicated three times. Scanning was performed with an Agilent G2505B scanner using default settings and data extracted using Agilent FE (AGFE) software v9.5.3.
Microarray Data: Processing
Raw hybridisation data was imported using MatLab (http:// www.mathworks.com) from AGFE format output (Pba1043 array), and from GEO (Lactococcuscomparison data, entries: GSM229601, GSM229602, GSM229603, GSM229604) [13]. GEO entries 229602 and 229604 were found to have the labels for channel 1 and 2 inverted, and this was corrected in processing. Raw hybridisation data was corrected for background signal, log-transformed in base 2, then quantile-normalised. Median values were calculated for replicate probes on each array, and then between replicate arrays. Normalised hybridisation scores were associated with a RBH result for each CDS.
Gaussian Mixture Models
Two-dimensional Gaussian mixture models were fitted in MatLab to the paired hybridisation and RBH data using the gmdistribution.fit function. The optimal number of fitted Gaus-sians was estimated by the Bayesian Information Criterion (BIC), considering a maximum of ten Gaussians.
Threshold Models
Threshold models were implemented such that each CDS with a normalised array hybridisation score (or ratio) that fell below the threshold was classified as ‘absent’; those with a normalised hybridisation score above that value were classified as ‘present’. These Boolean states were used for validation of threshold models, and for training of HMMs. Threshold scores were taken at 100 evenly-spaced values between the lowest and highest observed values of hybridisation score (or ratio) for data exploration, and at all observed normalised threshold values (exhaustively to explore all partitions of the data) for rigorous comparisons with alternative models.
Hidden Markov Model (HMM) Construction
First-order hidden Markov models were trained using MatLab’s hmmestimate function, given the Boolean ‘present’/‘absent’ states derived from reciprocal best hit analysis ordered naturally along the reference genome as a ground truth, and Boolean ‘present’/ ‘absent’ states derived from the threshold models as observed emission states. The derived models represent the presence or absence of a putative orthologue in the comparator sequence as hidden states, in conjunction with the observed hybridisation score being above or below the corresponding normalised hybridisation score threshold, as the emitted states. The resulting models were used to obtain predicted hidden states from hybridisation data using the Viterbi algorithm implemented in MatLab’s hmmviterbi function, where input data were again ordered naturally according to probe location on the reference genome.
HMMs used in this study were trained separately on the RBH and hybridisation data for two comparisons: Pba1043 and Dda3937; andLactococcus lactissubspecieslactisIL1403 andcremoris MG1363 [13].
GACK and MPP
Model Validation
All predictive models were validated against the ground truth of reciprocal best hit results forPba1043vs Dda3937 or the twoLactococcus strains, as appropriate. All model output was obtained as Boolean ‘present’/‘absent’ states, and validation statistics were obtained for consistency tests using MatLab’s classperf function (http://www. mathworks.com/access/helpdesk/help/toolbox/bioinfo/ref/classperf. html). Predictions of the absence of a reference CDS in the comparator organism were taken to be ‘positive’ for statistical classification purposes. The optimal HMM and threshold models identified by the validation process were used for subsequent predictions onPba1039 andPcc193 hybridisation data.
Identification of Regions of Divergent Genome Composition
The software package alien_hunter was downloaded from http://www.sanger.ac.uk/Software/analysis/alien_hunter/ and used to identify regions of divergent genome composition, with recom-mended settings. This application implements an interpolated variable order motif method derived from the base composition of the chromosome to detect regions of nucleotide bias, and a second-order HMM for change-point detection [42].
Empirical Statistical Tests
Empirical statistical testing of the association of predicted genomic islands with regions of divergent genome composition as predicted by alien_hunter, and with regions of manually-annotated HGT, was carried out using the following procedure, implemented in a Python script.
The locations of genomic islands predicted by HMM, by alien_hunter, and detailed in the NC_004547 annotation were obtained. These were each considered to represent independent, non-overlapping genomic regions. The location of each of the alien_hunter and NC_004547 regions was shuffled one thousand times, to produce two sets of non-overlapping arrangements of each, representing a random distribution of the predicted islands. A count of the number of HMM-predicted genomic islands that overlapped with each of the shuffled sets was taken, as a measure of the expected number of overlaps that would be obtained if the islands were randomly placed on the genome. The observed count overlap count of the HMM predictions with the alien_hunter and annotated islands was tested for significance using a Z-statistic.
A similar procedure was followed for determining whether individual genes were located preferentially within predicted islands. In this case, the gene locations were taken as static, and genomic island predictions shuffled as non-overlapping regions 1000 times. A Z-statistic was again used to calculate significance of the count of genes observed to be coincident with predicted genomic islands.
Results
Reciprocal Best Hit Analysis Indicates That Approximately One Third of AllPba1043 CDS Are Absent in Dda3937
The genomes ofPba1043 andDda3937 have been sequenced and annotated [22] (https://asap.ahabs.wisc.edu/; v6b). CDS were defined to be common to both bacteria if a putative orthologue to a Pba1043 CDS could be found in the Dda3937 annotation. This was determined for each CDS at the amino acid level by reciprocal best FASTA protein match, and at the nucleotide level by reciprocal best BLASTN match [22]. Each reciprocal best hit (RBH) result was considered to be a putative orthologue (hereafter used interchangeably with ‘orthologue’) and,
as a direct and exhaustive sequence comparison, to be the best estimate of the presence or absence ofPba1043 CDS inDda3937 available for method validation. The results were used as both reference and training data for aCGH analysis algorithms, in a consistency test approach similar to that used in [4].
Of 4450 Pba1043 CDS represented by probes on the microarray, 451 were found to have RBH to Dda3937 at both nucleotide and amino acid sequence levels. In addition, 2369/ 4450Pba1043 CDS made RBH at the amino acid level only, and 7/4450 CDS only at the nucleotide level. ForPba1043 1623/4450 CDS therefore have no putative orthologue inDda3937, and it may be considered that approximately one third of thePba1043 genome is not common with Dda3937 (Figure S1). Very few Pba1043 CDS were found to be orthologous at the nucleotide, but not the protein level (a pattern suggestive of positive selection); however, many were orthologous at the protein, but not at the nucleotide, level (suggestive of neutral drift). The ‘core’ of CDS with both protein and nucleotide-level orthologues was found to comprise only around 10% of thePba1043 genome.
Array Hybridisation Intensities Have a Complex Relationship with Sequence Identity forPba1043 and Dda3937 Orthologues
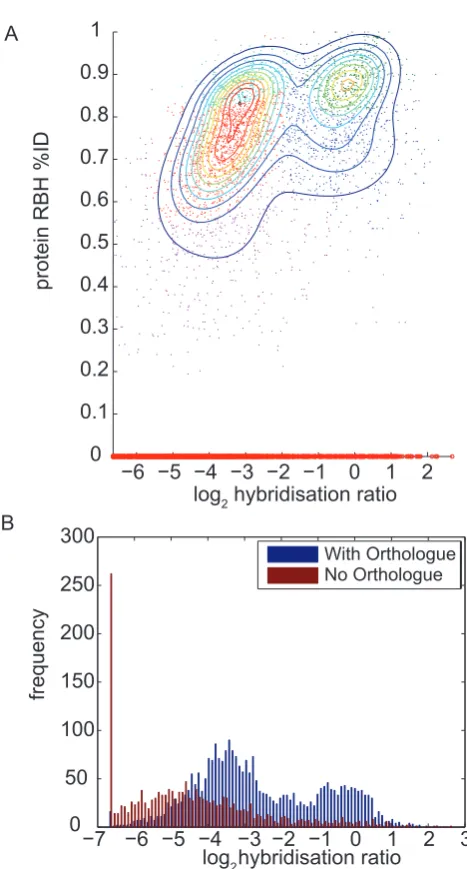
[image:4.612.318.553.438.621.2]Genomic DNA from Dda3937 was hybridised to a Pba 1043-specific microarray in the presence, independently, of Pba1043 reference gDNA and Pcc193 reference gDNA, and also in the absence of a reference sample. Three overlapping populations of raw hybridisation strengths were observed in each experiment (Figure 1). This pattern was similar to that observed in similar experiments [12], and comprised: a strongly-binding population of Pba1043 probes that bind to Dda3937 gDNA with hybridisation strength comparable to their binding toPba1043 gDNA; a weakly-binding population of probes with lower hybridisation strength to Dda3937 than toPba1043 gDNA; and a population with either no
Figure 1. Probability density function curves of log-trans-formed raw probe hybridisation intensities for the hybridisa-tion of Dda3937 gDNA to a Pba1043 microarray. Curves are plotted for hybridisation ofDda3937 gDNA in the absence of reference gDNA (red), and cohybridised withPba1043 reference gDNA (green), or cohybridised with Pcc193 comparator gDNA (blue). Three major populations of probe intensities are seen: strong hybridisation (intensity peak at approximately 14 log units), weak hybridisation (peaks at 8–10 log units), and very weak to no hybridisation (less than25 log units). Three replicates are indicated for each experiment.
detectable, or very weak, hybridisation to Dda3937 gDNA (Figure 1).
This observation does not support the assumption commonly made in aCGH analysis methods that there are two populations of probes in a typical experiment: ‘present’ and ‘absent or divergent’ [e.g. 3,8,11,15,16]. Notably, there is noa prioriindication that any of the three observed populations in Figure 1 comprise ‘present’, ‘absent’ or ‘divergent’ sequences.
A linear, or at least monotonic, relationship between the observed hybridisation score and the sequence identity of CDS in the reference and comparator organisms has previously been proposed or observed for aCGH experiments [13,43,44]. We did not observe such a relationship. Our data indicated a complex relationship between sequence identity and probe hybridisation affinity (or log ratio), from which three major populations of probes could readily be distinguished (Figure 2). Those probes representingPba1043 sequences that made RBH with greater than 30% amino acid sequence identity inDda3937 were considered here to be putative orthologues and therefore may only be classed as either ‘present’ or ‘divergent’, according to the scheme commonly used in aCGH analyses [e.g. 5,12,15,16]. The ‘absent’ sequence set in that scheme corresponds toPba1043 CDS with no putative orthologue in the comparator organism.
In the Pba1043:Dda3937 comparison, probes matching ortho-logous sequences could be resolved into two distinct populations on the basis of hybridisation strength using Gaussian mixture models, but not on the basis of their sequence identities (Figure 2A). In particular, the distribution of putative orthologues was bimodal with respect to hybridisation score or ratio, but was unimodal with respect to sequence identity. Sequence divergence was measured in terms of sequence identity, and it was not possible to distinguish between ‘present’ and ‘divergent’ orthologues using hybridisation data. The commonly-used ‘absent or divergent’ classification is the union of the sets of ‘absent’ and ‘divergent’ sequences; our data does not support this distinction between ‘present’ and ‘absent or divergent’ probe sets.
Those probes corresponding to Pba1043 CDS that were not found to have putative orthologues in Dda3937 (i.e. that are ‘absent’) were observed to have hybridisation ratios that ranged from no measurable hybridisation to very strong hybridisation, and to take values on the full range of hybridisation ratios spanned by both ‘present’ and ‘divergent’ CDS. The distribution of hybridisation ratios for probes representing putative orthologues overlapped to a great extent that of probes corresponding to CDS with no orthologue (Figure 2B).
Similar results were obtained for nucleotide sequence compar-isons, and for raw hybridisation scores (Figure S2). As can be seen from Figure S2, the observed relationship between sequence identity and hybridisation affinity is qualitatively almost identical whether obtained using hybridisation intensity (univariate) data, or hybridisation ratio (bivariate) data. The complexity of this relationship is therefore not due to the use of a log-ratio summary of the hybridisation signal.
Taken together, these results indicated that a distinction might reasonably be drawn between ‘putatively orthologous’ and ‘putatively non-orthologous’ CDS on the basis of aCGH, but not between ‘present’ and ‘absent or divergent’ CDS.
An Optimal HMM-Based Predictive Model Predicts Which Pba1043 CDS Have No Orthologue in Dda3937 Better Than an Optimal Threshold Model
[image:5.612.316.550.78.513.2]Analytical models for aCGH based on a single threshold that partitions CDS into ‘present’ and ‘absent or divergent’ classes have previously been shown to perform acceptably well under some
Figure 2. Scatterplot of RBH sequence identity and CDS count against hybridisation ratio.A) Scatterplot of putative orthologue (RBH) protein sequence identity against log-transformed probe hybridisation ratio for Dda3937 gDNA cohybridised with Pba1043 reference gDNA, for all probes. Sequences with no orthologue are allocated zero sequence identity. Probe population density contours derived from Gaussian mixture modelling are superimposed, and the corresponding Gaussian mixture components are distinguished by coloured points. Three major populations of probes are seen: a strongly hybridising population centred at hybridisation ratio 0 and %ID 0.87; a weakly-hybridising population at hybridisation ratio23 and %ID 0.82; andPba1043 sequences that have no putative orthologue (red points along the x-axis). Strongly- and weakly-hybridising probe sets each cover a range of sequence identities from 30% to 100%, and the probes representing sequences with no orthologues cover a range of hybridisation ratios from27 to 3. B) Bar plot of the count of CDS by hybridisation ratio, where CDS are divided into two classes: those with a putative orthologue (blue), and those without a putative orthologue (red), as found by RBH analysis. Both classes of CDS span a similar range of observed hybridisation ratios and overlap significantly. The set of CDS with no putative orthologue includes the majority of CDS in the lowest bin of hybridisation ratio.
circumstances [e.g. 5,44–46]. However, while the data obtained in this study did not support that particular interpretation of the partitioning of sequences, a threshold approach may still distinguish successfully between reference CDS that do and do not have a putative orthologue in the comparator organism.
The influence of horizontal gene transfer has been in many cases to introduce islands of genes whose collective function distinguishes the recipient organism from its close relatives, as part of the ‘accessory’ genome [5,9,22,38,39,47]. One notable influence of HGT on the reference genome is to confer collocation of transferred genes in that genome; such transferred genes may additionally be expected not to have an orthologue in a given comparator genome. In particular, it would be expected that, where a reference genome CDS has been acquired by HGT of a genomic island, it and its neighbours are less likely to have an orthologue in a comparator genome than another CDS randomly selected from the reference genome. Similarly, prokaryotic genes are frequently collected into operons, collocated groups of sequences that often work towards a common function. Loss of function may thus entail loss of a collocated set of genes. We implemented a HMM that exploits this anticipated collocation of sequences on the reference genome, particularly if they have no orthologue in the comparator, in the expectation that taking into account this spatial bias would improve predictive performance in the presence of data noise, and in marginal cases that are difficult to resolve with only a single threshold-based predictor. Such cases might include genes with an unexpected level of redundancy in the comparator organism, such as those with variable copy number due to representation on plasmids [5].
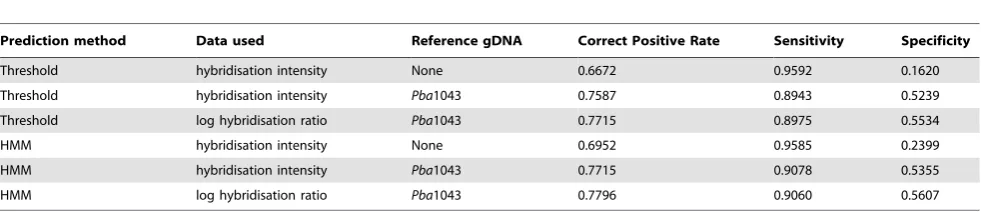
[image:6.612.64.555.614.720.2]Threshold and HMM models (as defined in Materials and Methods) were constructed for all hybridisation scores and ratios observed in each array experiment, exhaustively enumerating all such models that could be constructed from the data. All possible outcomes of each method were thus obtained, facilitating general claims concerning their performance on this data. In each experiment, a threshold model could be obtained that performed acceptably well when distinguishing betweenPba1043 CDS that do and do not have putative orthologues inDda3937. However, the optimally performing HMM outperformed the optimally performing threshold model on measures of correct prediction rate and specificity, in consistency tests for all such experiments (Table 1).
It was observed that HMMs and threshold models constructed from experiments involving reference gDNA performed significant-ly better than those constructed from experiments where no reference gDNA was used. Also, models built using log hybridisation ratios performed better than those derived from single-channel raw hybridisation scores (Table 1). Using log-transformed ratio data, the threshold and HMM predictors predicted that similar total numbers of CDS from Pba1043 did not have a putative orthologue in
Dda3937 (HMM: 1179; threshold: 1191;in silicoanalysis: 1630) but differed in their classification of 372 (approximately 30%) of these CDS. The predictions made by the two approaches differ qualitatively, rather than quantitatively (Figure 3). The HMM predictions appear to form larger contiguous islands of CDS on the genome, while the threshold method predicts a greater number of ‘orphan’ CDS with no orthologue whose immediate neighbours are predicted to have orthologues, and splits several large islands (confirmed as single islands byin silicosequence comparison) into several smaller fragments.
Additionally, the behaviour of each model is seen to differ as the hybridisation ratio threshold varies from the minimum to maximum observed value. Both models predict a mixture of CDS with and without orthologues in the comparator at low hybridisation ratios, but at high ratios the threshold model predicts that allPba1043 CDS are without an orthologue inDda3937. At high hybridisation ratio thresholds, the HMM assigns the majority state for the data to all CDS (Figure S3). Also, ‘blocks’ of contiguous sequences with no orthologue in the comparator persist to higher hybridisation ratios, using the HMM approach.
HMM-Based Predictors Validated onPba1043:Dda3937 andLactococcus lactisaCGH Data Perform Better Than GACK or MPP
Two packages for analysis of bacterial aCGH data are GACK (perhaps the most widely-used such application) and MPP, amongst a wide range of proposed alternative aCGH analysis algorithms [10,15,16,48–52]. Nearly all of these methods make the assumption that array probes partition into ‘present’ and ‘absent or divergent’ classes, and that these classes are unimodal. It was seen that this assumption is not met in the Pba1043:Dda3937 comparison but, as for the threshold-based classification, it is likely that these applications are able to segregate CDS fromPba1043 that do have orthologues inDda3937 from those that do not.
We applied GACK and MPP to the same log hybridisation ratio data for the Pba1043:Dda3937 comparison that was most informative for both the HMM and threshold methods above. In GACK it is possible to modify the required stringency of the prediction by varying a parameter representing ‘‘estimated probability of presence’’ (EPP). This may be set at values ranging from 0% - indicating an expectation of statistical ‘certainty’ that CDS predicted to have no orthologue in the comparator organism truly have no such orthologue - to 100% - indicating an expectation of statistical ‘certainty’ that CDS predicted to have an orthologue in Dda3937 truly do have such an orthologue. GACK was applied with EPP values of 0%, 50% and 100%, in binary prediction mode. With these settings, GACK predicted that 84 (0% EPP), 344 (50% EPP) or 595 (100% EPP) CDS from Pba1043 have no putative orthologue inDda3937 (Figure S4).
Table 1.Consistency test validation statistics forPba1043:Dda3937 aCGH comparisons.
Prediction method Data used Reference gDNA Correct Positive Rate Sensitivity Specificity
Threshold hybridisation intensity None 0.6672 0.9592 0.1620
Threshold hybridisation intensity Pba1043 0.7587 0.8943 0.5239
Threshold log hybridisation ratio Pba1043 0.7715 0.8975 0.5534
HMM hybridisation intensity None 0.6952 0.9585 0.2399
HMM hybridisation intensity Pba1043 0.7715 0.9078 0.5355
HMM log hybridisation ratio Pba1043 0.7796 0.9060 0.5607
Figure 3. Predictions of putative orthology for aCGH comparisons.Predictions of putative orthology for thePba1043:Dda3937 aCGH comparison using log-transformed hybridisation ratios, for both threshold (left) and HMM (right) methods, compared to the locations of known orthologues obtained byin silicocomparison (centre). CDS are in genomic order from top to bottom of the figure, and black bars indicate CDS from Pba1043 with no orthologue inDda3937. For thein silicocomparison, a brighter copper tone indicates greater sequence identity for that orthologue. The threshold and HMM results are similar, and broadly consistent with each other and thein silicoanalysis. The two prediction methods differ qualitatively in that the HMM method tends to predict larger contiguous islands of CDS with no orthologue than the threshold method, which predicts a greater number of CDS ‘orphans’, as illustrated by the inset that expands the region surrounding HAI2. This region contains the coronafacic acid synthesiscfagene cluster. The RBH comparisons for this island indicate two putative orthologues inPba1043 andDda3937, effectively breaking the island into three smaller islands. The threshold method identifies five larger contiguous putative shared CDS, dividing the island into six smaller regions. The HMM method identifies the island as a single large contiguous region, with no breaks.
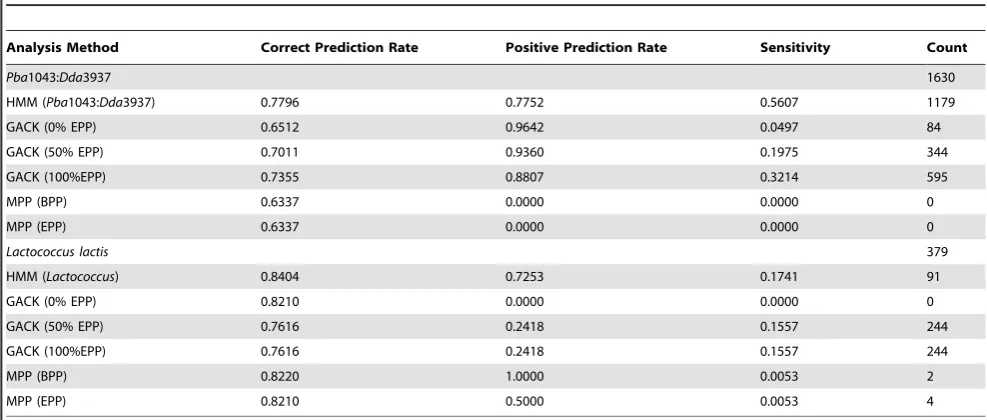
MPP with default settings predicted that noPba1043 CDS were without a putative orthologue inDda3937 – the majority state - and thereby achieved a correct prediction rate of 0.65. Although GACK obtained a correct prediction rate of 0.75 at 100% EPP, its sensitivity was very low and, unlike the threshold and HMM methods, neither GACK nor MPP identified a substantial proportion of the 1630 Pba1043 CDS that do not have an orthologue in Dda3937. Validation statistics for these analyses are shown in Table 2, and indicate that the HMM outperformed both GACK and MPP on the Pba1043:Dda3937 comparison in terms of sensitivity and total number of correct predictions, although GACK obtained better positive predictive rates at the expense of much reduced sensitivity. It is possible that the less impressive performance of GACK and MPP observed for the Pba1043:Dda3937 comparison was due to the relatively large evolutionary distance between these organisms, or to the particular array configuration used in these experiments (see Discussion). Most aCGH studies have hitherto focused on variation at the subspecies level, and this is the domain on which GACK and MPP have previously been and, it was assumed, were intended to be, applied [5,9,13,15,16]. In order to compare the performance of the HMM to GACK and MPP on a comparison of sequenced bacteria with a more recent common ancestor, data for aCGH between Lactococcus lactis subspecies lactis IL1403 and cremoris MG1363 [13], employing an alternative array platform, was obtained from the GEO public repository. The HMM approach again outperformed both GACK and MPP in terms of sensitivity, correct positive rate, and positive predictive rate on this comparison data (Table 2). Although GACK more closely approximated the number of non-orthologous sequences in its predictions, its false positive rate was found to be rather high.
Comparison of HMM-Based, GACK and MPP Model Performance onPba1043:Pcc193 andPba1043:Pba1039 Data
Pcc193 and Pba1039 gDNA was hybridised to the Pba 1043-specific microarray, in separate experiments, usingPba1043 gDNA as the reference in each. The distribution of log hybridisation ratios was found to be approximately unimodal in both cases, reflecting the relatively close evolutionary relationship between these organisms (data not shown).
MPP, with default settings, was unable to fit curves to the hybridisation data from thePba1043:Pcc193 experiment, and so its performance was not further assessed. The HMM trained on Pba1043:Dda3937 comparison data predicted that 440 Pba1043 CDS have no orthologue inPcc193. GACK predicted that between 1187 (EPP: 0%) and 1846 (EPP: 100%)Pba1043 CDS have no orthologue inPcc193. As noted earlier,in silicosequence compar-isons indicated that 1643 Pba1043 CDS have no orthologue in Dda3937, whose most recent common ancestor withPba1043 is more ancient than that ofPba1043 andPcc193. It would therefore be expected that morePba1043 CDS would have orthologues in Pcc193, than inDda3937. This implies that the GACK prediction for thePcc193 comparison at 100% EPP is an overprediction. There was also a large discrepancy between the prediction count from HMM and the most conservative GACK prediction at 0% EPP, in that GACK predicted nearly three times as many CDS to be without an orthologue inPcc193 than did the HMM.
ThePba1043:Pba1039 comparison experiment was a comparison between reference and comparator organisms at the strain level. The HMM built from the Pba1043:Dda3937 comparison data may be inappropriate for analysis of more closely-related organisms, and so the second HMM, trained separately on theLactococcuscomparison data, was also tested. MPP predicted that 299Pba1043 CDS have no orth-ologue inPba1039, and GACK predicted between 335 (EPP: 0%) and 637 (EPP: 100%) such CDS. The HMM built on the more divergent Pba1039:Dda3937 comparison predicted 198, and the HMM built on the more recently-divergedLactococcuscomparison predicted 255 such CDS. The variation in prediction totals between the HMMs built on the two distinct comparisons is not as great as the variation between the HMM predictions and those made by GACK and MPP, and the predictions made by the HMMs are each in close agreement, implying that the HMM approach is reasonably robust to training set variation, independent of the organism on which it was trained (Figure S5).
[image:8.612.61.555.511.721.2]While no genome sequences were publicly available at the time of submission to validate these particular predictions, some trends may be inferred from this data. GACK appeared to predict a greater number of CDS to be absent than did the HMM. This behaviour, which potentially results in an increase in sensitivity at the expense of specificity, has previously been reported by other groups [e.g. 5]. Qualitatively, both GACK and MPP predicted a greater proportion
Table 2.Statistics for validation of aCGH analytical methods onPba1043:Dda3937 andLactococcuscomparisons.
Analysis Method Correct Prediction Rate Positive Prediction Rate Sensitivity Count
Pba1043:Dda3937 1630
HMM (Pba1043:Dda3937) 0.7796 0.7752 0.5607 1179
GACK (0% EPP) 0.6512 0.9642 0.0497 84
GACK (50% EPP) 0.7011 0.9360 0.1975 344
GACK (100%EPP) 0.7355 0.8807 0.3214 595
MPP (BPP) 0.6337 0.0000 0.0000 0
MPP (EPP) 0.6337 0.0000 0.0000 0
Lactococcus lactis 379
HMM (Lactococcus) 0.8404 0.7253 0.1741 91
GACK (0% EPP) 0.8210 0.0000 0.0000 0
GACK (50% EPP) 0.7616 0.2418 0.1557 244
GACK (100%EPP) 0.7616 0.2418 0.1557 244
MPP (BPP) 0.8220 1.0000 0.0053 2
MPP (EPP) 0.8210 0.5000 0.0053 4
of ‘orphan’ CDS, while the HMM favoured prediction of islands of CDS with no orthologue in the comparator (Figure S5). This may be a more biologically appropriate prediction mode.
We observed apparent overprediction, combined with reduced sensitivity and diminished correct positive prediction rates for the GACK and MPP methods, in comparison to the HMM approach. We also found that variation in results between HMMs built on alternative training sets is minor. Thus we proceeded to consider the biological implications of aCGH results obtained for thePectobacterium andDickeyaspecies investigated, using only results obtained using the HMM analysis model built from thePba1043:Dda3937 comparison.
The HMM-Based Predictive Model Predicts Genomic Islands in Pba1043 That Correspond to Putative Pectobacterium atrosepticum-Specific and Pectobacterium-Specific ‘Accessory’ Genomes
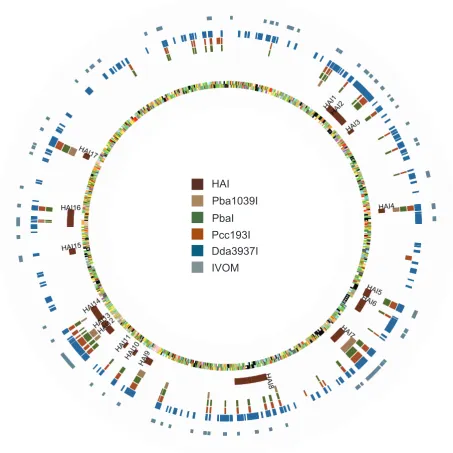
HMM analysis predicted 165 islands (1179 CDS) fromPba1043 to have no orthologues inDda3937, 60 islands (440 CDS) to have no orthologues inPcc193, and 17 islands (198 CDS) to have no orthologues in Pba1039. This method also identified 16 islands (169 CDS) that were unique to Pba1043 only, and a further 40 islands (231 CDS) to be present only inPba1043 andPba1039. The count of genomic islands and CDS with no orthologue in the comparator diminished as the evolutionary distance from the last common ancestor ofPba1043 to the comparator decreased. These islands are illustrated in Figure 4 and Figure S6, and described in detail in Tables S1, S2, S3, S4 and S5.
We considered those CDS that are present inPba1043 but that do not have orthologues in the most recently diverged organism in this study:Pba1039, to reflect either recent acquisitions inPba1043 or recent losses inPba1039. These CDS are a putativePba 1043-specific ‘accessory’ genome, and mostly comprise hypothetical proteins and phage-related sequences, located in 17 islands on the Pba1043 genome (Table S1; islands prefixed Pba1039I).
Fifty-six islands ofPba1043 CDS were predicted to be present only inPba1043, or to be common to bothPbastrains, but not to have orthologues in eitherDda3937 orPcc193. These are likely to represent genes encoding functions that biochemically distinguish Pbafrom its near evolutionary relatives. Such sequences included CDS encoding coronafacic acid synthesis (cfa), phenazine antibiotic synthesis (ehp), and various multidrug resistance genes. Several of these CDS, in particular those for the synthesis of coronafacic acids (CFA) have also previously been shown experimentally to contribute to virulence in Pba1043 [22]. These CDS were predicted to be components of the putative Pba-specific ‘accessory’ genome, and some examples are summarised in Table 3. A substantial minority of these CDS were annotated only as hypothetical proteins in their public sequence database submissions (Table S2).
One-hundred and sixty-eight islands of Pba1043 CDS were predicted to have orthologues in bothPcc193 andPba1039 but not in Dda3937, and thus represent a putative Pectobacterium-specific accessory genome. These islands are expected to include genes encoding functions that distinguish pectobacteria from Dickeya spp., and were found to contain CDS encoding PCWDE (peland peh), a syringomycin-like NRPS (syr), siderophore biosynthesis (pvc) and octopine transport (occ).
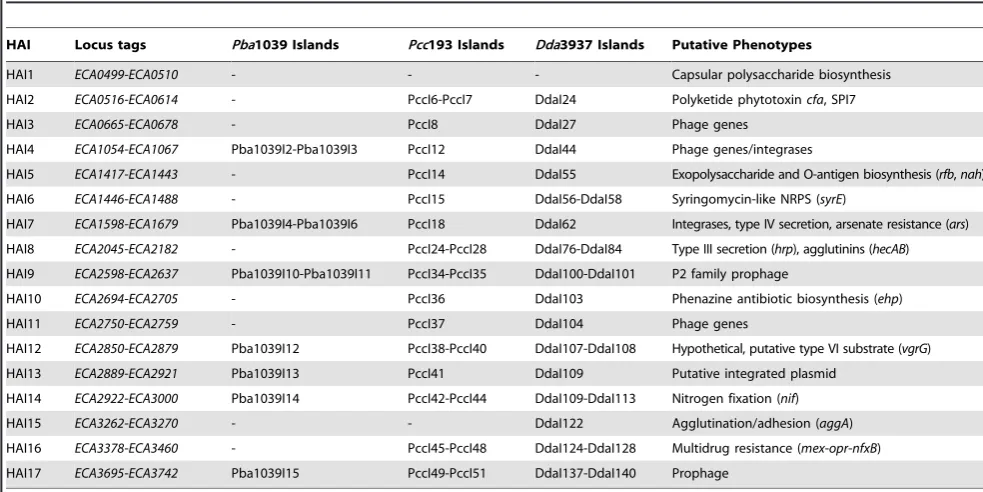
Sixteen of Seventeen Previously Annotated, Horizontally Acquired Islands fromPba1043 Are Coincident with Islands of CDS with No Predicted Orthologue inPcc193 and/orDda3937
Seventeen putative horizontally acquired islands (HAI1-HAI17) were identified in manual curation of thePba1043 genome on the
basis of evidence such as divergent base composition and the presence of flanking insertion sequences [22]. Of these, all but HAI1 coincided with at least one island identified by aCGH, and most include genes with putative or demonstrated roles in pathogenesis and niche adaptation [38] (Table 4).
Two of these islands, HAI1 (capsular polysaccharide biosyn-thesis) and HAI15 (type I secretion) were predicted to be entirely or substantially conserved in all organisms examined in this study. If the shared presence of each of these two islands is the result of horizontal gene transfer, then the most parsimonious inference is that acquisition occurred in a common ancestor of all three species, rather than as independent transfer events in each organism.
Two HAIs were predicted to have substantial orthologues only within the pectobacteria: the portion of HAI2 that is homologous with the SPI-7 pathogenicity island (PAI) flanking the coronafacic acid synthesis genes (thecfagenes themselves have no orthologues in Pcc193), and HAI6, which encodes a syringomycin-like NRPS. A parsimonious explanation for this distribution might be that these islands were acquired after the divergence of Dickeya and Pectobacteriumspp. but before the divergence ofPccandPbaspecies; alternatively, there may have been loss of these islands in theDickeya lineage. However, the PAI itself has been observed in several unrelated bacterial genomes, and found to contain multiple alternative functional ‘payloads’ in those cases [53,54]. As the PAI genes, but not theircfa ‘cargo’ were predicted to be present in Pcc193, it may be that there has been independent acquisition of this sequence inPbaandPcc, carrying alternative payloads in each case. This may be determined by sequencing of that region inPcc193.
Similarly, five HAIs (HAI3, HAI5, HAI10, HAI11 and HAI12) were found only in the twoPba strains either substantially, or in their entirety (Table 4; Table S2). These are expected to have been acquired after the divergence ofPba fromPcc. Amongst the gene functions carried by these HAIs are lipopolysaccharide biosynthe-sis (rfb) and phenazine antibiotic synthesis (ehp).
A further five HAIs (HAI4, HAI7, HAI9, HAI13, and HAI17) appeared to be substantially or entirely unique toPba1043, but these almost exclusively encode for phage-related sequences, and hypothetical proteins. These were presumably recently acquired, subsequent to the divergence of strain SCRI1043 from strain SCRI1039.
HAI14, which putatively encodes nitrogen fixation function, is anomalous in that it was predicted to have a substantial number of orthologues in bothPbastrains, and inDda3937, but to have far fewer orthologues inPcc193. The most parsimonious explanation for this distribution is that the common ancestor ofDickeya and Pectobacterium possessed this capability for nitrogen fixation, and that this has been progressively lost in the Pcc193 lineage. Alternatively, nitrogen-fixing ability may have been acquired independently in bothDickeyaandPbalineages.
PredictedPba1043-Specific Genomic Islands Are Associated with Regions of Divergent Genome Composition
The software package alien_hunter [42] was used to identify regions of putative HGT in the Pba1043 chromosome. An empirical statistical method was used to determine whether there was a significant association between Pba1043 CDS without predicted orthologues in each comparator species and regions of putative HGT as predicted by alien_hunter.
Pba strains (Z-score: 9.08, P,0.0001); 256/440 Pba1043 CDS predicted to have no orthologue in Pcc193 (Z-score: 8.47, P,0.0001); and 463/1179 CDS predicted to be have no orthologue inDda3937 (Z-score: 9.03, P,0.0001). This indicates a significant tendency forPba1043 CDS that are predicted to have no orthologue in one or more comparator organisms to be located within the regions of divergent base composition predicted by alien_hunter. This is consistent with the hypothesis that the composition of the ‘accessory’ genome of Pba1043 is greatly influenced by horizontal gene transfer.
[image:10.612.64.518.68.522.2]A similar statistically significant association of predicted islands of CDS inPba1043 predicted to have no orthologue in at least one comparator organism was observed with predicted regions of putative HGT identified by alien_hunter. In total, 11/16 (Z-score: 3.86, P,0.0001) Pba1043-specific islands; 32/56 (Z-score: 6.29, P,0.0001) Pba-specific islands; 32/60 (Z-score: 5.72, P,0.0001) islands predicted to have no orthologue inPcc193; and 50/165 (Z-score: 2.39, P,0.01) islands predicted to have no orthologue in Dda3937 were found to overlap with the regions of putative HGT identified by alien_hunter.
Figure 4. Circular diagram ofPba1043, indicating predicted genomic islands.Circular diagram indicating, on the chromosome ofPba1043, the locations of annotated horizontally-acquired islands (HAI); aCGH predictions ofPba1043 genomic islands that do not have orthologues in Pba1039 (Pba1039I),Pcc193 (PccI), orDda3937 (DdaI), or that are present only inPbastrains (PbaI); and predictions of divergent base composition made by alien_hunter (labelled as IVOM). Chromosome features are coloured by functional classification. Predicted HAIs coincide with many of the aCGH-predicted islands that themselves coincide with the predictions of divergent base composition made by alien_hunter. TheDdaI islands are numerous and distributed in clusters around the chromosome. Most islands not predicted to be found inPcc193 are also not predicted to be found in Dda3937. The diagram was constructed using GenomeDiagram [71].
It is particularly notable that nearly three-quarters of all Pba1043-specific islands also overlapped at least one region of divergent base composition predicted by alien_hunter. This is consistent with the proposal that these islands have been acquired
[image:11.612.64.556.78.374.2]through lateral gene transfer subsequent to divergence ofPba1043 andPba1039 from their most recent common ancestor, suggesting a dynamic genome plasticity that persists and distinguishes betweenPbastrains [22].
Table 3.Predicted genomic islands of potential functional importance.
Island Locus tags Genomic location Putative phenotype, and representative genes
PbaI5 ECA0487-ECA0491 563151-567396 phosphonate metabolism (fom1,fom2,phnG)
PbaI7 ECA0600-ECA0610 659712-682903 coronafacic acid synthesis (cfa1-8B,cfl)
PbaI13 ECA1420-ECA1441 1611940-1636204 polysaccharide and O-antigen synthesis (rfb,nah) PbaI14 ECA1477-ECA1481 1673637-1678411 transcriptional regulators
PbaI22 ECA2068-ECA2073 2355814-2362568 permease and transporter
PbaI27 ECA2294-ECA2295 2599459-2602654 glycosyl transferase
PbaI33 ECA2693-ECA2705 3028797-3040751 polyketide synthase, phenazine synthesis (ehpA-G,ehpR)
PbaI39 ECA2933-ECA2936 3278434-3281122 nitrogen fixation (nifQ)
PbaI41 ECA2972-ECA2982 3322878-3332514 multidrug efflux (emrE)
PbaI44 ECA3446-ECA3450 3865038-3872587 multidrug efflux (oprJ,mexBC,nfxB) PbaI55 ECA4452-ECA4455 4993334-5000237 hemin storage (hms)
PectoI7 ECA0149-ECA0163 169392-186544 lipopolysaccharide synthesis (waa)
PectoI25-27 ECA0516-ECA0615 590843-689677 mobile element (SPI7-like)
PectoI50 ECA1089-ECA1107 1217226-1255583 cell wall enzymes (pel3, pehA), Type I secretion
PectoI61 ECA1485-ECA1490 1680732-1681461 syringomycin-like non-ribosomal peptide synthase (syrE)
PectoI82 ECA2111-ECA2118 2398202-2426503 type III effectors (dspE, hrpW), agglutinins (hecAB) PectoI96 ECA2430-ECA2438 2744003-2745227 virulence regultors (rdgAB)
PectoI122 ECA3116-ECA3122 3478243-3490068 type I restriction
PectoI129 ECA3370-ECA3387 3786824-3801913 pyoverdine biosynthesis (pvc) PectoI151 ECA4078-ECA4084 4546706-4554057 octopine transport (occQMP)
PectoI153 ECA4109-ECA4119 4579773-4594107 siderophore synthesis / receptor
doi:10.1371/journal.pcbi.1000473.t003
Table 4.Horizontally acquired islands (HAI) previously identified inPba1043.
HAI Locus tags Pba1039 Islands Pcc193 Islands Dda3937 Islands Putative Phenotypes
HAI1 ECA0499-ECA0510 - - - Capsular polysaccharide biosynthesis
HAI2 ECA0516-ECA0614 - PccI6-PccI7 DdaI24 Polyketide phytotoxincfa, SPI7
HAI3 ECA0665-ECA0678 - PccI8 DdaI27 Phage genes HAI4 ECA1054-ECA1067 Pba1039I2-Pba1039I3 PccI12 DdaI44 Phage genes/integrases
HAI5 ECA1417-ECA1443 - PccI14 DdaI55 Exopolysaccharide and O-antigen biosynthesis (rfb,nah)
HAI6 ECA1446-ECA1488 - PccI15 DdaI56-DdaI58 Syringomycin-like NRPS (syrE)
HAI7 ECA1598-ECA1679 Pba1039I4-Pba1039I6 PccI18 DdaI62 Integrases, type IV secretion, arsenate resistance (ars)
HAI8 ECA2045-ECA2182 - PccI24-PccI28 DdaI76-DdaI84 Type III secretion (hrp), agglutinins (hecAB)
HAI9 ECA2598-ECA2637 Pba1039I10-Pba1039I11 PccI34-PccI35 DdaI100-DdaI101 P2 family prophage
HAI10 ECA2694-ECA2705 - PccI36 DdaI103 Phenazine antibiotic biosynthesis (ehp)
HAI11 ECA2750-ECA2759 - PccI37 DdaI104 Phage genes
HAI12 ECA2850-ECA2879 Pba1039I12 PccI38-PccI40 DdaI107-DdaI108 Hypothetical, putative type VI substrate (vgrG)
HAI13 ECA2889-ECA2921 Pba1039I13 PccI41 DdaI109 Putative integrated plasmid HAI14 ECA2922-ECA3000 Pba1039I14 PccI42-PccI44 DdaI109-DdaI113 Nitrogen fixation (nif)
HAI15 ECA3262-ECA3270 - - DdaI122 Agglutination/adhesion (aggA)
HAI16 ECA3378-ECA3460 - PccI45-PccI48 DdaI124-DdaI128 Multidrug resistance (mex-opr-nfxB) HAI17 ECA3695-ECA3742 Pba1039I15 PccI49-PccI51 DdaI137-DdaI140 Prophage
[image:11.612.61.553.475.721.2]Several Predicted Genomic Islands Are Enhanced for CDS with Reciprocal Best Hits in Plant-Associated Bacteria, But Not in Animal-Pathogenic Enterobacteria
Each CDS in thePba1043 chromosome was classified according to whether a putative protein orthologue was found in completely sequenced plant-associated bacteria (PAB), or in completely sequenced animal-pathogenic enterobacteria (APE) [38]. Those CDS that have at least one such orthologue in PAB, but none in APE were considered potentially to encode a biochemical function that is useful to a plant-associated lifestyle, but likely not to an animal-associated lifestyle. A similar inference may be drawn for CDS for which thePba1043 sequence shares significantly greater identity with its most similar PAB orthologue than it does with the APE orthologue. As Pba1043 shares a more recent common ancestor with APE such asYersiniaspp. andE. colistrains, such a distribution of orthologous sequences may also imply acquisition by HGT.
An empirical statistical test was performed to determine whether genomic islands inPba1043 identified by aCGH were enhanced for such CDS. A significant enhancement was seen for 6/56Pba -specific islands, 6/60 islands with no orthologue inPcc193, and 9/ 165 islands with no orthologue inDda3937 (all tests Z-score.3.0; P,0.001; Table S6). These islands may therefore represent functions that are not only likely to have been acquired by lateral gene transfer, but may also be specific to a plant-associated, and not a generalist or animal-associated, lifestyle. Islands identified in this way include PbaI7, which contains genes that encode for coronafacic acid synthesis, and also a number of hypothetical proteins (see Discussion).
This partitioning of sequences between ‘core’ and ‘accessory’ regions of the bacterial genome, such that variable regions are enhanced for strain- or niche-specific functions has also been observed for other pathogenic bacteria, includingP. syringae[9,39], and appears to be a common strategy for the evolution of these organisms.
Discussion
Array CGH Does Not Necessarily Distinguish between ‘Present’ and ‘Absent or Divergent’ Sequences in a Comparator Organism
Microarray comparative genomic hybridisation (aCGH) is a valuable technique for rapidly, and relatively inexpensively, obtaining comparative genomic data for bacterial strains in a high-throughput manner. However, aCGH has inherent limitations that restrict the applicability of the method, and the information that can be obtained. Foremost is that an aCGH experiment is only able to identify which reference probe sequences do or do not hybridise well to gDNA from a comparator organism. In particular, aCGH is unable positively to identify sequences that are present in the comparator gDNA but that are absent from the reference or otherwise unrepresented in the probe set. Thus aCGH is unable to reflect sequences that are unique to the comparator organism. This may be overcome to some degree by the use of arrays that contain probes not only to the reference organism, but also to other related organisms, as proposed in [5]. Here, the wider the scope of the probes beyond the reference organism alone, the greater is the theoretical coverage of sequences that may be present in the comparator, but not in the reference organism. However, sequences that are unique to the comparator still cannot be disclosed by this approach unless they are present on the array.
It is commonly assumed that aCGH cannot distinguish between sequences that are absent in the comparator gDNA, and those that
are merely sufficiently divergent that they cannot hybridise to the array probe set [5,8, etc]. However, to some degree these classifications are indistinguishable, as the statement that a sequence is ‘absent’ in a comparator can be equivalent to the statement that there no significant sequence similarity. The use of ‘divergent’ as a classifier is ambiguous and potentially misleading in these circumstances. It is also commonly assumed that the assessment of ‘absence or divergence’ reflects overall sequence similarity, and that a relationship between hybridisation and sequence similarity holds for intermediate levels of sequence identity, such that intermediate hybridisation strengths reflect an intermediate degree of sequence identity [13]. An important observation made in [44] was that, even for closely-related sequenced strains ofCamplylobacter jejuni, the log ratio of each probe was not sufficient to make a positive prediction of percentage sequence identity. We confirm and extend this observation for SRE with Agilent arrays.
It is often intuitively expected that microarray probes will hybridise to comparator gDNA with a reduced signal, where the comparator sequence is not identical with its homologue in the reference. In all aCGH experiments hybridisation strength is a measurement taken at the reference probe and not across the full length of the sequence from either organism, unless the probe covers the full length of the sequence. Where sequence identity is not homogeneous across the full length of the sequence, or there is similarity between the probe and a non-homologous sequence, this expectation may break down. A comparable break down may occur if there is the possibility of a confounding interaction between hybridising reference and comparator gDNA to a probe. Circumstances in which sequence divergence at the probe hybridisation site is not representative of the overall divergence across the sequence are highly likely to occur, and even under the most favourable circumstances it is only possible to refer to the apparent absence or divergence of sequences in the comparator organism.
Most published approaches to interpretation of aCGH data assume that probes which hybridise strongly to comparator gDNA represent sequences that are present in the comparator organism, while those probes that do not hybridise well represent sequences that may be either absent or divergent in the comparator [e.g.13,15,16]. By careful analysis of aCGH data for bacteria with complete genome annotations, we have established that this reasoning, while intuitively plausible, may lead to erroneous conclusions. Our data support only a distinction between those sequences that are, and those that are not, orthologous in the comparator organism. In particular they do not support a distinction between putatively orthologous sequences in terms of their degree of sequence identity, using aCGH hybridisation data. That is, the two sets of putatively orthologous sequences that would be classified as ‘present’ or merely ‘divergent’ could not be distinguished by us in terms of their hybridisation scores or ratios, and therefore the two classes of ‘present’ and ‘divergent or absent’ sequences could also not be distinguished.
hybridisation drawn using a particular array technology do not necessarily hold for alternative technologies. Measurement and validation of this relationship is essential for correct interpretation of aCGH data, and should be performed for each array platform.
Hybridisation binding strength or ratio data may also be interpreted in terms of a thermodynamic model of probe binding to the comparator organism gDNA, as an alternative to our interpretation in terms of percentage sequence identity. This is a useful technique when applied to resequencing of strains that are very closely related to the reference, as deviations in hybridisation strength may be accommodated within the thermodynamic model, and sequence differences inferred from observed binding affinities, in terms of that model; it may thus be a better approximator to hybridisation strength than is sequence identity. However we do not use it here as our aim is to infer putative orthology, defined in terms of sequence identity, from hybridisation data. The appropriate measure of putative orthology in this case is sequence identity, and not inferred sequence composition based on a model of the thermodynamic properties of probe binding. An interpretation of measured hybridisation in terms of sequence identity, validated on known sequence data, is therefore the most direct and appropriate approach for this study. Also, a typical bacterial aCGH experiment may involve a comparator organism that displays considerably greater divergence than that which would normally be considered for resequencing or other circumstances in which a thermodynamic model would usually be applied. For example, in our genus-level method validation only 807/10280 (less than 10%) ofPba array probes make a best match (with BLASTN) to theDdagenome that covers the probe to within 5 bp of its length. This significant divergence is likely to induce significant uncertainty, and therefore additional error, in the relationship between base composition as inferred from a thermodynamic model, and the subsequent assignment of putative orthology.
The HMM Predictor Robustly Extends the Working Range of aCGH Analysis to Comparison of Bacteria at the Genus Level
Array CGH has previously been applied, in the main, to closely related organisms; in bacteria, this has usually involved comparisons at the intra- or inter-species level [e.g.5,6,7,9,13,45,46,48,56]. In principle, as hybridisation affinity is expected to be influenced by sequence identity, and not by schemes of systematic classification, it should be possible to extend the technique with some success to comparisons between organisms with a more ancient last common ancestor. In particular, DNA-DNA hybridisation studies of Pba1043, Pcc193 andDda3937, 16S rRNA analysis and phyloge-netic considerations (data not shown) indicate genome-wide sequence similarity that justifies the use of aCGH to compare the genome complements of these organisms. In this study, we successfully applied our analysis method to comparison data for Pba1043 andDda3937: bacteria that differed at the genus level.
Normalisation Methods for aCGH
It has been noted by other groups that a high degree of sequence divergence between prokaryotes may obstruct aCGH approaches, on the grounds that no strong assumption may be made concerning the distribution of hybridisation ratios for a Lowess normalisation step. Extension of aCGH to more distant comparisons has previously been attempted by modification of the normalisation method used on the array data, such as supervised Lowess (S-LOWESS) [5,13]. However, we note that Lowess and many other array normalisation methods employ a null hypothesis which assumes that, for a significant proportion of probes, the
hybridisation strengths of reference and comparator sequences are random variables drawn from the same distribution. This is a reasonable assumption when applied to isogenic data, such as bacterial mutants, these normalisation operations preserve differ-ences in transcriptional expression while reducing systematic error, as the applied correction of normalisation is valid for the great majority of probes. It is not such a reasonable assumption for aCGH.
Normalisation methods such as Lowess may be useful for aCGH, on the condition that the reference and comparator diverged sufficiently recently, as the proportion of probes that do not conform to the underlying assumptions is likely to be small. This restricts the applicability of aCGH when using these normalisation approaches. However, in cases where the reference and comparator organisms do not share such a recent common ancestor, as for thePba1043:Dda3937 comparison in which a strict majority of CDS do not have identifiable nucleotide RBH between the organisms (Figure S1), the underlying assumptions of Lowess normalisation fail for the majority of probes.
Subset modifications of Lowess have proven effective on within-species strain comparisons, but require the prior identification of conserved genes, and the assumption that the derived correction is applicable even to the majority of divergent sequences [5,13]. Therefore in this study we used the nonparametric normalisation method of quantile normalisation (QN) to correct for systematic errors. QN requires no prior assumptions concerning the relatedness of reference and comparator sequences, and specifi-cally makes no assumptions relating to sequence conservation. QN asserts only that the distribution of probe strengths is comparable across replicate arrays, which was established for our data in Figure 1.
The results of our consistency test validation indicate that measures of prediction quality for the interspeciesPba1043:Dda3937 comparison, though lower than that for the interstrainLactococcus comparison, remain acceptable.
The HMM aCGH Analysis Method Performs Better than GACK, MPP and Threshold Methods
Table 2 demonstrates that the HMM analysis method described in this paper outperforms GACK, MPP and threshold methods in identifying correctly those CDS in Pba1043 that do not have orthologues inDda3937, and also those CDS inL. lactisMG1363 that do not have orthologues in IL1403. The consistency test of performance on thePba1043:Dda3937 comparison suggests that GACK has a tendency to overpredict the number of reference sequences that have no orthologue in the comparator, which supports previous observations made using this method [5].