Int. J. Electrochem. Sci., 14 (2019) 5226 – 5236, doi: 10.20964/2019.06.21
International Journal of
ELECTROCHEMICAL
SCIENCE
www.electrochemsci.org
Short Communication
A Novel Meshing and Calculating Method for Studying the
Effect of Irregular Microstructure on the SOFC Composite
Electrode Performances
S. Su1, C. Yan1, A. Kukolin1,2, D. Chen1,*
1 School of Energy and Power, Jiangsu University of Science and Technology, Zhenjiang 212003,
China;
2 Institute of Mechanics and Energy, Ogarev Mordovia State University, Saransk 430000,Russia *E-mail: [email protected]
Received: 5 February 2019 / Accepted: 15 March 2019 / Published: 10 May 2019
Porous composite electrode is the core component of the solid oxide fuel cell (SOFC) to support the high electrochemical performance; and there are many strict functional requirements, such as the flow diffusivity, three phase boundary sites, ionic and electronic conductivities, thermal conductivity and so on. These are generally considered to greatly depend on the detail microstructure morphology of the electrodes. In the past decades, many theories basing on homogeneous medium hypothesis (i.e., percolation theory) have been developed to study the dependence of effective electrode properties on the microstructure parameters. However, these models neglect the influence of the irregular microstructure details. Although the numerical simulation approach can directly mesh the complex electrode structure to consider the influence of irregular microstructure details, this conventional method can only deal with a very small calculating zone due to the very large calculation ability requirement. In this paper, a novel approach that using regular meshes with irregular properties distribution information is firstly proposed to deal with the influence of the irregular microstructure details. Then, the calculated results based on the proposed method are compared with that obtained by the conventional method to well illustrate the validation of this novel approach.
Keywords: Solid oxide fuel cell; Irregular microstructure morphology; Numerical simulation; Porous composite electrode
1. INTRODUCTION
these typical electrochemical power devices that directly converts the chemical energy of fuels into electrical energy through electrochemical half reactions [6]. Because of the high energy conversion efficiency and flexible fuel selections (i.e., the fuel can be hydrogen or hydrocarbons). SOFCs have tremendous potential for numerous applications from stationary to mobile power systems. The high temperature operation condition [7] and various functional requirements of the porous composite electrode components [8, 9] means that it is very important to investigate the relationship between the irregularly microstructure morphology and the macro effective properties of the porous composite electrodes [10].
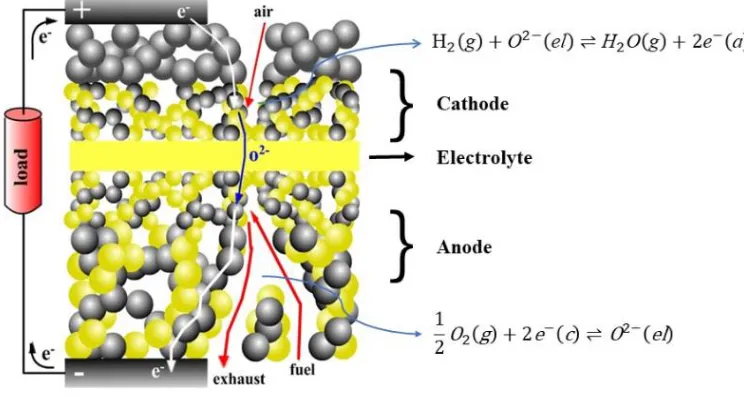
As shown in Fig. 1, a typical SOFC consists of five major components: a) porous cathode current collecting layer; b) cathode functional layer; (c) dense electrolyte; d) anode functional layer; and e) porous anode supporting layer. Since the electrochemical reaction involves electrons, ions, and various reactants and products, it only occurs around the sites where the electron-conducting phase, ion-conducting phase, and gas transporting phase coexist. They are defined as triple phase boundary sites (TPBs) [11]. Thus, the main function of the core component, porous composite electrode, is to support the highest energy conversion efficiency of electrochemical half reaction. There consist of strict requirements: i) constructing ionic conducting path and having high ionic conductivity; ii) constructing electronic conducting path and having high electronic conductivity; iii) constructing the flow transporting path and having high species diffusivities; iv) sufficient TPB sites; v) enough mechanical strength; and iv) proper thermal expansion compatibilities with the connecting components. Therefore, well understand the effect of the microstructure parameters, such as, the composition, fraction and microstructure morphology, on the electrode performance is very important for the developing of SOFC technology [12].
[image:2.596.112.484.478.676.2]
In the past decades, researches corresponding to the SOFC composite electrodes had been well made through experiments, theory analysis and numerical simulations. The experimental methods relied primarily on the stereological methods [13, 14]. The focused ion-beam scanning electron microscopy was used to obtain the 3D microstructure morphology of the composite electrodes [15, 16]. These could greatly enhance the understanding of the composite electrode microstructure information. However, only a very small zone of the whole electrode structure could be figured out, because the experimental processes were still expensive time consuming, and required the use of the hard-to-access facilities [14, 17, 18]. The percolation micro-models combined the percolation theory and coordination number theory basing on the homogeneous medium hypothesis [19, 20]. It was generally considered as an effective engineering approach to predict the effective properties within a composite medium from the microstructure parameters. However, this approach cannot well consider the influence of the irregular microstructure details [21].
Numerical simulating is considered to be a proper approach to study the irregular microstructure details on the fuel cell performance [22]. Meshing is a crucial step of this numerical method, which directly affects the accuracy of numerical calculation results [23]. Meshes are used to divide the geometric structure into many smaller domains, which called elements, and then solve a set of equations on these elements. R. J. Kee [22]constructed the SOFC composite electrode by randomly dropping the lanthanum-doped strontium manganite (LSM) and yttria-stabilized zirconia (YSZ) particles. Then, free meshing the particles to calculate the effective ionic conductivity of the composite electrode. Mitra [16] numerical calculated the tortuosity of the composite electrode by free meshing the pores part microstructure morphology that obtained by ion-beam scanning electron microscopy. Generally, free mesh or square mesh could be selected as the element. Although using free meshes can have well adaptable of geometric approximation, it will reduce the calculating accuracy and increase the computational load due to the large quantities of elements and nodes in the triangular meshes. As reported by R. J. Kee [22] and Mitra [16], there calculating zone were limited in a small zone as 2×2×2 and 5×6×4 μm , respectively, while used the free meshes. Using the square meshes, however, although 3 can greatly increasing the calculating quality, ability and enlarging the calculating zone, there are bad adaptable of geometric approximation due to the complex microstructure morphology of the SOFC composite electrode.
of both free mesh method (i.e., high geometric adaptability) and square meshes method (i.e., good calculating accuracy and ability).
2. METHOD AND THEORY
Fig. 1 also shows the multi-physics working processes within a typical anode-supported SOFC structure. In the past decades, the porous electrodes were usually made of single-phase conductive materials, such as an electronic conductive material, nickel (Ni) or LSM. In this case, its electrochemically activated region mainly occurred at the interface between the electrode and dense electrolyte. Then, the composite electrodes that consist of both electronic conducting particles (Ni or LSM) and ionic conducting particles (YSZ) were adopted. As illustrated in Fig. 1, it could expand the electrochemical activation region from the electrode/electrolyte interface into the composite electrode zone.
Taking the composite LSM-YSZ cathode in Fig. 1 as an example, oxygen should be diffused to the cathode reaction sites through the pore path. At the same time, the electrons from the external circuit are conducted to the cathode reaction sites by the electronic conducting path that constructed by the LSM particles. At these cathode reaction sites, oxygen will react with electrons to produce the oxygen ions. Finally, the oxygen ions will be conducted to the anode reaction sites through the dense electrolyte and the ionic conducting paths within both composite anode and cathode. The electrochemical half reactions in cathode and anode sides can be respectively described as [24, 25],
( )
( )
2( )
2
1
O g 2e c O el
2
− −
+ , (1)
( )
2( )
( )
( )
2 2
H g +O − el H O g +2e− a , (2)
where O2-(el) means oxygen ions located within the electrolyte material (i.e., YSZ particles), e-(a) and e-(c) means electrons located in the anode and cathode materials, respectively (i.e., Ni and LSM). O2
( )
g means oxygen within the pores. [image:4.596.172.425.555.720.2]
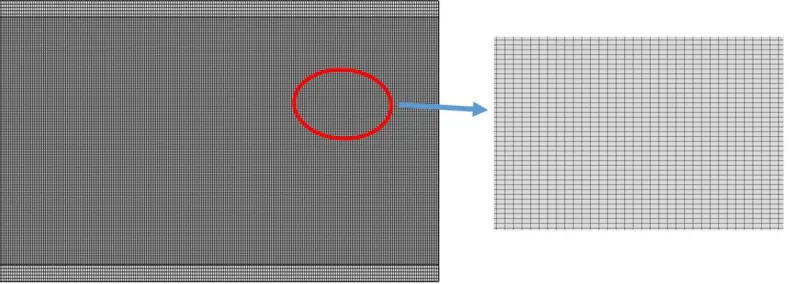
Figure 3. 1000×1000 regular matrix meshes based on the geometric size of the whole composite cathode in Fig. 2.
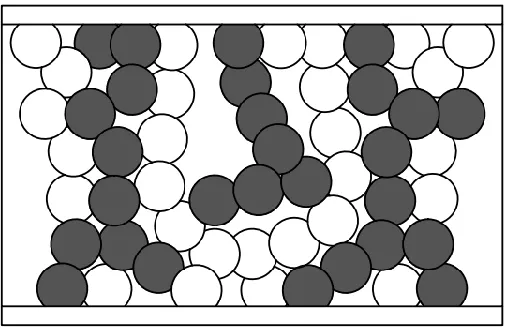
As there is complex microstructure morphologies of SOFC composite electrode [26], a relatively simple 2D structure is chosen to illustrate the application and verify the practicability of this method. This paper will focus on validate the feasibility of using the regular meshes with irregular properties distributing information to consider the effect of irregular electrode morphology on the performance. Fig. 2 displays a 2D schematic diagram of a composite cathode restricted by electronic conductive particles LSM and ionic conductive particles YSZ. Taking the irregularly YSZ particle micro morphology as the objective, the distributing characteristics of ionic electric current within the irregular microstructural and the macro effective ionic conductivity will be calculated by the proposed method. Thus, as shown in Fig. 2, the dense ionic current collecting layers are added to the top and bottom parts of the structure of composite electrode.
The operation steps of the proposed method are illustrated as follow,
Firstly, instead of addressing free meshes for the whole irregularly microstructure morphology in Fig. 2, a 1000×1000 regular matrix meshes based on the geometric size of the whole composite cathode is constructed, which is shown in Fig. 3. Then, the material phase properties of each mesh note in Fig. 3 should be identified by comparing with the microstructure morphology in Fig. 2. For example, if the mesh point coordinates are within the radius range of the ionic conductive particles (YSZ), it can be expressed as (a, b, i, j, k) = (x, y, 0
ion
, 0 ,0), where (a, b) indicates the x and y coordination of the mesh node; (i, j, k) means the corresponding ionic conductivity, electronic conductivity and pores corresponding at the coordination. 0
ion
is the intrinsic conductivity of YSZ particles. In this way, a complex irregular structure can be converted into a regular mesh input file which contains irregular material property distribution information.
Secondly, the regular mesh input file will be imported into the finite element analysis software (COMSOL Multiphysics) to calculate the effect of the irregular microstructure morphology details on the composite electrode performance.
3. RESULT AND DISCUSSION
[image:5.596.101.496.73.215.2]
0
ion ( ion ion)=0
i = − , (3)
Different from many other mathematical models basing on the uniformity medium assumption for composite electrodes, the ion0 used in Eq. (3) is the intrinsic ionic conductivity, instead of the
effective ionic conductivity ioneff. The effective ionic conductivity is function of intrinsic ionic
conductivity and microstructure parameters. iion is the ionic current density within the composite cathode zone. At both ends of the cathode structure, the potential boundaries ion,1=0 and ion,2=1 V are set as
an example for the numerical calculation.
As reported in many previous papers, the intrinsic ionic (or electronic) electrical conductivity of the typical electrode compositions, such as Ni, LSM, and YSZ, can be evaluated as the function of operation temperatures as[28, 29]:
0 6
Ni=3.27 10 1065.3
− T, (3)
7 0
LSM
4.2 10 1150
= exp
−
T T , (4)
0 4
YSZ
10300 =6.25 10 exp
−
T , (5)
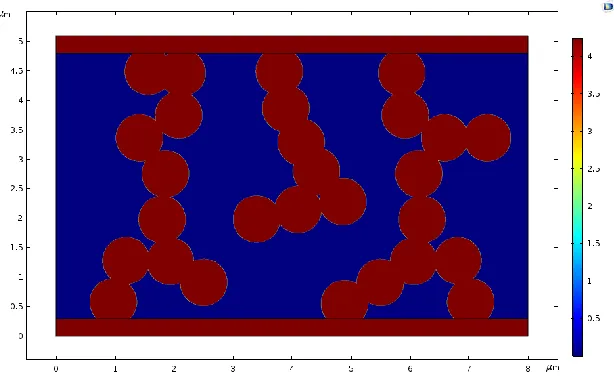
[image:6.596.145.452.497.688.2]These intrinsic electrical conductivities are addressed into the regular meshes in Fig. 3. Taking the operation temperature T=800 oC as an example, Fig. 4 shows the ionic conductivity distribution details of the composite cathode that is directly output from numerical model in COMSOL. Compared with the YSZ particle distribution morphology in Fig. 2, we can get that the ionic conductivity distribution in Fig. 4 has similar micro morphology with the configuration of the YSZ particles distribution in Fig. 2 (dark particles). This well illustrates that the regular matrix meshes with the irregular material distribution information can well represent the microstructure morphology detail and composition of the composite cathodes.
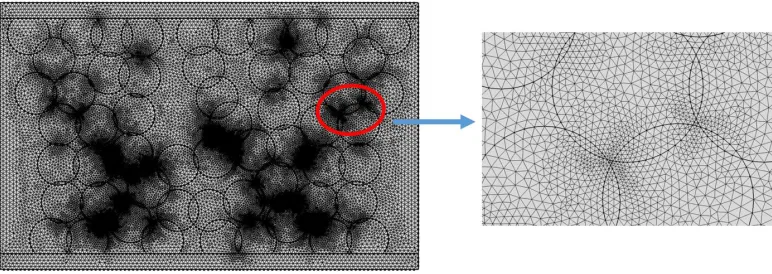
Then, the ionic electric current density distribution within the composite cathode, which is calculated basing on the regular mesh matrixes with irregular properties distribution information, will be compared with that obtained through the conventional method (with free meshes). Fig. 5 illustrates the free triangle meshes for the irregular microstructure morphology in Fig. 2. The entire composite cathode structure is divided into the triangular meshes and the element size is extremely fine. Free meshing is suitable for spatial free-form surfaces and complex geometry. The quality of the mesh is controlled by the number of meshes, the length of the sides, and the curvatures. Obviously, complex mesh shapes and sizes in Fig. 5 would influence the calculating accuracy and capability.
Mapped meshes are strictly controlled by specifying parameters, such as the length of the elements and the number of meshes. Generally it is only used for regular geometric and difficult to implement complex geometries, such as free surfaces or spatial free-form surfaces. Thus, the novelty of the proposed approach in this paper is to convert the composite structure topic that has irregular geometric structure and irregular properties distribution into a simpler topic that has regular meshes structure with irregular properties distribution information.
[image:7.596.105.491.335.472.2]Figure 5. The free triangle meshes for the irregular microstructure morphology in Fig. 2.
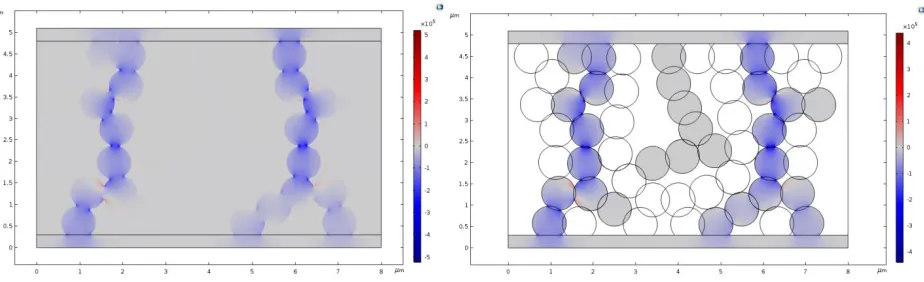
Figure 6. Comparison of the ionic electric current density distributions of y-direction at 800 oC between the two approaches: a) the novel method using regular mapping meshes with irregular properties distribution information, b) the conventional method using free meshes.
[image:7.596.66.528.522.665.2]
information, while the composite cathode is operated in 800 oC. Fig. 6b shows the ionic electric current
density distribution in y-direction, which is calculated by the convenient method using the free meshes. Good agreement between the results in Figs. 6a and 6b well illustrates the validation of the proposed method that uses the regular meshes with irregular distribution information of properties to deal with the complex composite electrode research topic that has irregularly microstructure morphology and properties distributions.
The output normal ionic electric current densities iionout at the outer boundary obtained by the proposed and conventional methods are calculated to be 107472 A m-2 and 1.0688×10⁵ A m-2, respectively. Then, the macro area-normalized resistance (ARS) and effective ionic conductivity (ioneff)
of the whole composite cathode can be respectively evaluated to be 5.4735×10⁻⁶ 2
m
and 0.5481 S m -1 according to the follow equation,
ion ion ion ion eff
ion
V =I R=i ARS=i L , (6)
[image:8.596.67.528.387.527.2]where Iion is the ionic electric current in unit A. L is the thickness of the whole composite electrode structure. Good agreements between these calculated results well illustrated that the regular matrix meshes with the irregular material distribution information can be used to represent the microstructure morphology detail and composition of the composite cathodes well.
Figure 7. Comparison of the ionic electric current density distributions of y-direction at 700 oC between:
a) the proposed method, and b) the conventional method using free meshes.
[image:8.596.68.530.580.721.2]
As reported by many previous paper [20, 30], the macro effective ionic conductivity basing on the frame geometry is generally considered to be a function of the intrinsic properties of the material and the micro structure parameters, such as, the mass fraction, particle size, porosity and so on,
eff 0
ion ( ion, el, , el, ed)
= f g r r , (7)
Figs. 7 and 8 further compare the ionic electric current density distributions of y-direction obtained by the proposed and conventional methods, while the composite cathodes are operated at 700
oC and 600 oC, respectively. Then, the corresponding normal ionic electric current densities, ARS and
effective ionic conductivities are calculated and compared in Table 1. Good agreements further illustrate the validation of the proposed method that using the regular meshes with irregular properties distribution information to deal with the effect of the complex irregular microstructure morphology of SOFC composite electrodes. On one hand, compared with the conventional methods basing on homogeneous medium hypothesis [20, 23], this method provides an effective approach to further consider the effect of the detail microstructure morphology. On the other hand, compared with those works that consider the effect of the irregular microstructure morphology by directly meshing the structure [16, 22, 31, 32], this approach is considered to be a more effective approach to greatly increase the calculation capability.
Generally, during the numerical calculating, it is very important to address sufficiently fine meshes to ensure accuracy of the calculated results. However, the finer the meshes, the larger amount of computation, the more storage space, and the longer computation time are required. That is the reason why only very small zone can be numerical simulated, while the complex microstructure details should be considered. Thus, the current proposed method would provide the great possibility for the researchers to largely extend the calculated zone of the irregular microstructure morphology of the composite electrodes in the near future.
Table 1. The corresponding calculated output normal ionic electric current densities at the outer boundary, ARS and effective ionic conductivities of the whole electrode are collected and compared
Operation temperature Proposed method Conventional method
out ion
i ASR ioneff
out ion
i ASR ioneff
800 oC 1.0747×10⁵ 5.4735×10⁻⁶ 0.5481 1.0688×10⁵ 5.5036×10⁻⁶ 0.5451 700 oC 0.4008×10⁵ 14.6771×10⁻⁶ 0.2044 0.3986×10⁵ 14.7565×10⁻⁶ 0.2033 600 oC 0.1193×10⁵ 49.3421×10⁻⁶ 0.0608 0.1186×10⁵ 49.5868×10⁻⁶ 0.0605
4. CONCLUSION
[image:9.596.51.544.521.601.2]
and validated approach; and can be well used to investigate the effect of the irregularly microstructure morphology details of the composite electrode on the SOFC performance in the near future, especially while a relative large calculated zone is required.
ACKNOWLEDGEMENTS
We gratefully acknowledge the financial support of the National Science Foundation of China (51776092 and 21406095) and the Natural Science Foundation of Jiangsu Province BK20151325. References
1. D. Chen, Y. Xu, M. O. Tade, and Z. Shao, ACS Energy Lett., 2(2017) 319.
2. C. Duan, J. Tong, M. Shang, S. Nikodemski, M. Sanders, S. Ricote, A. Almansoori, and R. O’Hayre, Science, 349(2015) 1321.
3. Z. Qu, M. Shi, H. Wu, Y. Liu, J. Jiang, and C. Yan, J. Power Sources, 410-411(2019) 179. 4. B. Chen, H. Xu, H. Zhang, P. Tan, W. Cai, and M. Ni, Appl. Energ., 200(2017) 260.
5. S. Su, H. He, D. Chen, W. Zhu, Y. Wu, W. Kong, B. Wang, and L. Lu, Int. J. Hydrogen Energy, 40(2015) 577.
6. M. Irshad, K. Siraj, R. Raza, A. Ali, P. Tiwari, B. Zhu, A. Rafique, A. Ali, M. Kaleem Ullah, and A. Usman, Appl. Sci., 6(2016) 75.
7. D. Chen, Y. Xu, B. Hu, C. Yan, and L. Lu, Energ. Convers Manage, 171(2018) 807. 8. Y. Niu, W. Lv, Z. Wei, W. Huo, and W. He, Aiche. J., 64(2018) 1127.
9. H. Chen, F. Wang, W. Wang, D. Chen, S.-D. Li, and Z. Shao, Appl. Energ., 179(2016) 765. 10. D. Jeong, J. Kim, O. Kwon, C. Lim, S. Sengodan, J. Shin, and G. Kim, Appl. Sci., 8(2018) 2217. 11. D. Chen, H. Wang, S. Zhang, M. O. Tade, Z. Shao, and H. Chen, Aiche. J., 61(2015) 3786. 12. R. Ahmed and K. Reifsnider, Int. J. Electrochem. Sci., 6(2011) 1159.
13. J. Yoon, R. Araujo, N. Grunbaum, L. Baque, A. Serquis, A. Caneiro, X. H. Zhang, and H. Y. Wang, Appl. Surf. Sci., 254(2007) 266.
14. H. Iwai, N. Shikazono, T. Matsui, H. Teshima, M. Kishimoto, R. Kishida, D. Hayashi, K. Matsuzaki, D. Kanno, M. Saito, H. Muroyama, K. Eguchi, N. Kasagi, and H. Yoshida, J. Power Sources, 195(2010) 955.
15. J. G. P.R. Shearing, R.J.Chater, N.P.Brandon, Chem. Eng. Sci., 64(2009) 3928
16. J. R. Wilson, W. Kobsiriphat, R. Mendoza, H. Y. Chen, J. M. Hiller, D. J. Miller, K. Thornton, P. W. Voorhees, S. B. Adler, and S. A. Barnett, Nat. Mater., 5(2006) 541.
17. D. Chen, K. Ding, Z. Chen, T. Wei, and K. Liu, Energ. Convers Manage., 178(2018) 190. 18. J. R. Wilson, J. S. Cronin, A. T. Duong, S. Rukes, H. Y. Chen, K. Thornton, D. R. Mumm, and
S. Barnett, J. Power Sources, 195(2010) 1829.
19. M. Suzuki and T. Oshima, Powder Technol., 35(1983) 159.
20. D. Chen, Q. Zhang, L. Lu, V. Periasamy, M. O. Tade, and Z. Shao, J. Power Sources, 303(2016) 305.
21. W. Kong, M. Zhang, Z. Han, and Q. Zhang, Appl. Sci., 9(2019) 493.
22. B. Kenney, M. Valdmanis, C. Baker, J. G. Pharoah, and K. Karan, J. Power Sources, 189(2009) 1051.
23. K. Zheng and M. Ni, Sci. Bull, 61(2016) 78.
24. D. Chen, B. Hu, K. Ding, C. Yan, and L. Lu, Energies, 11(2018) 1875. 25. M. Ni, Sci. Bull, 61(2016) 1311.
26. C. Graves, S. D. Ebbesen, S. H. Jensen, S. B. Simonsen, and M. B. Mogensen, Nat. Mater., 14(2015) 239.
28. D. Chen, W. Bi, W. Kong, and Z. Lin, J. Power Sources, 195(2010) 6598.
29. S. Q. Yang, T. Chen, Y. Wang, Z. B. Peng, and W. G. Wang, Int. J. Electrochem. Sci., 8(2013) 2330.
30. B. B. Xiao, X. B. Jiang, and Q. Jiang, Phys. Chem. Chem. Phys., 18(2016) 14234.
31. L. Kang, W. Fenghui, Z. Xiang, and L. Yongjun, Int. J. Electrochem. Sci., 11(2016) 1382 32. J. Sanyal, G. M. Goldin, H. Zhu, and R. J. Kee, J. Power Sources, 195(2010) 6671.