EUROPEAN COMMISSION
Brussels, 24.10.2012 COM(2012) 626 final
REPORT FROM THE COMMISSION TO THE EUROPEAN PARLIAMENT AND THE COUNCIL
PROGRESS TOWARDS ACHIEVING THE KYOTO OBJECTIVES
(required under Article 5 of Decision 280/2004/EC of the European Parliament and of the Council concerning a mechanism for monitoring Community greenhouse gas
emissions and for implementing the Kyoto Protocol)
TABLE OF CONTENTS
1. Summary ... 3
2. Actual progress 1990-2010 ... 5
2.1. GHG emissions trends in Member States ... 5
2.2. GHG intensities and emissions per capita in 2010... 6
2.3. GHG emissions in 2010 compared to 2009 ... 7
2.4. Emission trends in the main sectors ... 8
3. Projected progress towards meeting the Kyoto target... 9
3.1. Projections of GHG emissions ... 9
3.1.1. EU-27 ... 9
3.1.2. EU-15 ... 9
3.1.3. EU-12 ... 10
3.2. State of implementation of the Union's climate change policy... 12
3.3. Implementation of the EU Emissions Trading System (EU ETS)... 15
3.3.1. Second trading period (2008-2012) ... 15
3.3.2. Use of JI and CDM by operators... 15
3.4. Projected use of Kyoto mechanisms by Union's governments ... 15
3.5. Projected use of carbon sinks... 16
4. Meeting the 2020 target ... 16
4.1. Union's GHG emission reduction target by 2020 ... 16
4.2. Policies contributing to the fulfilment of targets... 16
4.3. Projected distance to targets... 17
5. Adaptation to climate change... 19
1. SUMMARY
On track to reach the Kyoto target, 2008-2012
In 20101, total EU-27 greenhouse gas (GHG) emissions without emissions and removals from Land Use, Land Use Change and Forestry (LULUCF) were 15% lower compared to 1990 levels. Emissions increased by 2.4% compared to 2009. This partly compensates the significant decrease of GHG emissions in 2009 as a result of the economic recession (-7.3%). Leaving the exceptional drop in 2009 aside, 2010 GHG emissions continue to follow the general decreasing trend seen from 2004 onwards.
Additionally, according to the provisional 2011 data2, EU-15 and EU-27 GHG emissions decreased by 3.6% and 2.5% in 2011 compared to 2010. Based on these estimates, EU-15 emissions are 14% below the base-year level. EU-27 2011 emissions are approximately 18% below the 1990 level. The change of GDP in 1990-2011 was 43% for 15 and 48% for EU-27, and around 1.5% between 2010 and 2011. While the economy has grown significantly, emissions in both the EU-27 and the EU-15 have been decreasing, which demonstrates that decoupling of economic growth from GHG emissions has been progressing steadily since 1990.
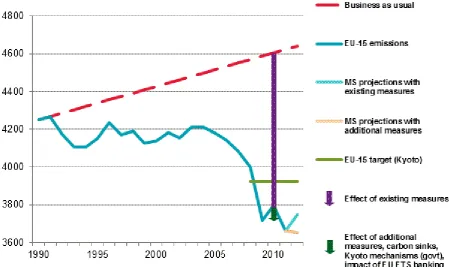
[image:3.595.78.528.457.724.2]Under the Kyoto Protocol, the EU-15 has agreed to reduce its GHG emissions by 8% by 2008–12 compared to base year levels. Based on the latest available inventory data of 20101, total GHG emissions in the EU-15 were 11% below base year emissions without LULUCF. All in all, projections3 of total GHG emissions as shown in Figure 1 indicate that the EU-15 is well on track to reach its Kyoto target. The estimate shows that the target is likely to be overachieved.
Figure 1: Actual and projected emissions (MtCO2-eq.) for EU-15
According to the GHG projections submitted in 2011 and updated in 2012, six EU-15 Member States (Finland, France, Germany, Greece, Sweden, the United Kingdom) are on track to achieve their individual GHG reduction targets domestically as shown in Figure 5. Taking into account the planned use of the Kyoto flexible mechanisms, use of unused allowances from the EU ETS new entrants reserve and carbon sinks as well as additional policy measures, only one Member State (Italy) is not on track to achieve their targets.
In most of the twelve Member States which acceded the Union as from 2004, emissions are projected to slightly increase between 2009 and 2012. However, nine of them that have a Kyoto target are projected to meet or over-achieve their commitments using only existing policies and measures. Slovenia is estimated to meet its target when all the existing and planned measures, including the purchase of Kyoto credits, deliver as expected.
New measures to reach the ambitious Europe 2020 target
The climate and energy package4 adopted in 2009 provides an integrated and ambitious package of policies and measures to tackle climate change until 2020 and beyond. It forms one of the five headline targets of the Europe 2020 jobs and economic growth strategy. From 2013 onwards the total effort of the Union to reduce greenhouse gas emissions by 20%5 by 2020 compared to 1990 will be divided between the EU ETS and non-ETS sectors. The GHG data presented in the previous section refer to the scope of the first commitment period under the Kyoto Protocol and cannot be directly used to assess progress towards the Union's domestic commitment by 2020 because of its broader sectoral coverage.
Preparations for the implementation of the GHG reduction commitment by 2020 are almost completed. With regard to the EU ETS, substantial progress in preparing for Phase 3 (2013-2020) has been made since the last progress report in October 2011, including on the auctioning platform, on the Single Union Registry and on adoption of harmonised rules on monitoring, reporting, accreditation and verification. As far as the Effort Sharing Decision, which regulates GHG emissions in sectors outside the EU ETS by setting binding annual GHG emissions targets for each Member State (MS) is concerned, work on implementing measures is continuing, especially in relation to determining the absolute values for Member States' targets and the compliance system which will be put in place for monitoring Member States' action annually and helping them to take any necessary corrective measures if they fail to meet their targets.
The 20% GHG reduction objective is rooted in the Europe 2020 strategy for jobs and smart, sustainable and inclusive growth adopted by the European Council in June 2010. The emission reduction target is one of the five headline targets. As noted in the Commission's Annual Growth Survey 2011, in the field of climate change mitigation the existing and planned measures are not yet sufficient to reach the 2020 headline targets. Many Member States need to make additional efforts to meet their obligations under the Effort Sharing Decision.
According to the latest available GHG projections which include the implementation of the Climate and Energy Package, the EU would collectively meet its 2020 target (see Figure 6 for the details). However, only 13 MS can expect to meet their 2020 commitments with policies already in place, further 8 MS could deliver on their targets when their additional policies and measures deliver as expected. The remaining 6 MS need to design additional policies in order to accomplish their targets and/or make use of the flexibilities provided for in the Climate and Energy Package.
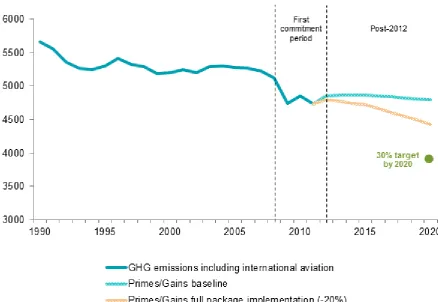
Figure 2: Actual and projected emissions (MtCO2-eq.) for EU-27
Note: PRIMES/GAINS projections3 used to project changes in emissions over the period 2010-2020
Source: European Commission, EEA
2. ACTUAL PROGRESS 1990-2010
2.1. GHG emissions trends in Member States
The overall EU GHG emission trend is dominated by the two largest emitters, Germany and the United Kingdom, accounting for about one third of total EU-27 GHG emissions. These two Member States have achieved total GHG emission reductions of 483 million tonnes CO2-equivalents compared to 1990. The main reasons for the favourable trend in Germany were increasing efficiency in power and heating plants and the economic modernisation of the five new Länder after German reunification. The reduction of GHG emissions in the United Kingdom was primarily the result of liberalising energy markets and the subsequent fuel switches from oil and coal to natural gas in electricity production and N2O emission reduction
France and Italy were the third and fourth largest emitters in 2010, respectively accounting for 11.1 % and 10.6 % of total EU-27 emissions. France's emissions were 6.6 % below 1990 levels in 2010. In France, large reductions were achieved in N2O emissions from adipic acid
production, but CO2 emissions from road transport and HFC emissions from consumption of
halocarbons increased considerably between 1990 and 2010. Italy's GHG emissions were 3.5 % below 1990 levels in 2010. Emissions increased since 1990 primarily from road transport, electricity and heat production and petroleum refining but the country's total GHG emissions have decreased significantly (7.2 %) since 2008.
Poland and Spain are the fifth and sixth largest emitters in the EU-27, accounting for 8.5 % and 7.5 % of total EU-27 GHG emissions in 2010. Poland decreased GHG emissions by 12.4 % between 1990 and 2010, and by 28.9 % since the base year, which in Poland's case is 1988. The main factors for decreasing emissions in Poland — as for other new Member States — were the decline of energy inefficient heavy industry and the overall modernisation of the economy in the late-1980s and early 1990s. The notable exception was transport (especially road transport) where emissions increased. Spain increased emissions by 25.8 % between 1990 and 2010 and by 22.8 % since the base year. This was largely due to emission increases from road transport, electricity and heat production, and manufacturing industries.
In 2010, six Member States had GHG emissions above base year levels (mostly 1990) whereas the remaining nineteen Member States had emissions below base year levels. The percentage changes of GHG emissions from the base year to 2010 range from -56% (Romania) to +23% (Spain). Cyprus and Malta do not have emission reduction commitments under the Kyoto Protocol. In those two Member States, emissions in 2010 were above 1990 levels.
2.2. GHG intensities and emissions per capita in 2010
Emissions in both the EU-27 and the EU-15 have been decreasing while the economy has grown significantly. Figure 3 demonstrates that decoupling of economic growth from GHG emissions has been progressing steadily since 1990.
0 20 40 60 80 100 120 140 160
1990 1995 2000 2005 2010
GDP
GHG emissions
GHG intensity
Source: EEA, DG ECFIN (Ameco database), Eurostat
Between 1990 and 2010, in the EU-27 GDP grew by 46 % while emissions decreased by 15 % and in the EU-15 GDP increased by 41% with a 11 % reduction of GHG emissions. Between 2009 and 2010 GDP increased by 2% and emissions by 2.4%. Therefore, emission intensity also increased. However, it can be noted that the emission intensity in 2010 was better than the one in 2008.
Between 1990 and 2010 GHG intensity decreased in all MS. The deepest decrease was observed in Estonia 75%), Slovakia 72%), Romania 63%), Lithuania 62%), Bulgaria (-62%). The smallest changes took place in Portugal (-18%), Cyprus (-18%), Italy (-21%), Spain (-22%) and Malta (-23%).
In 2010, in the EU-27 emissions per capita were at the level of 9.4 tCO2-eq. Per capita
emissions decreased by 2.4 tCO2-eq., which is equivalent to a 21% reduction compared to
1990. However, 2010 GHG emissions per capita continues to show significant differences across Member States ranging from 5.4 (Latvia) to 24.1 (Luxembourg) tCO2-eq. per capita.
They are to a large extent determined by the energy intensity and the energy mix of each country. Also per capita emission trends differ greatly between Member States. Since 1990, largest per capita reductions have been made in Member States in central and Eastern Europe, Luxembourg, United Kingdom, Germany, Denmark, Sweden, France and Belgium. In six Member States per capita emissions have increased since 1990. Per capita emissions in these Member States, however, are lower than the Union's average except for Greece and Cyprus (see also figure 2 of the Staff Working Paper (SWP)).
2.3. GHG emissions in 2010 compared to 2009
Among the industrial sectors, the largest combined increase stemmed from manufacturing industries and construction (including iron and steel process emissions) and from public heat and electricity production. Higher industrial activity during 2010, after the strong contraction in 2009, appears to have led to a sharp increase in final energy demand and emissions in these sectors. The sector that contributed most to higher emissions in the EU in 2010 was, however, ‘residential and commercial’, which broadly falls outside the scope of the EU ETS. The key reason for the 43 million tonnes increase in emissions there was the cold winter in 2010, which increased demand for heating, particularly by households. The continued strong increase in renewable energy use and the improved carbon intensity of fossil fuels - underpinned by strong natural gas consumption - prevented the increase in GHG emissions from being higher.
About 56 % of the EU increase in GHG emissions was accounted for by Germany (+3%), Poland (+5%) and the United Kingdom (+3%). In percentage terms, growth in emissions was highest in Estonia (+25%), Finland (+13%), Sweden (+11%) and Latvia (+10%). Contrastingly, Spain, Greece, Portugal, Romania, Cyprus and Ireland continued reducing GHG emissions in 2010. The increase in emissions in 2010 was partly driven by the economic recovery from the 2009 recession in many European countries, which had itself caused substantial emission reductions in 2008 and 2009 in all Member States. Final energy demand increased by 3.7 % in 2010, outpacing the increase in economic output (2.0 %).
2.4. Emission trends in the main sectors
Figure 4 shows that energy supply and use including transport are the most important sectors accounting for 78% of total Union's emissions in 2010. Agriculture is responsible for 10% of total GHG emissions, industrial processes for 7% and waste for 3%. Since 1990, the decreases in energy, agriculture, industrial processes and waste have been partially offset by significant increases in the transport sector (for further details see also the SWP). However, total transport emissions have also been decreasing since 2007.
Share in 2010
0% 3%
7% 10%
20% 28%
32%
Other Waste Industrial processes Agriculture Transport Energy use (excluding
transport) Energy supply
1990-2010 change
-32% -30%
-26% -22%
20% -22%
-18%
Source: 2012 national inventories
3. PROJECTED PROGRESS TOWARDS MEETING THE KYOTO TARGET
3.1. Projections of GHG emissions
3.1.1. EU-27
In the Kyoto commitment period, total EU-27 GHG emissions are projected to be about 18.2% below base-year levels. This estimate is based on MS projections3 and takes into account existing polices and measures. The projected decline is even bigger when the effect of acquisitions of credits via the Kyoto mechanisms by governments, carbon sinks and additional measures are accounted for (for more details see tables 7a and 7b in the SWP).
3.1.2. EU-15
The aggregate projections for all sectors estimate that total GHG emissions of the EU-15 are likely to be 11.3% below base-year levels during the Kyoto commitment period. When including,
(1) the government use of the Kyoto mechanisms which is expected to deliver an additional 1.8% emission reduction, and
(2) the total removal of carbon sinks due to activities referred to in Art. 3.3 and 3.4 of the Kyoto Protocol in the EU-15 corresponding to a 1.4% reduction,
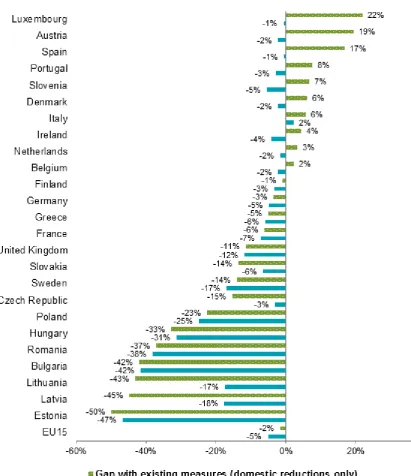
Figure 5 presents the gaps between projected non-ETS emissions and the respective targets for the sectors concerned per each Member State. This analysis indicates that existing policies and measures would be sufficient for the EU-15 to meet its part of the collective Kyoto target attributed to the non-ETS sectors. However, all 15 Member States will need to meet their respective individual commitments under the joint fulfillment agreement under the Kyoto Protocol. According to the information presented, two Member States are at risk of not meeting the target.
3.1.3. EU-12
Figure 5: Relative gaps between GHG projections in the non-ETS sectors for the commitment period and the respective 2008-2012 targets based on GHG projections and the use of Kyoto mechanisms and carbon sinks. Negative and positive values respectively indicate overdelivery or shortfall in percentage of base-year emissions.
Note: For Ireland, the use of unused ETS allowances from the new entrants reserve is taken into account in the non-ETS target
3.2. State of implementation of the Union's climate change policy
The European Climate Change Programme (ECCP)
Across the EU-27, an assessment of Member States' policies and measures identified eight Common and Coordinated Policies and Measures (CCPMs) that are projected to deliver significant GHG emissions savings in the Union. The largest savings can be expected from the EU ETS Directive (2003/87/EC) as revised and the Renewable Energy Directive (2009/28/EC) promoting electricity produced from renewable energy sources. In the transport sector, the fuel quality legislation and reduction of CO2 from cars are of significant
importance. Further, energy demand will be reduced through the implementation of the Directives on the energy performance of buildings, eco-design requirements, energy taxation and the promotion of co-generation (combined heat and power). Finally, use of the Kyoto Protocol's flexible mechanisms is projected to deliver significant GHG emissions savings. In addition to these eight key policies and measures, a further five CCPMs were identified that are also predicted to deliver important savings across the Union. These five policies are the Landfill Directive (99/31/EC), the efficiency standards for new hot-water boilers, the Directive on labelling of appliances (2010/30/EU), the Industrial Emissions Directive (2010/75/EU) and the Motor Challenge programme, aimed at improving the energy efficiency of industrial electric motors. A Report from the Commission on the application, effects and adequacy of the Regulation (EC) 842/2006 concludes that this Regulation has already achieved some reduction of emissions of F-Gases compared to a scenario without the Regulation41. Together with the Directive on mobile air-conditioning systems (2006/40/EC), this Regulation has the potential to achieve a significant reduction of projected emissions by 2020 and beyond.
The top eight policies account for 92% of the total expected savings attributed to CCPMs in the EU-27. This underlines the importance of these key policies in helping Member States to achieve their emission reduction commitments.
Recent developments
Since the adoption of the climate and energy package, work on implementation measures is ongoing. Before the end of 2012, about twenty new legal acts and documents have to be in place in order to ensure proper functioning of the EU ETS as revised as well as to prepare the ground for the implementation of national GHG emission targets in the non-ETS sectors.
The revised EU ETS Directive provides for the centralisation of the EU ETS operations into a single European Union registry while at the same time improving its security. This new registry is operated by the Commission and replaces all EU ETS registries previously hosted in the Member States. The regulation establishing a Union Registry was adopted by the Commission in November 2011. The full activation of the Union Registry, including the migration of over 30,000 EU ETS accounts from national registries, took successfully place in June 2012.
As of 2012, aviation emissions are subject to a cap in the EU ETS, a change which alone increases the emissions coverage by approximately 10%. Substantial work has gone into implementing this change, including on monitoring and facilitating compliance and on preparing and coordinating, where necessary, action related to enforcement.
The Auctioning Regulation is currently under review, notably as regards the auction time profile with a view to ensuring the orderly functioning of the market and addressing supply-demand imbalances that have been caused by the transition to Phase 3 and been exacerbated by the existence of a surplus of allowances built up as a consequene of the economic crisis. In this context the Commission has also proposed a Decision to clarify the provisions of the EU ETS Directive regarding its own powers to adapt the timing of auctions of emission allowances in such exceptional circumstances.
The European Commission authorised requests from 7 Member States to grant transitional free allocations of allowances to their power sectors beyond 2012. These decisions were taken under strict application of provisions in the Directive which allow, on certain conditions, for time-limited and gradually decreasing exemptions from the general rule of auctioning.
Work on enhanced rules for monitoring and reporting of GHG emissions by operators covered by the EU ETS as well as requirements for the verification of emission reports and the accreditation and supervision of verifiers is ongoing and aims for improved harmonisation of the applied rules. Two new regulations were adopted in June 2012 and will be complemented by guidance documents in time for the third ETS period.
Preparation of the implementing measures under the Effort Sharing Decision is ongoing and currently focuses on determining the absolute values for Member States' annual emissions targets in 2013-2020 and setting rules for transfers of annual emission allocations among Member States as well as ensuring their transparency. The corresponding legal texts are expected to be adopted at the end of 2012 or in early 2013.
In addition, the revision of the EU Monitoring Mechanism and the proposal for accounting of land use, land use change and forestry are currently under negotiation in Council and Parliament. These proposals are driven by the need to address in particular the reporting and accounting needs of the climate and energy package, Europe 2020 Strategy, new requirements deriving from the Durban decisions as well as lessons learnt so far.
In June 2012, the European Parliament, the Council and the EU Commission reached a political agreement on the Energy Efficiency Directive. This directive will contribute to achieving Europe's 20% energy efficiency target for 2020.
Work on the implementating measures for Regulation (EC) 443/2009 related to CO2 from cars
and Regulation (EU) 510/2011 related to CO2 from light commercial vehicles is ongoing. The
implementation of the cars measures is more advanced than that for light commercial vehicles but the latter will be consistent with the former. The Commission has now made proposals to implement 2020 CO2 targets for cars and light commercial vehicles which will now be
considered in the Council and Parliament.
efficiency has been included. New greening measures are also foreseen in the proposed revised Common Agricultural Policy and the Rural Development Fund, and 35% of “Horizon 2020”, the EU Framework Programme for Research and Innovation should be allocated to climate relevant research and innovation. As a new element, the LIFE Programme will have a sub-programme dedicated to Climate Action, representing around 25% of the total LIFE Programme. The Commission will ensure that progress towards the proposed 20% climate spending objective will be tracked and reported on.
Finally, a staff working document (SWD(2012) 5 final) assessing the impacts of further reducing emissions from 20% to 30% by 2020 in each of the Member States was issued in early 2012.
Legal acts recently adopted
Implementation of the climate and energy package:
(1) EU ETS Auctioning – early auctions: Commission Regulation (EU) No 1210/2011 amending Regulation (EU) No 1031/2010 in particular to determine the volume of greenhouse gas emission allowances to be auctioned prior to 2013.
(2) EU ETS Registry – Union Registry: Commission Regulation (EU) No 1193/2011 establishing a Union Registry for the trading period commencing on 1 January 2013, and subsequent trading periods, of the Union emissions trading scheme
(3) EU ETS Harmonised allocation rules: Commission Decision 2011/278/EU8 determining transitional Union-wide rules for harmonised free allocation of emission allowances.
(4) EU ETS Monitoring, reporting, verification and accreditation rules: Commission Regulation (EU) No 600/2012 of 21 June 2012 on the verification of greenhouse gas emission reports and tonne-kilometre reports and the accreditation of verifiers and Commission Regulation (EU) No 601/2012 of 21 June 2012 on the monitoring and reporting of greenhouse gas emissions.
(5) EU ETS Use of international credits: The Commission Regulation (EU) No 550/201110 on determining certain restrictions applicable to the use of international credits from projects involving industrial gases.
Other:
(6) Aviation and the EU ETS: Commission Regulation (EU) No 394/201111 amending Regulation (EC) No 748/2009 on the list of aircraft operators.
(7) CO2 and cars: Commission Regulation (EU) No 63/201113 laying down
detailed provisions for the application for a derogation from the specific CO2
(8) CO2 and vans: Commission Implementing Decision 2012/99/EU - on the
detailed arrangements for the collection of premiums for excess CO2 emissions from new light commercial vehicles.
3.3. Implementation of the EU Emissions Trading System (EU ETS)
2012 will be the last year of the second trading period of the EU ETS (2008-2012). In 2013, a substantially revised system will begin its operation.
3.3.1. Second trading period (2008-2012)
The EU-wide average annual cap for 2008-2012 amounts to 2081 million allowances per year. In 2011, EU ETS covered more than 12,000 power plants and manufacturing installations. Verified emissions of greenhouse gases from these installations dropped to 1904 million tonnes of CO2-eq. in 2011, more than 2% below the 2010 level and almost 9% below the cap. This was despite an expanding economy in Europe.
The level of compliance by the installations was very high. Only less than 1% of the installations participating in the EU ETS did not surrender allowances covering all their 2011 emissions by the deadline of 30 April 2012.
3.3.2. Use of JI and CDM by operators
As part of the second National Allocation Plans (NAPs), a limit was established by each Member State for the maximum use of project-based credits by operators (Joint Implementation (JI) and Clean Development Mechanism (CDM)). In total and on average, up to 278 million CERs or ERUs may be used per year by ETS installations from all Member States in the second trading period, which corresponds to 13.4 % of the EU-wide cap for this period. In 2008-2011, operators used 555 million CERs or ERUs which was 7% of all units surrendered for compliance. From 2013 onwards the rules for the use of JI and CDM credits will be revised as set in the EU ETS Directive.16
3.4. Projected use of Kyoto mechanisms by Union's governments
Ten Member States of the EU-15 as well as Slovenia have decided to purchase and use international credits from Kyoto mechanisms to reach their Kyoto targets. Together, these EU-15 Member States would acquire up to 76 Mt CO2-eq. per year for compliance under the
first commitment period under the Kyoto Protocol. This would represent approximately 1.8 percentage points towards the EU-15 Kyoto target of -8 % (see Table 12 in the SWP).
These 10 Member States together have decided to invest up to € 3.0 billion to acquire units through JI, CDM or AAU trading. Austria, the Netherlands, Spain, Ireland and Belgium allocated the largest budgets (€ 611 million, € 500 million, € 382 million, € 290 million and € 276 million, respectively) for the five-year commitment period. In Slovenia, the budget has been estimated for € 80 million. However, given the impact of the recent recession on GHG emissions MS might not need as many international credits as initially estimated. So far, this hypothesis seems to be supported by the fact that the amount of international credits actually delivered to Member States' accounts in registries only amounts to about 32 Mt CO2-eq.
As regards AAUs sold by Member States, according to data in the registries about 68 Mt CO2
they intend to further sell AAUs. One Member State (UK) has legislated that it would retire any surplus AAUs between the Kyoto target and the UK unilateral ‘carbon budget’ after the 1st commitment period.
3.5. Projected use of carbon sinks
In addition to the policies and measures targeting various sources of GHG emissions, Member States can make use of carbon sinks. The information provided so far indicates that total net sequestration during the commitment period from afforestation and reforestation activities under Art. 3.3 of the Kyoto Protocol will be about 14.8 MtCO2 per year for the EU-15. In
addition, the use of activities under Art. 3.4 is projected to contribute 30.6 MtCO2 per year of
the commitment period in the 15. Taking in addition into account contributions from EU-12, the accounting of these activities will amount to 25.8 and 38.4 MtCO2 per year (for details
see Table 13 in the SWP).
Together, activities under Art. 3.3 and 3.4 in the EU-15 Member States are projected to reduce emissions by 57.9 Mt CO2 per year of the commitment period. This is equivalent to a
bit more than 1 percentage point of the EU-15 reduction commitment of 8 % during the 1st commitment period compared to base year emissions.
4. MEETING THE 2020 TARGET
4.1. Union's GHG emission reduction target by 2020
The Climate and Energy Package set a 20% GHG emission reduction target for EU-27 by 2020 compared to 1990, which is equivalent to -14% compared with 2005. This effort will be divided between the EU ETS and non-ETS sectors as follows:
(a) 21% reduction in EU ETS sector emissions by 2020 compared to 2005;
(b) reduction of around 10% by 2020 compared to 2005 for the sectors that are not covered by the EU ETS.
These greenhouse gas emissions reduction targets were included in the Europe 2020 strategy for smart, sustainable and inclusive growth.
4.2. Policies contributing to the fulfilment of targets
Under the ESD, Member States will be responsible for implementing these Union-wide policies and measures in these sectors, and, if necessary, for defining additional national policies and measures to limit their emissions. A robust reporting and compliance system will be put in place for monitoring Member States' action and help them make any necessary corrective measures if they fail to meet their targets.
4.3. Projected distance to targets
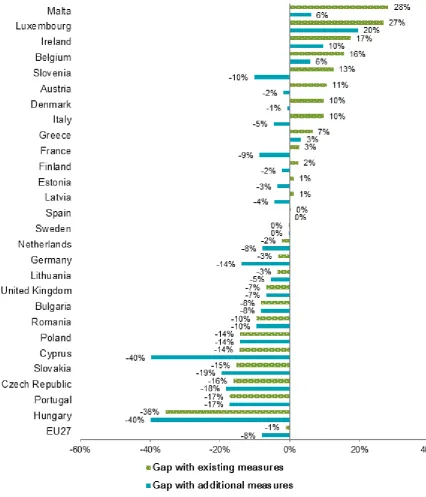
Despite the positive trends towards KP commitment achievement shown by 2008-2012 projections, more efforts and additional policies will be necessary to achieve the Union's 2020 objectives. The flexibilities provided for in the ESD and the revised ETS Directive, such as the use of international credits, will also contribute to the attainment of the targets. Figure 6 shows first estimates of the gap between non-ETS GHG emissions projections by 2020 and 2020 targets.
According to these provisional projections still much effort will be needed by individual Member States to deliver on their 2020 targets set for the non-ETS sectors. Only 13 Members States can expect to reach these commitments with existing policies and measures. Further 8 MS could meet their targets with planned additional policies and measures. 6 Member States are unlikely to be able to deliver on their commitments even with the additional measures foreseen for now. However, as regards EU-27, the estimates show that the overall non-ETS target would be delivered. This analysis does not yet take into account the use of flexibilities provided for in the ESD, such as the use of international credits.
Figure 6: Projected gap to 2020 targets for non-ETS sectors. Negative and positive values respectively indicate overdelivery and shortfall in percentage of 2005 emissions.
Note: (1) The underpinning data for this calculation are based on MS projections for 2020 non-ETS emissions,
gap-filled and adjusted where necessary3, as well as estimated 2020 non-ETS targets for MS (still subject to some changes). Several Member States (CZ, EE, FI, LT, NL, PL) have not provided specific national projections for non-ETS sectors, so the share of these emissions had to be estimated. (2) The assessment provided in this figure should be treated as indicative, due to differences in methodology and assumptions. Some data, such as the Greek and Lithuanian projection for instance deviate substantially from the projections made for the 'EU energy trends to 2030 - update 2009' (Publication by the European Commission, Directorate-General for Energy in collaboration with Climate Action DG and Mobility and Transport DG, ISBN 978-92-79-16191-9).
5. ADAPTATION TO CLIMATE CHANGE
Reducing emissions in the coming decades can still avoid large scale dangerous climate change. However, even if the world keeps the average annual global temperature increase to below 2 degrees Celsius, European citizens and business will be affected by the adverse effects of inevitable climate change and therefore will have to adapt cost-effectively.
The European Commission adopted the White Paper on Adaptation to Climate change in April 2009 outlining the Union's policy framework for action to improve Europe's resilience to climate change. The 33 actions announced in the White Paper are now in the final stages of implementation (see Table 15 in SWP).
Climate-ADAPT, the European Climate Change Adaptation Platform (http://climate-adapt.eea.europa.eu/) for information sharing, was successfully launched in March 2012. The number of hits per day is close to 1000. Climate-Adapt fosters a better understanding of the state of play of research on adaptation and adaptation policies, projects, programmes and frameworks. Adaptation case studies and good practices are made available, as well as a mapping of national and international activities.
The European Union's Adaptation Strategy is under preparation and foreseen for adoption in Spring 2013. The general aim of the EU Adaptation Strategy is to identify actions at EU level that will contribute to making Europe climate resilient, and to do so at the lowest possible cost. This means enhancing the EU's preparedness and capacity to respond to the impacts of climate changefocusing in particular on transboundary issues and sectors that are closely integrated at EU level through common policies.
6. SITUATION IN THE UNION'S CANDIDATE COUNTRIES
Between 199017 and 2010 Croatia's GHG emissions decreased by 9%, and compared to 2009 they decreased by 2%. However, according to the GHG projections included in the 5th National Communication, Croatia is projected to face difficulties with achieving its Kyoto target with the current set of policies and measures.
Iceland's GHG emissions between 1990 and 2010 increased by 30% and in 2010 were 3.4% lower than in 2009. Taking into account decision 14/CP.7, and according to the GHG projections included in the 5th National Communication, Iceland is on track to meet its Kyoto target.
Turkey’s GHG emissions increased by 115% between 1990 and 2010 and 8.7% between 2009 and 2010. While Turkey is an Annex I Party, it has no GHG target under the current 1st commitment period of the Kyoto Protocol.