FLUORESCENT CARBON DIOXIDE INDICATORS
Andrew Mills* and Stephanie Hodgen
1. INTRODUCTION
There are few analytes in the world as significant as carbon dioxide, equal, as it is, in importance as oxygen and pH. Carbon dioxide is a basic chemical feedstock of life, which when coupled with green plant photosynthesis1, i.e.
CO2 + H2O ⎯sunlight⎯⎯⎯→ C(H2O) + O2 (1)
where C(H2O) is a reduced form of carbon such as a sugar or starch, generates the fuel
and food necessary for the continued existence of most known forms of life. The reverse of reaction (1) is the basis of most cell metabolism, releasing, as it does, the energy for life. Thus, not only is carbon dioxide usually an essential ingredient to make the prerequisite chemicals for life, it is also often used as an indicator of the existence of life and a measure of health. For example, in medicine, the key, basic analytes that are routinely monitored in the blood of hospital patients are: dissolved oxygen, pH and carbon dioxide2. In clinical chemistry, a whole area devoted to the monitoring of the
levels of carbon dioxide in breath has emerged, i.e. capnography, in which not only the level of carbon dioxide is important, but also its temporal variation, since both provide valuable medical diagnostic information3.
The use, presence and measurement of carbon dioxide is also important in many industries. For example, in many biotechnology industries the measurement of carbon dioxide levels forms an important part of process control. Nowhere is this more important than in the brewing industry, where the continuous monitoring of carbon dioxide levels during the fermentation process is vital for: high product yields, minimal unwanted, and not very tasty, by-products, and an optimized control strategy4.
In the food industry, a revolution in food packaging has come about through the use of carbon dioxide in modified atmosphere packaging (MAP)5. In MAP the food package
is flushed with an oxygen-free gas, usually carbon dioxide, before being sealed and sent off to the wholesale or retail trader. By gas flushing the food package in this way,
________________________________
* Andrew Mills and Stephanie Hodgen, Department of Pure and Applied Chemistry, University of Strathclyde, Glasgow, G1 1XL, UK
oxygen is removed and, as a consequence, aerobic spoilage microbes cannot thrive. As a result, the food contained within a MAPed package will keep typically 3-4 times longer, without recourse to chemical preservatives, which are becoming increasingly unacceptable to the consumer. This form of packaging is now routinely used in the packaging of a wide variety of foods, including: bread, biscuits, cakes, pastries, nuts, sweets, coffee, tea, wholefat, dry foods, processed, smoked and cured meats, dairy products, fresh and pre-cooked pasta and noodles and pet food, to name but a few5.
Carbon dioxide is commonly used as the flush gas in MAP, mainly because it is plentiful (0.03% of air is carbon dioxide), easily liquefied (critical temperature = 31ºC, critical pressure = 72.9 atm) and, therefore, inexpensive. In addition, high levels of carbon dioxide have an antimicrobial action by reducing the rate of microbe metabolism even if oxygen is present5. As a consequence of its use in MAP the detection and measurement
of carbon dioxide is very important in the food packaging industry.
Because of its low critical temperature and pressure, and chemical inert nature, carbon dioxide also features strongly in the use of supercritical fluids to dissolve and extract substances, most notably caffeine from coffee beans to generated decaffeinated coffee. Thus, in many industries, the use, or presence, of carbon dioxide is commonplace and its measurement and continuous monitoring often essential.
The measurement of carbon dioxide levels is also an important feature of environmental monitoring, providing, as it does, a rough gauge of the health of the environment under test. Thus, stagnant lakes and rivers are often characterized by high levels of dissolved carbon dioxide. The levels of carbon dioxide in our atmosphere are routinely monitored worldwide by environmentalists interested in the greenhouse effect of this gas on the Earth’s delicately balanced biosphere6. The major source of carbon
dioxide in the biosphere is combustion, generated by industry, domestic heating, burning, biomass degradation and fermentation. Knowledge of the levels of carbon dioxide in the atmosphere is obviously important, but just as important, if not more so, is that of the levels of carbon dioxide in the oceans, since these contain 60% more carbon dioxide than in the atmosphere! The oceans, by acting as a vast carbon dioxide reservoir, help reduce the effect of carbon dioxide as a greenhouse gas and so lower the potential of global warming6. Monitoring the levels of carbon dioxide in the atmosphere and hydrosphere is
particularly important since they are not in equilibrium with each other and the rate of exchange between the two, which is so very important to the continued existence of life on this planet, depends on a wide variety of parameters including: atmospheric pressure, wind, humidity and temperature.
The quantitative and qualitative analysis of carbon dioxide in the gas phase is often routinely carried out using infra-red spectroscopy. However, the latter is prone to interference and requires long path lengths, and bulky and expensive equipment which lacks mechanical stability. Gas phase measurements of carbon dioxide are also often carried out by gas chromatography, usually using a molecular sieve column and a thermal conductivity detector. However, such instrumentation is expensive and usually requires a trained technician for its routine operation and maintenance. The measurement of dissolved carbon dioxide in an aqueous medium (e.g. riverwater, salt water or blood) via
serious challenge7,8. This electrode utilises a pH electrode, placed in contact with a
thin layer of an aqueous sodium bicarbonate solution, trapped behind a gas-permeable, ion-impermeable membrane. Carbon dioxide in the test medium diffuses through the gas-permeable membrane and causes a change in the pH of the trapped bicarbonate layer that is measured by the pH electrode. The key equilibria associated with this process are reported a little later in this article and, as we shall see, these equilibria allow the measured pH to be simply related to the partial pressure of carbon dioxide, PCO2, in the
test medium. Unfortunately, the Severinghaus electrode is bulky, quite expensive, prone to electrical interference, affected by acidic or basic gases, and exhibits slow response and recovery times. Other problems include: effects of osmotic pressure (caused by variable salt conditions in the test sample), reference electrode contamination and liquid junction fouling. These electrodes are also quite expensive, usually quite delicate, and require high and regular maintenance. Finally, the Severinghaus electrode does not have a disposable transducer.
In recent years there has been a growing interest in the development of optical sensors for a wide variety of analytes9-16. Such sensors are usually sensitive, robust,
rapid-in-response, inexpensive, easily miniaturised and do have a disposable transducer. In addition, through fibre optics, optical sensors offer the possibility of remote, continuous, multianalyte analysis in low volume locations, such as the artery of a premature baby. Optical sensors are usually either colourimetric, i.e. characterised by a change in colour, or lumophoric, i.e. characterised by a change in luminescence intensity, IL, or lifetime, τ. In this paper the basic concepts behind the major, and some minor,
different luminescent optical sensors for carbon dioxide that have been reported in the literature are discussed and illustrated.
2. THE TWO TYPES OF CARBON DIOXIDE OPTICAL SENSOR SYSTEMS
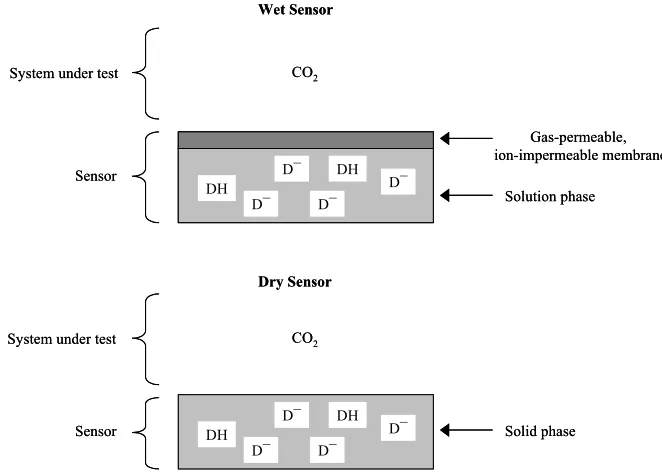
Almost all of the optical sensors for carbon dioxide (colourimetric and lumophoric) can be classified initially into one of two major categories, namely: wet or dry sensors.
2.1 Wet Optical Sensors for Carbon Dioxide
The basic characteristics of any wet carbon dioxide optical sensor are: (i) a pH-sensitive dye (anionic form, D-;protonated form, DH), (ii) a luminescent dye (dyes (i)
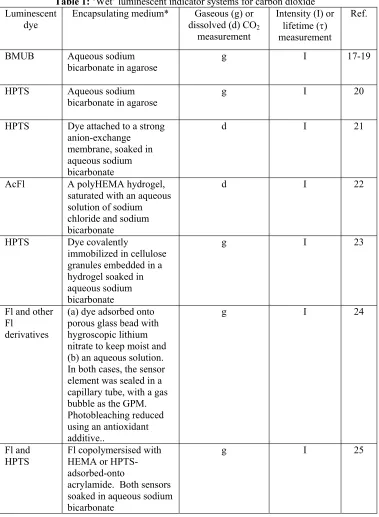
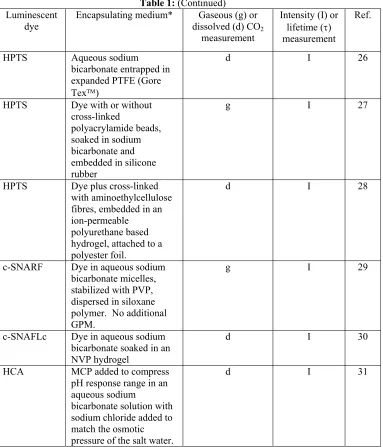
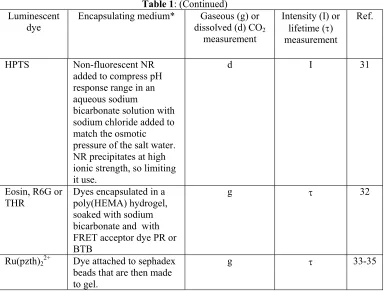
and (ii) are usually one and the same), (iii) an aqueous encapsulation medium, usually containing some sodium bicarbonate, in which the dye(s), (i) and (ii), are dissolved or dispersed and (iv) a gas-permeable, ion-impermeable membrane (GPM) used to cover the wet sensor layer. A schematic illustration of such a typical wet optical sensor for carbon dioxide and its features is given in figure 1. Table 1 lists many of the wet optical sensors for carbon dioxide that have been reported to date and provides details of: (i) the luminescent dyes and encapsulating solutions used, (ii) what kind of analyses they were used for, i.e. gaseous or dissolved carbon dioxide, and (iii) the type of measurement required, i.e. luminescence intensity or lifetime17-35. A key to all the abbreviations
DH DH
D¯ System under test
Sensor
CO2
Sensor
CO2 System under test
Wet Sensor
Dry Sensor
Solution phase
Solid phase Gas-permeable, ion-impermeable membrane
D¯ D¯
D¯
DH DH
D¯
D¯ D¯
D¯ DH DH
D¯ System under test
Sensor
CO2
Sensor
CO2 System under test
Wet Sensor
Dry Sensor
Solution phase
Solid phase Gas-permeable, ion-impermeable membrane
D¯ D¯
D¯
DH DH
D¯
D¯ D¯
[image:4.595.153.484.181.418.2]D¯
Figure 1. Schematic illustration of the main features of the two different optical sensors for carbon dioxide, namely wet and dry sensors.
The basic principles of operation behind all wet optical sensors for carbon dioxide are very simple and similar to those that underpin the Severinghaus carbon dioxide electrode7. Thus, in a typical wet optical sensor for carbon dioxide, the carbon dioxide in
the test medium (gaseous or aqueous) diffuses through the GPM, see figure 1, and rapidly (usually within a few seconds to minutes) establishes an equilibrium with the entrapped aqueous layer of the optical sensor. In an aqueous solution in contact with carbon dioxide the following equilibria are set up7,8:
CO2(g) ⇔ CO2(aq) (2)
K1 = 3.3x10⁻² mol.dm-3.atm-1
CO2(aq) + H2O ⇔ H2CO3 (3)
K2 = 2.6x10⁻³
H2CO3 ⇔ H+ + HCO3- (4)
K3 = 1.72x10⁻⁴ mol.dm-3
HCO3- ⇔ H+ + CO32- (5)
If, as is usually the case, the solution also contains sodium hydroxide or sodium bicarbonate at some known concentration [Na+], it can be shown that at equilibrium the
relationship between the partial pressure of carbon dioxide, PCO2, and the proton
concentration in the aqueous solution is as follows: [H+]3 + [H+]2[Na+] - K
w[H+]
α.PCO2 = [H2CO3] = ⎯⎯⎯⎯⎯⎯⎯⎯⎯⎯⎯⎯⎯⎯ (6)
K3([H+] + 2K4)
Where α = K1K2[H2O], and Kw is the water dissociation constant (Kw = [H+][OH-] = 10-14
mol2dm-6).
The Severinghaus electrode takes advantage of the above set of equilibria, i.e. the acidic nature of carbon dioxide, and monitors the value of the PCO2 in the test medium via
the pH change it induces in the entrapped sodium bicarbonate layer using a pH electrode. In the Severinghaus electrode, and most wet optical sensors for carbon dioxide, the level of sodium bicarbonate in the trapped internal aqueous layer is sufficiently high (typically 10-2 mol.dm-3) that eqn. (6) reduces to:
α.PCO2 = [H2CO3] ≈ [H+][Na+]/K3 (7)
i.e. PCO2 is proportional to [H+].
Most of the wet optical sensors for carbon dioxide listed in Table 1 exploit the same equilibria as the Severinghaus electrode, but use a pH sensitive dye (DH/D-), rather than a
pH electrode, to determine the acid concentration [H+], in the thin aqueous bicarbonate
layer. In an aqueous solution containing a luminescent pH-sensitive dye, the key equilibria are summarised by eqn.s (2)-(5) and, the following transduction step:
DH ⇔ H+ + D- (8)
Ka (DH)
Where DH and D- are the protonated and deprotonated form of the dye and K
a (DH) is
the acid dissociation constant for the dye; note: by definition, pKa = -log(Ka).
DH and D- usually have completely different absorption and emission spectral
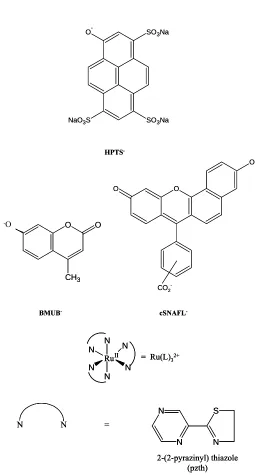
properties. The fluorescent pH-indicating dye, 1-hydroxy-pyrene-3,6,8-trisulfonate (pyranine), or HPTS for short, so often used in optical sensors for carbon dioxide (see Table 1), provides a good illustration of an almost ideal lumophore for use in luminescence, intensity-based sensors for carbon dioxide. The structure of D- for HPTS
is illustrated in fig. 2 and the photochemical properties of both D- and DH for HPTS are
summarised36,37 in table 2 and their features illustrated
via the reaction scheme in fig. 3.
It can be seen from this data that the protonated and deprotonated forms of HPTS have very different λmax absorption and emission values and that over a wide pH range any
luminescence is due to the electronically excited state of D-, i.e. HPTS-, which
luminesces at 510 nm, even if DH is excited. HPTS is often used as the pH indicator in carbon dioxide optical sensors because of its: (i) near-ideal pKa for monitoring changes in
PCO2 associated with patient monitoring, (ii) high stability and water solubility, (iii)
Table 1: ‘Wet’ luminescent indicator systems for carbon dioxide Luminescent
dye
Encapsulating medium* Gaseous (g) or dissolved (d) CO2
measurement
Intensity (I) or lifetime (τ) measurement
Ref.
BMUB Aqueous sodium bicarbonate in agarose
g I 17-19
HPTS Aqueous sodium
bicarbonate in agarose g I 20
HPTS Dye attached to a strong anion-exchange
membrane, soaked in aqueous sodium bicarbonate
d I 21
AcFl A polyHEMA hydrogel, saturated with an aqueous solution of sodium chloride and sodium bicarbonate
d I 22
HPTS Dye covalently
immobilized in cellulose granules embedded in a hydrogel soaked in aqueous sodium bicarbonate
g I 23
Fl and other Fl
derivatives
(a) dye adsorbed onto porous glass bead with hygroscopic lithium nitrate to keep moist and (b) an aqueous solution. In both cases, the sensor element was sealed in a capillary tube, with a gas bubble as the GPM. Photobleaching reduced using an antioxidant additive..
g I 24
Fl and HPTS
Fl copolymersised with HEMA or HPTS-adsorbed-onto
acrylamide. Both sensors soaked in aqueous sodium bicarbonate
Table 1: (Continued) Luminescent
dye Encapsulating medium* dissolved (d) COGaseous (g) or 2
measurement
Intensity (I) or lifetime (τ) measurement
Ref.
HPTS Aqueous sodium
bicarbonate entrapped in expanded PTFE (Gore Tex™)
d I 26
HPTS Dye with or without cross-linked
polyacrylamide beads, soaked in sodium bicarbonate and embedded in silicone rubber
g I 27
HPTS Dye plus cross-linked with aminoethylcellulose fibres, embedded in an ion-permeable polyurethane based hydrogel, attached to a polyester foil.
d I 28
c-SNARF Dye in aqueous sodium bicarbonate micelles, stabilized with PVP, dispersed in siloxane polymer. No additional GPM.
g I 29
c-SNAFLc Dye in aqueous sodium bicarbonate soaked in an NVP hydrogel
d I 30
HCA MCP added to compress pH response range in an aqueous sodium
bicarbonate solution with sodium chloride added to match the osmotic pressure of the salt water.
d I 31
Table 1: (Continued) Luminescent
dye Encapsulating medium* dissolved (d) COGaseous (g) or 2
measurement
Intensity (I) or lifetime (τ) measurement
Ref.
HPTS Non-fluorescent NR
added to compress pH response range in an aqueous sodium
bicarbonate solution with sodium chloride added to match the osmotic pressure of the salt water. NR precipitates at high ionic strength, so limiting it use.
d I 31
Eosin, R6G or
THR Dyes encapsulated in a poly(HEMA) hydrogel, soaked with sodium bicarbonate and with FRET acceptor dye PR or BTB
g τ 32
Ru(pzth)22+ Dye attached to sephadex
beads that are then made to gel.
g τ 33-35
[image:8.595.137.522.158.449.2]* unless stated otherwise all sensors covered by a GPM (silicone rubber or PTFE usually)
Table 2: Photochemical and Chemical Characteristics of HPTS in aqueous solution36,37
and in a plastic film*
Property HD D
-Aqueous solution
Absorption λmax/nm 403 455
Emission λmax/nm 435 512
Excited state lifetime/ns 5.3 4.8
pKa of HPTS 7.3-8.0
pKa of excited HPTS 1.4
Plastic film*
Absorption λmax/nm 394 467
Emission λmax/nm 440 517
SO3Na O
-NaO3S SO3Na
HPTS
-O O
O
-CO2
-cSNAFL
-O O
OH
CH3
BMUB
--O
SO3Na O
-NaO3S SO3Na
HPTS
-O O
O
-CO2
-cSNAFL
-O O
OH
CH3
BMUB
--O
N
N S
N
2-(2-pyrazinyl) thiazole (pzth)
N N =
= Ru(L)32+
RuII
N
N N N
N N
N
N S
N
2-(2-pyrazinyl) thiazole (pzth)
N N =
N
N S
N
2-(2-pyrazinyl) thiazole (pzth)
N N =
= Ru(L)32+
RuII
N
N N N
N N
= Ru(L)32+
RuII
N
N N N
[image:9.595.194.449.159.634.2]N N
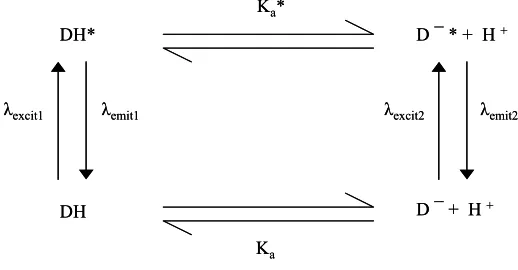
From the data given in table 2 and the schematic illustration of the major processes associated with HD and D-, in fig. 3, it would appear that by simply monitoring the
emission intensity at 512 nm, due to D-*,of an internal aqueous HPTS solution containing
sodium bicarbonate, covered by a GPM, generated using λexcit = 455 nm, it should be
possible to determine the proton concentration of the internal aqueous solution and, via eqns. (7) and (8), the level of PCO2 in the external medium under test. If HPTS is used
under such conditions, provided the concentration of dye used is very small compared to that of the buffer, sodium bicarbonate, then eqns. (7) and (8) can be combined to yield the following expression:
α.PCO2 = [H2CO3] ≈ Ka[DH][Na+]/(K3.[D-]) (9)
Provided the pH sensing dye is optically dilute, i.e. absorbance at λexcit is typically < 0.1,
then IL, the sensor film luminescence due to D-*, in the presence of carbon dioxide at a
level of PCO2,will be proportional to [D-]. Thus, eqn. (9) becomes:
α.PCO2 = [H2CO3] ≈ Ka(ILo-IL)[Na+]/(K3.IL) (10)
where ILo is the measured luminescence intensity for the system in the absence of carbon
dioxide, i.e. when all the dye, HPTS in this case, is in its deprotonated form, D-. Note that
as a consequence of eqn. (10), the smaller the concentration of sodium bicarbonate, the narrower and lower the dynamic range of the carbon dioxide optical sensor.
DH
λexcit2 λemit2 λemit1
λexcit1
D ¯ * + H +
DH*
Ka*
D ¯ + H +
Ka DH
λexcit2 λemit2 λemit1
λexcit1
D ¯ * + H +
DH*
Ka*
D ¯ + H +
[image:10.595.191.450.440.575.2]Ka
Figure 3. Schematic illustration of the major processes36,37 associated with the electronic excitation of either the protonated, DH, or deprotonated, D-, forms of a luminescent, pH-sensitive dye, such as HPTS. Usually, the pKa of the electronically excited state of DH is much lower than that of its ground state, i.e. pKa* << pKa. As a consequence over a wide range of pH the only luminescence that will be observed is due to D-* even if DH is excited. This is certainly the case for D = HPTS.
optical sensors for carbon dioxide are notoriously sensitive to changes in temperature, ionic strength (relevant to dissolved carbon dioxide measurements) and humidity (relevant to gaseous carbon dioxide measurements), and this fact should never be forgotten.
One of the first luminescence intensity-based wet optical sensors for carbon dioxide, featured in table 1, was reported by Lübbers and Opitz17-19 in 1975, using the pH sensitive dye, β-methyl umbelliferon, BMUB, (λexcit(D-) 357 nm; λem. (D-*) 445 nm), dissolved in a
thin aqueous layer containing: 5 mmol dm-3 sodium bicarbonate with 1% agarose added
for improved mechanical stability and covered by a gas-permeable, ion-impemeable membrane, such as PTFE. Eight years later these same authors reported the first ‘wet’ optical HPTS sensor for carbon dioxide, using otherwise the same formulation as their PTFE/BMUB/agarose/sodium bicarbonate sensor20. Figure 4(a) illustrates a typical set of
excitation spectra (λem. = 510nm) reported by these workers for their
PTFE/HPTS/agarose/sodium bicarbonate sensor as a function of PCO2. Figure 4(b)
illustrates the observed variations in IL as a function of PCO2 for the Lübbers and Opitz
HPTS carbon dioxide sensor for 3 different concentrations of sodium bicarbonate in the thin aqueous layer. From eqn. (10) a plot of the sensor’s luminescence intensity at 510nm, IL, in the following form: (ILo-IL)/IL as a function of PCO2 should generate a
straight line with a zero intercept. This prediction is confirmed for the Lübbers and Optiz HPTS carbon dioxide sensor by the plot of the results in fig. 4(b) in this latter format, illustrated in the insert diagram of fig. 4(b) for a range (1-6 mM) of different concentrations of sodium bicarbonate in the thin aqueous layer. Note the decrease in sensitivity of the optical sensor with increasing sodium bicarbonate concentration, as predicted by eqn. (10) and highlighted earlier.
Most optical sensors for carbon dioxide give a response curve, i.e. IL vs. PCO2 curve,
similar in nature to those illustrated by the main diagram in fig. 4(b). Given the nature of eqn (10), it is not surprising to note that such sensors are said19,38 to exhibit a hyperbolic
response, or to be hyperbolic-type sensors. One of the common features of a hyperbolic response sensor is a shorter response time (say for 90% of the overall signal change) than the corresponding recovery time, with the difference increasing with increasing magnitude in the change in PCO2. This feature is readily explained if the response and
recovery process are both controlled by the same process, such as the diffusion of carbon dioxide into and out of the sensor38.
The pioneering work of Lübbers and Opitz17-20 in the area of optical sensors for
carbon dioxide helped encourage the subsequent generation of many other luminescence intensity-based optical sensors for carbon dioxide, as indicated by the extensive list in table 1. Subsequent variations on the Lübbers and Opitz wet luminescence intensity-based carbon dioxide optical sensor include using the dye encapsulated in, or bound to, a sponge like material, soaked in an aqueous sodium bicarbonate solution26, or
the dye attached to an inert support in a ‘sea’ or gel of bicarbonate solution23,27,28. In all
R
el
at
ive
Inte
nsi
ty
1
0
300 350 400 450 500
λ/nm
R
el
at
ive
Inte
nsi
ty
1
0
300 350 400 450 500
λ/nm
(a)
0 0.2 0.4 0.6 0.8 1 1.2
0 30 60 90 120
PCO2/torr
IL
/I
oL
0 1 2 3 4
0 20 40 60 80 100 120
PCO2/torr
(I
oL
-I
L
)/I
L
[image:12.595.186.465.135.579.2](b)
Figure 4. (a) Typical corrected excitation spectra (λem. = 510 nm) for a wet optical sensor for carbon dioxide comprising: PTFE/HPTS/agarose/sodium bicarbonate solution, when exposed to the following levels of % CO2 in the gas phase under test (from top to bottom): 0, 1, 2, 4, 7, 10, 20 and 100, respectively20. (b) Plot of the relative intensity of emission (IL/IL0) exhibited by a PTFE/HPTS/agarose/sodium bicarbonate solution optical sensor (λexcit. = blue LED (λmax = 490 nm); λem. = 510 nm) as a function of PCO2, with the concentration of the sodium bicarbonate used set at: 6 (♦), 3 (c) and 1 (•) mM, respectively. The insert diagram illustrates the good linear relationship between (IL0- IL)/ IL and PCO2, for the three different films as predicted by eqn. (10)20.
pH-sensitive dye, such as HPTS as a function of PCO2. However, in at least one case
listed in table 1, luminescence lifetime, τ, measurements are used instead to ascertain the pH of the internal aqueous sodium bicarbonate solution and so, via eqn. (10), the partial pressure of carbon dioxide in the external test medium32. This example uses a very
different method of transduction, pioneered by Lakowicz and his co-workers, which involves the use of long-range, non-radiative Fluorescence Resonance Energy Transfer (FRET)32. In this and all FRET sensing systems for carbon dioxide reported here the
colour change exhibited by a pH-insensitive colourimetric dye (the acceptor, A-) is used
to affect the decay time of a, usually, pH-sensitive lumophore (the donor, D). In such sensor systems, the electronically excited state of the donor lumophore, i.e. D*, is usually quenched by the deprotonated form of the acceptor pH-sensitive dye, A- i.e.
D* + A- ⎯⎯FRET⎯⎯→D + A-* (11)
Where A-* is the electronically excited state of the deprotonated acceptor, A-*. Typically
A-* undergoes rapid non-radiative decay to return to the ground-state of the dye, A-, i.e.
A-* does not usually luminesce and, if it does, not at the same wavelengths as D*. The
protonated form of the quencher, AH, is assumed either not to quench D* or, if it does, at a rate that is significantly lower than that for A-.
In a FRET-based carbon dioxide sensor, in the absence of carbon dioxide the pH of the encapsulation medium, in this case aqueous sodium bicarbonate, is initially set sufficiently high that all, or most of the pH-sensitive, colourimetric acceptor dye is present in its anionic form, A-, and thus should, ideally, quench the pH-insensitive,
electronically-excited luminescent donor dye molecules, D*, very effectively and efficiently via reaction (11). As a consequence, the lifetime of the luminescent donor will be very short and at a minimum value, τ0, in the absence of any carbon dioxide in the
medium under test. However, if carbon dioxide is present, then the pH of the sensor’s encapsulation medium will be decreased and the concentration of the acceptor quencher, in reaction (11), A- will decrease, due to the following equilibrium:
A- + H+ ⇔ AH (12)
1/Ka(AH)
where Ka(AH) is the acid dissociation constant for the protonated form of the acceptor,
AH. As a consequence, D* will be less quenched via reaction (11) the higher the level of carbon dioxide in the test medium. Consequently, the measure lifetime of D*, τ, will increase with increasing PCO2, i.e. τ > τ0. As noted above, this transduction process
presumes that AH doesn’t itself quench D*, and this assumption appears fairly reasonable given the stringent conditions required to observe efficient quenching of an electronically excited donor by FRET in the first place.
Thus, in order for FRET to be most effective the following conditions need to be satisfied: (i) the absorption spectrum of the colourimetric acceptor should overlap strongly with the emission spectrum of the lumophoric donor, (ii) both transitions, D* → D and A- → A-*, should be highly allowed and, finally, (iii) (for unlinked D-A
pairs) A- should be
ca. 1-10 mmol.dm-3 (so that D and A- are within the Förster
In the pioneering work of Lakowicz and his co-workers on FRET optical sensors for carbon dioxide, the donors used were: Texas Red Hydrazine (TRH), Eosin and Rhodamine 6G (R6G) and the acceptors used were: Bromothymol Blue (BTB) and Phenol Red (PR)32. In this work and most, if not all, lifetime-based optical carbon
dioxide sensor studies, the lifetime of the luminescent donor at different levels of PCO2
were determined by a phase-modulation technique39. In this method the increase in lifetime of the donor is detected in the frequency, rather than the time, domain, as a change in the phase angle, between the modulated excitation light and the forced oscillation of the emission from the electronically excited donor molecules. The experimental observables are the shift in phase angle of the emission, φ, and its modulation, m, in intensity, both relative to the phase and modulation of the source. An
average decay time, τ, can be calculated from the phase angle shift or modulation through either one of the following equations39:
tan φ = ωτ (13)
and
m = (1 + ω2τ2)-½ (14)
where ω is the angular modulation frequency (= 2πf, where f = frequency in Hz of the
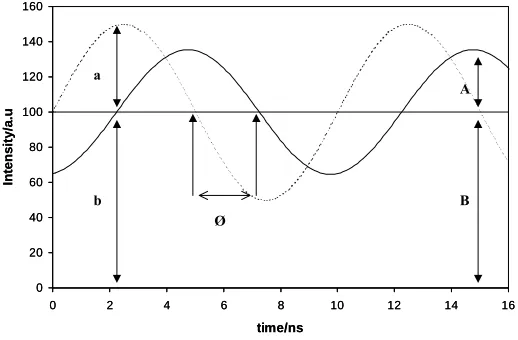
modulated excitation light). A simple illustration of the output of a phase-modulated system is illustrated in figure 5. The broken line depicts the sinusoidal variation in excitation light, in this case set at a typical value f = 100 MHz, as a function of time. The
solid line shows how the emitted light intensity generated by a fluorophore, with a lifetime, τ, (in this case τ is set at 10ns), comparable to 1/f would vary as a function of
time if it absorbed some of the excitation light. Due to the finite lifetime of the excited state, the emission will be delayed in time relative to the excitation, which is measured as a phase shift, φ, which can be used to calculate τ via eqn. (13). The relative amplitude of the emission is also reduced compared to that of the excitation. This process of demodulation allows the parameter, m, to be calculated via the following equation:
m = (A/B)/(a/b) (15)
using the data in figure 5. For any value of m a value of τ can be calculated via eqn. (14).
It should be briefly noted that the above equations hold only if the luminescence decay is described by a single-exponential decay. Interestingly, for FRET-based carbon dioxide sensors, and, for that matter, most FRET-based sensors, e.g. for oxygen, invariably the assumption of mono-exponential excited state decay kinetics is not valid, especially for luminescent dyes dispersed in a heterogeneous medium such as a polymer40,41.
Fortunately, as we shall see, the variation in the apparent average lifetime, as measured using phase modulation spectroscopy and eqn. (13), as a function of PCO2 still appears to
0 20 40 60 80 100 120 140 160
0 2 4 6 8 10 12 14 16
time/ns
In
tensi
ty/
a.
u
a
b
A
B Ø
0 20 40 60 80 100 120 140 160
0 2 4 6 8 10 12 14 16
time/ns
In
tensi
ty/
a.
u
a
b
A
[image:15.595.198.457.174.344.2]B Ø
Figure 5. Schematic illustration of the variation in intensity of a modulated excitation light source (broken line) operating at a frequency = 100 MHz and the resulting phase-shifted luminescence (solid line) generated by a lumophore, which absorbs some of the excitation light, with a lifetime of 10 ns. Under such conditions, from eqn. (13), φ = 86.96° (≡ 2.25 ns). “A” and “B” and “a” and “b” in this diagram are the measured “amplitude” and “background” light intensity levels for the lumophore and excitation source, respectively, from which a value for m can be calculated using eqn. (15).
Typically, for any FRET-based sensor system, an optimum single modulation frequency is chosen, typically f ≅ 1/τ, and the values of φ exhibited by the FRET-based
sensor are then measured as a function of PCO2. Thus, Lakowicz and his co-workers used
f = 133 or 155 MHz in their early studies of FRET-based wet optical sensors for carbon
dioxide32 using the donor-acceptor pairs: TRH-BTB, Eosin-PR and R6G-PR in a
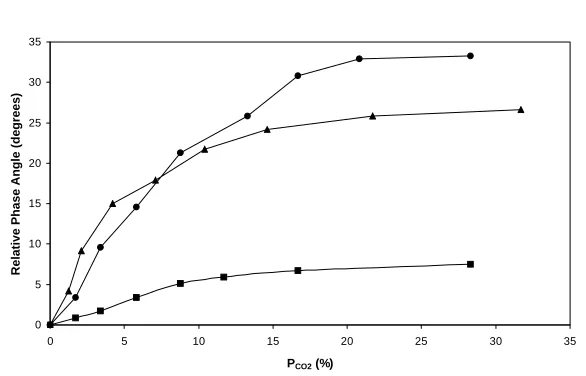
poly(HEMA) hydrogel noted earlier. The observed variations of the relative phase angle shifts as a function of PCO2 for these three different sensors are illustrated in fig. 6 and
show that the TRH-BTB and Eosin-PR sensors are particularly responsive to variations in the level of carbon dioxide using FRET32.
0 5 10 15 20 25 30 35
0 5 10 15 20 25 30 35
PCO2 (%)
Relative Phase Angle (degrees)
[image:16.595.176.469.144.332.2]Figure 6. Dependence of the donor relative phase angle on PCO2 for a series of different donor-acceptor pairs in a poly(HEMA)-hydrogel at 25°C. The donor-acceptor pairs used were: THR-BTB (λem. = 600 nm; f = 133 MHz) (•), Eosin-PR (λem. = 580 nm; f = 155 MHz) (c); and R6G-PR (λem. = 600 nm; f = 133 MHz) ( ). In all cases λexcit. = 543 nm32.
Some of the difficulties associated with luminescence intensity measurements can also be obviated using a simple wavelength-ratiometric method. For example, Uttamlal and Walt developed a fibre-optic carbon dioxide sensor for fermentation monitoring26, in
which the lumophore, HPTS, was dissolved in a sodium bicarbonate solution and entrapped in an expanded PTFE support held at the distal end of the optical fibre by a gas permeable membrane. In this work, the luminescence emission of the optical sensor at 515 nm (due to D-*) was measured for two different excitation wavelengths, namely:
470 nm (which excites D- only) and 405 (which excites mostly DH). The ratios of the
two measured luminescence intensities, i.e. IL(470)/IL(405), were used26 to calibrate the
sensor, both in 0.45 M sodium chloride solution and distilled water, as illustrated by the data in fig. 7. By ratioing the luminescence intensities measured at the two different excitation wavelengths, it is possible to eliminate problems due to errors arising from lamp intensity fluctuations and drifts in the photodetection system. If the lumophore is present at optically dilute concentrations, (i.e. its absorbance at λexcit is <0.1 then this
ratiometric method can also compensate for changes in dye concentration. This wavelength – ratiometric compensation method26 obviously assumes that any change in
optical artefact affects both wavelengths in a similar manner and this and other underlying assumptions need to be recognised. However, the above wavelength-ratiometric technique has proved to be a popular method for reducing errors and providing reliable calibration plots for intensity-based carbon dioxide, and pH, optical sensors.
acoustic-optic modulator, working at, typically, 155 MHz. Subsequent to this work, these and other workers have attempted to address the issue of the prohibitive expense of lifetime measurements for optical sensor interrogation by studying longer-lived luminescent donor dyes in FRET-based systems that can be probed using cheap diode light sources, modulated at considerably lower frequencies, i.e. f < 100 MHz, than those
used previously. This move to more affordable lifetime measurement systems for carbon dioxide optical sensors will become more apparent in the next section.
0.45 0.65 0.85 1.05 1.25
0 0.1 0.2 0.3 0.4 0.5
Dissolved PCO2/atm IL
(470)
/IL
[image:17.595.176.461.255.440.2](405)
Figure 7. Observed26 variation is the ratio of the intensity of luminescence due to HPTS when excited at 470 and 405 nm, i.e. IL (470)/IL (405) as a function of the level of dissolved carbon dioxide, PCO2. In this work the sensor used comprised: PTFE/HPTS/sodium bicarbonate solution, with the latter two entrapped in an expanded PTFE support. The measurements were performed using 0.45 M sodium chloride (0) and distilled water (•).
In the area of optical sensors for carbon dioxide, the use of FRET has the added advantage over intensity measurements that the lumophore itself no longer needs to be pH-sensitive, which is very liberating since the number of dyes that are both pH-sensitive and luminescent are very limited. Thus, a FRET-carbon dioxide sensor can use a wide range of insensitive donor lumophores, provided a suitable colourimetric, pH-sensitive acceptor dye can be found. Fortunately, there are many such donor-acceptor dye combinations and, as a consequence, there is the potential for a wider variety of FRET-based carbon dioxide sensors than there are of luminescence-based ones.
Finally, under the heading of wet optical sensors for carbon dioxide, it is appropriate to mention the work of Orellana and his co-workers33-35 and their development of a
carbon dioxide sensor based on the quenching of a novel ruthenium (II) complex by proton transfer. In this work, the novel lumophore employed was the tris(2-(2-pyrazinyl)thiazole)-ruthenium (II) cation, Ru(pzth)32+, the structure of which is illustrated
in fig. 2. This complex is water soluble and absorbs strongly at 331 nm (εmax = 47000
dm3 mol-1 cm-1) and 460 nm (ε
proton transfer agent used to quench the ruthenium (II) complex is a Brönsted acid (HB), and was typically dihydrogen phosphate or dihydrogenphthalate. Fig. 8 illustrates the essential features of the various processes involved in the quenching of Ru(pzth)32+
(equivalent to D- in fig. 8)by HBand shows that with an aqueous solution of Ru(pzth) 32+,
with λexcit = 337 nm or 460 nm, the observed emission intensity, at λem. = 652 nm will
decrease with increasing concentration of HB through an irreversible proton transfer quenching reaction33-35.
D ¯ + HB
511nm 813nm
652nm 460nm
DH + B¯ *DH + B¯ *D ¯ + HB
kq
D ¯ + HB
511nm 813nm
652nm 460nm
DH + B¯ *DH + B¯ *D ¯ + HB
[image:18.595.191.472.269.403.2]kq
Figure 8. Sensing scheme33-35 for a carbon dioxide sensor based on the quenching of the luminescence of a dye, D-, where D-≡ Ru(pzth)
32+, by a Brönsted acid, HB, where HB = hydrogen pthalate. The vertical up and down arrows refer to the absorption and emission processes associated with D- and DH, the λ
max values of which are given next to the arrows and refer to the deprotonated and protonated lumophore Ru(pzth)32+.
As a consequence of the photochemical properties of Ru(pzth)32+, illustrated in fig. 8,
Orellana and his co-workers were able to create a novel optical sensor for carbon dioxide comprising: Ru(pzth)32+(D-) immobilised onto CM-Sephadex particles, saturated with 0.1
mol.dm-3 hydrogen phthalate (HB) buffer and covered with a silicone membrane33-35.
This wet optical sensor for carbon dioxide allows the evaluation of PCO2 through either
lifetime or intensity measurements, as illustrated by the normalised luminescence intensity or emission lifetimes results recorded for this sensor as a function of PCO2
profiles in fig. 9, by Orellana and his co-workers35.
The sensor is temperature sensitive, as most carbon dioxide optical sensors are, and exhibits a slight sensitivity towards oxygen. Orellana et al also showed34 that the
1 1.2 1.4 1.6
0 0.2 0.4 0.6 0.8 1
PCO2/atm
IL 0/I
L
(
z
) or
τ
0
/τ
(
[image:19.595.184.451.176.354.2])
Figure 9. Stern-Volmer plot of the relative luminescence intensity (ILo/ IL) or emission lifetime (τo/τ) as a function of PCO2 as reported by Orellana et al for their fibre-optic sensor for carbon dioxide. The sensor comprised: Ru(pzth)32+ immobilised onto CM-Sephadex soaked in a pH 7.25 hydrogen pthalate solution and covered with a silicone gas permeable membrane35.
The above sensor represents a very novel approach to the luminescence optical sensing of carbon dioxide, although the number of lumophores that have easily measurable lifetimes and are quenched by a proton transfer mechanism still appear very limited, even today.
Interestingly, others have recently promoted42 the possibility of generating
optical-sensors for carbon dioxide based on the quenching of an excited state by a pH-sensitive quencher. In this case, the quenching process is photoinduced electron transfer in non-aqueous solution between a fluorophore, such as naphthalene and anthracene, and an unprotonated quencher, such as an amine, which is unable, or less efficient, in its quenching ability when protonated. By combining these two features in one molecule, as in 1-naphthylmetylamine (NMA), Herman and his co-workers showed43
that the fluorescence of NMA dissolved in dioxane increased when exposed to carbon dioxide. So far only the initial results of experiments conducted in non-aqueous solution have been reported and an optical sensor for carbon dioxide based on this type of process has yet to be generated, despite its apparent promise.
2.2 Dry Optical Sensors for Carbon Dioxide
The response characteristics of wet optical sensors for carbon dioxide are altered if the water vapour pressure (for gas phase measurements) or osmotic pressure (for dissolved CO2 measurements) of the system under test is significantly different from that
will need recalibrating. The latter drawback has long been recognised and effectively restricts the use of such sensors to test and calibrate systems with osmotic, or water vapour, pressure values similar to the wet sensor itself. That is why, for example, Uttamlal and Walt calibrated26 the PTFE/HPTS/sodium bicarbonate luminescence based
sensor reported earlier in 0.45M NaCl solution, so that the calibration medium matched the ionic strength of the fermentation test medium, see fig. 7. In addition, the same group 31,25 have noted that such wet optical sensors permanently lose intensity upon
prolonged exposure at high PCO2 levels and are very slow to respond (>30 min) at very
low PCO2 levels. These drawbacks make such wet carbon dioxide sensors far from ideal.
The ideal solution to these problems is the Holy Grail of carbon dioxide sensors, namely a solid state device comprising an indicator encapsulated in a gas-permeable, ion-impermeable membrane, with no apparent aqueous solution bicarbonate layer. The key features of such a dry sensor for carbon dioxide are illustrated in fig. 2.
In 1991, Raemer and his co-workers published a patent43 on colourimetric carbon
dioxide indicators for placement of tracheal tubes, in which it was noted that tetra t-butyl ammonium hydroxide (TBAH), a phase transport agent, ‘enhanced the response of the dye’. The agent was thought to accelerate the exchange of carbon dioxide to and from a liquid phase sensor. In this work, the pH-sensitive dye was usually bound to controlled pore glass particles and, most of the sensors that utilised TBAH, gave a reversible response to carbon dioxide. These sensors clearly fall short of the ideal of a ‘solid sensor’ for carbon dioxide, since they are not encapsulated in a GPM and, therefore, not appropriate for dissolved carbon dioxide work, unless a gas-permeable membrane cover is added. In addition, they are likely to exhibit response features that are markedly affected by changes in humidity (for gas phase work). However, despite these caveats, this patent is notable as one of the first examples of phase transfer agent use in the context of optical sensors for carbon dioxide.
A real advance in solid dry sensor design came with the discovery by others44,45 that
a phase transfer agent, (PTA), such tetraoctyl ammonium hydroxide (TOAH) or, in its more general form, Q+OH-, could be used to solubilise the anionic form of a
colourimetric pH indicator dye, such as m-cresol purple (MCP), in a hydrophobic solvent,
such as toluene, that is mutually compatible with that of a water-insoluble polymer, such as ethyl cellulose (EC) or poly(vinyl butyral), (PVB). Thus, it was found that many PTA’s, i.e. Q+OH-‘s, when mixed with a pH sensitive, hydrophilic indicator dye anion, D,
form ion pairs, Q+D-, that can be dissolved in non-aqueous, and often hydrophobic,
solvents in which a variety of different hydrophobic polymers could also be dissolved. The product of such work was effectively a series of coloured inks, comprising: pH-sensitive dye/PTA/ polymer/solvent, which could be cast, by printing, doctor-blade or spin-coating, to generate a range of thin, coloured plastic films containing a pH-sensitive dye in its highly coloured, deprotonated anionic form, i.e. as Q+D-. Although this
formulation goes some way towards generating a solid dry sensor, it is not obvious why the encapsulated ion-paired dye, Q+D-, would respond to the presence of carbon dioxide.
However, it is known that associated with most ion pairs are usually a few molecules of water; thus, the PTA cation, usually a quaternary ammonium cation, pH- indicator dye anion ion-pair entrapped in a polymer film combination is more appropriately formulated as Q+D-.
xH2O. As a consequence, in the final dried ink films, the encapsulated
pH-sensitive dye anion, D-, can interact with carbon dioxide as if there is water nearby;
α Q+D-.
xH2O + CO2 ⇔ Q+HCO3-.(x-1)H2O.HD (16)
Where α is the equilibrium constant associated with the process. In order to aid the diffusion of carbon dioxide through the polymer often a plasticiser, such as tributyl phosphate (TBP), is included in the film formulation. Based on this simple formulation, i.e. dye/PTA/plasticiser/polymer/solvent, a number of different colourimetric plastic films were generated by Mills et al37,44-46 and others47 and all proved very effective as
solid-state optical sensors for carbon dioxide.
As you would expect of such solid dry sensors, research reveals that they can be used for the determination of carbon dioxide in dry and humid gases44-47 and when dissolved in
aqueous solution48. These dry films typically exhibit response and recovery times of the
order of a few seconds, and very thin films based on this technology, and which respond even faster, i.e. typically <0.1s, have been used for capnography49. In a dry gas
environment it might be expected that such solid film sensors would eventually lose their water of hydration and cease to function. However, the water of hydration associated with the ion-pair combination: PTA cation - pH-sensitive dye anion, appears very tightly bound and as a consequence it appears that these films can be used and stored under very dry conditions without any appreciable loss in performance.
When used for dissolved carbon dioxide measurements these dry optical sensors for carbon dioxide are less sensitive to changes in the osmotic pressures of the samples under test than the wet, i.e. Severinghaus, sensor types discussed so far. Silicone rubber, with its high hydrophobicity and permeability towards carbon dioxide appears a good encapsulation material for such work, although plasticised ethyl cellulose has been used to great effect to create optical sensors for carbon dioxide that can operate over the pH range 3-10. However, when such dry, ion-pair type carbon dioxide sensors are used for the continuous and prolonged measurement of PCO2 in solution then a gas-permeable,
ion-impermeable membrane cover is usually required.
Unfortunately, the presence of acidic vapours, such as the dioxides of nitrogen or sulfur, which are often found in the laboratory, have a marked and irreversible deleterious effect on the response features of dry sensors for carbon dioxide. Thus, on the open bench in a laboratory, the dye in the sensor films can change from its deprotonated (D-)
form to its protonated (DH) form, and as consequence become unresponsive, within 24h. Fortunately, in most environments, the levels of these acidic, oxidising gases are very low and so the shelf life of most ion-pair sensors are usually long (> 1 year), especially if placed in sealed bags and stored in the dark; refrigerated conditions also helps to preserve the films.
It has been suggested45 that one mode of loss of sensitivity of these ion pair dry
sensors for carbon dioxide is the thermal degradation of the phase transfer base through a Hofmann β-hydrogen elimination reaction. The rather elegant work of Chang et al50
appears to lend support to this proposal, in their study of steam sterilisable fluorescence lifetime-based sensing films for carbon dioxide. Thus, by comparing films containing the same quantity but different quaternary ammonium hydroxides, these workers found that the order of sensor film stability (with number of β-hydrogens in parenthesis) was: TOAH (8) < CTAH (2) < TMAH (0). The Q+D-.
xH2O ion pairs are so stable when
(16). Thus, nowadays CTAH appears the preferred PTA for ion-pair dry sensor films. In order to increase sensor film longevity, most researchers used a vast excess of base, i.e. Q+D-.
xH2O, in the film formulation to produce sensors with long operational and storage
lifetimes. The excess base in the thin dry film carbon dioxide sensors acts as a lipophilic bicarbonate buffer system and exists in the form of Q+HCO
3-.xH2O. Increasing the
background concentration of the excess base also appears to decrease the sensitivity of the final optical sensor, as it does in its Severinghaus type wet counterpart, see eqn. (9). Table 3 provides details of many of the dry luminescent optical films for carbon dioxide that have been reported in the literature51-70 and, as with the wet indicators, reviewed
earlier, see table 1, most are intensity- rather than lifetime-, based sensors. Almost all these sensors utilise the ion-pair technology developed by Mills et al44,45. Figure 10 gives
some of the structures of the key lumophores that are listed in table 3.
N O N+
SO3_
SO3H
SRh
N O N+
SO3_
SO3H
SRh
N N
N N
4,4-Diphenyl-2,2-dipyridyl (dph-bpy)
4,7-Diphenyl-1,10-phenanthroline (dpp)
N N =
N N =
= Ru(L)32+ RuII
N
N N N
N N
N N
N N
4,4-Diphenyl-2,2-dipyridyl (dph-bpy)
4,7-Diphenyl-1,10-phenanthroline (dpp)
N N =
N N =
= Ru(L)32+ RuII
N
N N N
N N
= Ru(L)32+ RuII
N
N N N
[image:22.595.162.489.306.671.2]N N
Table 3: ‘Dry’ Luminescent indicator systems for carbon dioxide Luminescent
dye Encapsulating medium dissolved (d)* COGaseous (g) or 2
measurement
Intensity (I) or lifetime (τ) measurement
Ref.
Fl Polyethylene glycol,
pretrated with sodium hydroxide
g I 51
HPTS Dye plus phase transfer agent, TOAH, in EC polymer with TBP as a plasticiser
g I 52,37
HPTS Dye plus phase transfer agent (TBAH, MAPTAC and CTAH) in EC and polystyrene polymer
g I 53
HPTS Dye plus phase transfer agent, TOAH, in EC with TBP as a plasticiser
d I 54
HPTS Dye plus phase transfer agent, generates HPTS
-CTA+, with excess
TOAOH, electrostatically bound to aminocellulose granules then
encapsulated in silicone rubber
d I 55
HPTS Dye plus phase transfer agent (TOAH)
encapsulated in an organically modified silica glass
g I 56,57
[Eu(tta)3] Luminescence of
europium (II) complex in polystyrene reduced, by absorption screening, using a pH indicator dye (TB, PR or CR) – TOAH ion pair, encapsulated in EC, with TBP as
plasticiser. The two films were on opposite sides of the same glass slide.
Table 3: (Continued) Luminescent
dye Encapsulating medium dissolved (d)* COGaseous (g) or 2
measurement
Intensity (I) or lifetime (τ) measurement
Ref.
HPTS Dye plus phase transfer agent, TOAH, in EC dissolved in
ethanol/toluene solvent. Viscous solution used in resevoir-type capillary optical senor with a PTFE GPM.
g I 61
HPTS Dye plus phase transfer agent, generates HPTS
-CTA+ ion-pair that is then
encapsulated in a silicone rubber film with an excess of base, CTAH
d I 62
HPTS Dye immobilized in a base-catalysed silica sol-gel by electrostatic attraction. Sensor film then covered with a hydrophobic sol-gel to reduce pH cross reactivity.
d I 63
SRh Luminescent donor dye,
SR, mixed with a non-fluorescent acceptor dye (eg. TB or MCP) with TOAH, TBP in EC to produce a plastic film suitable for FRET
g τ 64,65
SRh SR, plus MCP-CTAH in silicone rubber creates a steam-sterilizable sensor. Detection by FRET.
d τ 50
Ru(dph-bpy)32+:
Ru(dph-bpy)32+-TMS ion
pair plus TB anion – TMDA+ in an excess of
TOAH encapsulated in EC was used to prepare FRET films
Table 3: (Continued) Luminescent
dye Encapsulating medium dissolved (d)* COGaseous (g) or 2
measurement
Intensity (I) or lifetime (τ) measurement
Ref.
Ru(dph-bpy)32+:
Ru(dph-bpy)32+-TMS ion
pair plus MCP anion – TMDA+ in an excess of
TOAH encapsulated in EC was used to prepare FRET films
g τ 67
Ru(dpp)32+ Ru(dpp)32+-TMS ion pair
plus Sudan III in an excess of TOAH encapsulated in a hydrophobic silica sol-gel/EC hybrid produced films for FRET.
g τ 68
Ru(dpp)32+ Ru(dpp)32+ dye doped
nanobeads provide a luminescent reference for the luminescence of HPTS—CTA+ ion pairs,
all encapsulated in a hydrophobic organically modified silica film. Basis of sensing via DLR.
g τ 69
A luminescence intensity-based dry optical sensor film for carbon dioxide which used the phase transfer technology discussed above was reported37 as early as 1993. In
this work, the dye used was HPTS, the phase transfer agent, TOAH, the polymer, EC, and the plasticiser, TBP. In such a system, assuming eqn (16) is the key equilibrium process, then a new parameter, R, can be defined as follows:
R = (ILo – IL)/IL = α.PCO2 (17)
Where, ILo and IL are the luminescence intensities of Q+D-.xH2O in the absence and
presence of carbon dioxide, respectively. Given the similar natures of the two processes, it is not surprising to note that the wet and dry luminescence intensity-based optical sensors have very similar key equations, i.e. eqns. (10) and (17), respectively. As with eqn. (10), eqn. (17) assumes that an excitation wavelength is selected at which only Q+D-.
xH2O absorbs, and that in the absence of carbon dioxide all the dye will be in its
anionic form. The spectral properties of the first reported HPTS/TOAH/EC/TBP sensor film for carbon dioxide are given37 in table 2. Thus, the absorption and emission spectra
cation-dye anion ion pairs, and, to some extent, to the change in the polarity of the surrounding environment.
A typical example of the observed variation in luminescence intensity, measured at 517 nm and due to the deprotonated form of HPTS in a HPTS/TOAH/EC/TBP film, as a function of the partial pressure of carbon dioxide in the test medium, is illustrated37 in
fig. 11. The subsequent plot of this data in the form of R (=(ILo – IL)/IL) vs. PCO2 is
illustrated in the insert diagram in fig. 11 and reveals a reasonable straight line as predicted by eqn (17). As noted earlier, in aqueous solution the excited state of the protonated form of HPTS, i.e. DH*, emits the green light (λmax = 512 nm) associated with
the excited state of the deprotonated form of the dye, i.e. Q+D-* (see fig. 2). This
phenomenon is due to the very rapid equilibrium between DH* and D-* and H+ in
solution. However, in a solid film this equilibrium does not appear to be so well established37 and emission from DH*, or more precisely Q+HCO
-3. (x-1).H2O.HD at
440 nm is observed in a HPTS/TOAH/EC/TBP film at high PCO2 levels.
0 0.2 0.4 0.6
0 0.01 0.02 0.03 0.04 0.05 0.06
CO2/atm
IL
/(a.u.) 0
4 8
0 0.01 0.02 0.03 0.04
PCO2/atm.
[image:26.595.207.458.349.530.2]R
Figure 11. Reported37 variation in the observed luminescence intensity of a HPTS/TOAH/EC/TBP dry film sensor as a fuction of PCO2, recorded using λexcit. = 430 nm and λem. = 517 nm. The insert diagram is a replot of the data in the main diagram, where R is defined by eqn. (17).
A number of other researchers, see table 3, have subsequently used HPTS, coupled with a PTA, encapsulated in a polymer, such as EC or silicone rubber, to create similar luminescence intensity-based optical sensors for carbon dioxide. Probably the most notable of these is the high-stability, non-invasive auctoclavable naked optical sensor for dissolved carbon dioxide measurement reported by Rao et al62. The sensor film
fact that no gas-permeable membrane cover layer was used. The latter feature explains the use of the term ‘naked’ in the paper’s title62. The robustness of this sensor film
towards ion-exchange, and heat treatment (it’s autoclavable) is due to the robust and hydrophobic nature of the encapsulation polymer employed. Typical plots of the normalised emission, and excitation, spectra exhibited by this HPTS/CTAH/silicone rubber film recorded62 for this film for dissolved carbon dioxide concentrations ranging from 0-18.15% are illustrated in fig. 12. Interestingly, the optical characteristics of HPTS- in this film, and its response toward carbon dioxide, are much like they are for the
dye in aqueous solution, i.e. there is no evidence that DH* is stable and not readily dissociated in this film, unlike the HPTS/TOAH/EC films discussed earlier.
Emission Excitation
Wavelength (nm)
380 420 460 500 540 580
N
ormaliz
ed Int
ensity
0.0 0.2 0.4 0.6 0.8 1.0 1.2
(i)
(ii)
(iii)
(iv) (v)
Emission Excitation
Wavelength (nm)
380 420 460 500 540 580
N
ormaliz
ed Int
ensity
0.0 0.2 0.4 0.6 0.8 1.0 1.2
(i)
(ii)
(iii)
[image:27.595.218.444.293.522.2](iv) (v)
Figure 12. Normalised reported62 excitation and emission spectra of a naked, i.e. no GPM cover, HPTS/silicone rubber film when exposed to water purged with the following levels of carbon dioxide: (i) 0, (ii) 0.13, (iii) 0.37, (iv) 0.58 and 18.15%.
Continuing the theme of novel encapsulating media, a dry optical sensor for carbon dioxide, employing the HPTS-tetraoctyl ammonium cation ion pair has been developed56
which uses an organically modified silica glass (ormosil), rather than an organic polymer, as an encapsulation medium. In this study a relatively high humidity was maintained in all test and sample gases, since work showed the dry luminescent sensor film to be quite sensitive towards variations in humidity. The latter feature, largely absent from plastic film based sensors, appears a possible drawback to the use of ormosil in dry optical sensors for carbon dioxide.
sensor counterparts. Thus, these sensors utilise a pH-sensitive, luminescent dye, such as HTPS, encapsulated in a polymer in its anionic form using a phase transfer agent. The key equations that describe the interaction of the dye with carbon dioxide in the test medium are (16) and (17), in which it is assumed that a wavelength of excitation, λexcit, is
chosen so that only the anionic form of the dye absorbs and that the measured intensity of luminescence, IL, is due only to D-*.
A different type of luminescence intensity-based dry optical sensor for carbon dioxide has been reported recently by Nakamura and Amao58-60, using a combination of a
luminescent europium (II) complex, [Eu(tta)3], and a pH-sensitive colourimetric dye,
such as TB, PR or CR. As with almost all dry indicator systems for carbon dioxide, the pH-sensitive dyes used are always in the form of an ion pair, i.e. Q+D
-xH2O. In this
work, TOAH was used as the PTA, EC as the encapsulation polymer and TBP as the plasticiser. This indicator is, in effect, a simple, standard colourimetric dry indicator for carbon dioxide, with the added exception to its formulation of a fluorophore, [Eu(tta)3],
which is not quenched by FRET and has an absorption spectrum that overlaps with that of the anionic form of the non-luminescent, pH-sensitive dye, Q+D-.
xH2O. As a
consequence, as the level of PCO2 in the test medium is increased, the intensity of
luminescence due to [Eu(tta)3] will increase, because the concentration of Q+D-.xH2O
decreases and so, therefore, does its absorbance at λexcit. Such a decrease in absorbance
allows more of the excitation light to be absorbed by the lumophore, [Eu(tta)3], and,
therefore, the luminescence of the latter will increase intensity, the higher the level of PCO2. Typical results generated58 by three such pH-intensive lumophore/pH-sensitive
colourimetric dye type sensors, namely: [Eu(tta)3]/TB/TOAH/EC/TBP,
[Eu(tta)3]/PR/TOAH/EC/TBP and [Eu(tta)3]/CR/TOAH/EC/TBP, are illustrated in
figure 13. For this system it can be shown, via eqn.(16), that the concentration of the protonated pH-sensitive dye, i.e. [Q+HCO
-3.(x-1) H2O.DH], is related to PCO2 via the
expression:
[Q+HCO
-3.(x-1) H2O.DH] =
CO2 CO2 TOTAL
αP 1
αP D] [
+ (18)
where [D]TOTAL is the total concentration of the colourimetric, ion-paired pH-sensitive
dye in the film, i.e.[D]TOTAL = [Q+HCO-3.(x-1) H2O.DH] + [Q+D-.x H2O]. In the work of
Nakamura et al, on these [Eu(tta)3]/pH-sensitive dye films, the intensity of luminescence
of [Eu(tta)3] appears proportional to [Q+HCO-3.(x-1) H2O.DH], although this is only
expected for optically dilute systems, which these are probably not. However, given this apparent relationship, it follows that, IL is related to PCO2 via the following expression:
CO2 CO2
L 100 L
L L
αP
1 KP I I
I -I
+ =
− °
°
(19)
ILº and IL100are the intensities of luminescence of this type of film at 0 and 100% CO2,
respectively, and where K is a constant. It follows from eqn. (19) that the data illustrated in fig. 13 for this type of optical sensor can be linearised by plotting (IL100 – ILº)/(IL – ILº)
versus PCO2-1, as reported by Nakamura et al58. Like the wet FRET sensors described
luminescent dye’, overcomes the problem of the limited availability of fluorescent pH-sensitive dyes with pKa values that span a wide pH range. Instead, unlike the
FRET-based carbon dioxide sensors, this type of sensor requires only a luminescent dye which has an absorption spectrum that’s similar to that of one of the forms of the pH-sensitive, colourimetric dye. Usually, this absorption spectral overlap is between the pH-insensitive fluorophore and the anionic form of the pH colourimetric dye. As with the FRET-type sensors, the possible combinations of pH-insensitive fluorophore and pH-colourimetric dye are many. However, it is not clear what benefits this luminescence intensity-based sensor offers over its simpler, colourimetric counterpart, which has the same formulation, with the exception of the lumophore, other than it allows the measurement of PCO2 via luminescence intensity, rather than absorbance, measurements.
0 4 8 12 16 20
0 20 40 60 80 100
%CO2
Rel I
[image:29.595.193.448.317.497.2]L
Figure 13. Observed58 variation in the relative intensity of luminescence as a function of P
CO2 for three different dry ‘colourimetric with reference luminescent dye’ type sensors. The three different sensors used comprised: the lumophore [Eu(tta)3], EC/TBP and the following three different pH-sensitive colourimetric dyes: TB ( ), PR (•) or CR (c). The results of this work can be linearised using eqn. (19).
As early as 1995, researchers64 began to report FRET-based dry optical sensors for
carbon dioxide. The features of such sensors, namely a fluorescent, pH-insensitive donor (D) and a colourimetric pH-sensitive acceptor (A), with a great deal of overlap between the emission spectrum of D and the absorption spectrum of A, were much like those noted earlier for wet type, FRET–based sensors, with the exception that the pH-sensitive dye was combined with a PTA to render it soluble in a hydrophobic medium, such as a polymer. Thus, for example, Sipior and co-workers64 in their 1995 study of dry,
nitrogen gas-phase medium are illustrated in fig. 14(a), for which only the reported phase shift data for this system are illustrated. A plot of this data, recorded at a frequency of 138.14 MHz in the form of phase angle, φ, versus %CO2 is illustrated in fig. 14(b). In
such sensors the lifetime of the lumophore is at a maximum, τmax, when there is no FRET,
i.e. when all the pH-sensitive dye is protonated due to a high level of carbon dioxide in the test medium.
It follows that:
τ τmax =
other FRET other
k
k
k
+
(20)where kFRET is the rate of fluorescence resonance energy transfer and kother is the rate
constant for all other deactivations, including luminescence. Since kFRET will be
proportional to the concentration of the deprotonated pH-sensitive dye, i.e. [Q+D-.
xH2O],
then,
τ τmax -1 =
other FRET
k
k = K′[ Q+D-.
xH2O] (21)
where K′ is a proportionality constant. However, from eqn. (16) it can be shown that:
αPCO2 =
O] H . D [Q O] H . D [Q -O] H . D [Q 2 -2 -o 2 -x x x + + + (22)
where [Q+D-.
xH2O]o is the concentration of [Q+D-.xH2O] when no carbon dioxide is
present and all the pH-sensitive dye is in its deprotonated, ion-paired form. Combining eqns. (21) and (22) together the following expression can be derived:
CO2 max
max o
max αP
1) -/τ (τ 1) -/τ (τ -1) - /τ τ (
= (23)
where τo and τ are the lifetimes of the donor lumophore in the absence and presence of
carbon dioxide. or, more simply:
) 1/τ -(1/τ ) 1/τ -(1/τ max
Frequency (MHz)
Phas
e Ang
le (deg
re
es
)
100
75
50
25
0
10 20 50 100 200
Frequency (MHz)
Phas
e Ang
le (deg
re
es
)
100
75
50
25
0
10 20 50 100 200
(a)
10 20 30 40 50 60
0 1 2 3
%CO2
Phase Angl
e (degrees)
4 0
4 8 12 16
0 0.5 1 1.5 2
%CO2
R
[image:31.595.196.463.155.587.2](b)