Beyond Flexibility and Security
A composite indicator of flexicurity
CEPS Working Document No. 329/May 2010
Ilaria Maselli
Abstract
‘Flexicurity’ might be defined as a mix of flexible contractual arrangements, income support measures, active labour market policies and lifelong learning. The successful shift in approach of the Danish and Dutch labour markets from passive to active labour market policies, and to flexicurity, has attracted considerable attention among academics and policy-makers.
The objective of this Working Document is to contribute to the debate with the creation of a composite indicator to measure flexicurity, based on the definition provided in the European Commission’s Communication on Flexicurity (COM(2007)359). Our indicator confirms that preferences in the balance of flexibility and security are highly heterogeneous among countries; a finding that supports the ‘pathway’ approach as proposed by the European Commission. A second important conclusion is that the idea of flexibility being in favour of employers and security being in favour of employees needs to be overcome. Flexicurity is ‘both for both’, although it does not apply uniformly to all age groups but is two and three times greater for older and younger workers respectively.
CEPS Working Documents are intended to give an indication of work being conducted within CEPS research programmes and to stimulate reactions from other experts in the field. Unless otherwise indicated, the views expressed are attributable only to the author in a personal capacity and not to any institution with which she is associated.
ISBN 978-94-6138-007-4
Contents
1. The background ... 1
2. The construction of the index ... 3
3. Analysis of the results... 4
3.1 Cross-country comparative analysis ... 4
3.2 Flexicurity as a main determinant of employment performance... 8
Conclusions ... 11
References ... 12
List of Figures Figure 1. Employment in percent of working-age population ... 2
Figure 2.The Flexicurity Index: Input and outcome ... 4
Figure 3. The interim indicators for flexibility and security ... 5
Figure 4. Flexibility and security balance ... 6
Figure 5. High performers... 6
Figure 6. Poor performers ... 7
Figure 7. Medium performers ... 8
Figure 8. Flexicurity and employment rate (15-25years)... 10
List of Tables Table 1. Sub-indicators ... 4
| 1
B
EYOND
F
LEXIBILITY AND
S
ECURITY
A
COMPOSITE INDICATOR OF FLEXICURITY
CEPS
W
ORKING
D
OCUMENT
N
O
.
329/M
AY
2010
I
LARIAM
ASELLI*1. The
background
The so-called knowledge society, with the increasing importance of human capital, the level of educational attainment and innovation as the key drivers of growth and competitiveness, offers many new opportunities, but also places new demands on the adaptability and mobility of both employers and employees. A high level of education provides the individual citizen with a basic capacity to adapt flexibly to new conditions and to change easily from one job and one branch to another.
In fact, about 10% of jobs change occupant every year on average in the EU, implying that in a single year one person in ten will be seeking a job, or for ways of acquiring new skills, but will also be exposed to the stress inevitably associated with the increasing speed and frequency of transition in the new globalising economy. In this environment, even persons with a high level of education and, even more so, persons with lighter educational baggage increasingly need systematic information on opportunities as well as financial and administrative support in order to both stimulate and facilitate adaptability and acquire the new skills required for successful transition.
Among the EU member states, Denmark has for some time, in addition to ‘passive’ unemployment insurance schemes, provided active assistance to unemployed people in search of a job. The Netherlands, however, stands out in this respect with an example of an important change in the orientation of labour market policy in the 1990s, in particular with the adoption of a “Flexibility and Security Bill” that came into force on 1 January 1999. This shift in policy, combining in the same bill measures aimed at boosting flexibility and income security, presented as a significant shift in policy from protecting ‘jobs’ towards protecting ‘employment’, in fact also gave rise to the concept of ‘flexicurity’.
The significant shift in labour market policy in the Netherlands led to a remarkable increase in its employment rate. As shown in Figure 1, the rate of employment in the Netherlands, which from 1966 to 1990 had closely followed that of the EU average, took off in 1991 and, over the next fifteen years, climbed steeply upwards. By 2008, consequently, the Netherlands had reached the Danish employment rate; providing a striking illustration of the potential of a shift in the orientation of labour market policy.
An interesting aspect of Dutch employment policy is also its emphasis on measures to facilitate and promote part-time and temporary employment. As a result, the rise in the overall rate of employment in the Netherlands has also been accompanied by a remarkable rise in part-time employment, making it easier for women (especially) to combine child-rearing and continued participation in the labour market, thereby assuring a high degree of maintenance of human capital.
*
Figure 1. Employment in percent of working-age population 50 55 60 65 70 75 80 85 196 6 196 8 197 0
1972 197 4 197 6 197 8 198 0
1982 198 4 198 6 198 8 199 0
1992 199 4 199 6 199 8 200 0
2002 200 4 200 6 200 8 201 0
Denmark Netherlands EU15
Source: Eurostat.
Recognising that public policy may have a role to play in assisting the individual worker and the enterprise in ensuring a smooth and efficient functioning of the labour market, several decades ago Sweden and Denmark introduced mechanisms with this aim in mind. At the level of the European Union, in 1997 the European Council underlined the potential for using Active Labour Market Policies (ALMP) to boost employment and combat unemployment.
It is therefore not surprising that these experiences have attracted considerable interest among other EU member states and that, at the level of the EU, the concept of ‘flexicurity’ has gained prominence both politically and scientifically. Major steps towards a more explicit application of this concept at the level of the EU were taken in July 2006 with the creation of the European Expert Group on Flexicurity, the publication of the report by the group in June 2007,1 the Communication from the Commission of July 20072 and, more recently, an Employment Committee (EMCO) report on monitoring and analysing flexicurity policies.3
As indicated in the EMCO report (page 2) the Commission and the member states have in fact reached a consensus that flexicurity policies can be designed and implemented across four policy components. The four components are:
• Flexible and reliable contractual arrangements (from the perspective of the employer and the employee, of ‘insiders’ and ‘outsiders’) through modern labour laws, collective agreements and work organisation;
• Comprehensive lifelong learning (LLL) strategies to ensure the continual adaptability and employability of workers, particularly those most vulnerable;
• Effective active labour market policies (ALMP) that can help people cope with rapid change, reduce unemployment spells and ease transitions to new jobs;
1
Flexicurity Pathways: Turning hurdles into stepping stones, Report by the European Expert Group on Flexicurity, June 2007.
2
European Commision, DG EMPL, Unit D2, Towards Common Principles of Flexicurity: More and better jobs through flexibility and security, July 2007.
3
BEYOND FLEXIBILITY AND SECURITY |3
• Modern social security systems that provide adequate income support, encourage employment and facilitate labour market mobility. This includes broad coverage of social protection provisions (unemployment benefits, pensions and health care) that help people combine work with private and family responsibilities, such as child care.
With the aim of producing a more comprehensive and condensed assessment of the degree of flexicurity achieved by the different member states and the relations with other aspects of employment performance, this Working Document presents a first attempt to produce a
composite indicator for flexicurity. The advantage of a composite indicator is, in fact, two-fold:
• It allows an easily accessible overall estimate of the level of achievement in this field; and
• It facilitates quantitative and econometric analysis of the correlations, both within the set of indicators chosen and between the composite indicator and other indicators of economic performance.
2.
The construction of the index
The composite indicator presented below assembles input and outcome indicators that constitute a measurement of the following elements that, according to the EC Communication “Towards Common Principles of Flexicurity” (2007) are the main features of a flexicurity system:
o Flexible and reliable contractual arrangements;
o Comprehensive lifelong learning strategies to keep the labour force updated in line with the demands of companies;
o Effective active labour market policies to ease the transition to new jobs;
o Modern social security systems that provide income support and family facilities.
Input indicators quantify information on legislation and institutions that bear on certain aspect of flexicurity. As summarised in Table 1, the flexibility interim indicator is based on the Employment Protection Legislation (EPL) index produced by the OECD. Admittedly this choice attributes a considerable weight to this indicator, but examination of the alternatives suggests both that other input indicators, such as the World Bank index of the facility of doing business, on the one hand, is relatively well correlated with the OECD’s EPL indicator and, on the other, includes features that do not directly concern the labour market. On the ‘security’ side of flexicurity, the choice of indicators is more comprehensive and the interim indicator proposed here is based on an average of the three features indicated in the table: the OECD indicator of net replacement rates for income security, government expenditure per (unemployed) capita for ALMP and the percentage of the population that undertook training for lifelong learning. It is important that the overall composite flexicurity indicator gives equal weight to the flexibility and the security sides and this despite the fact that more indicators are used on the security side.
Table 1. Sub-indicators
Source: Own elaboration.
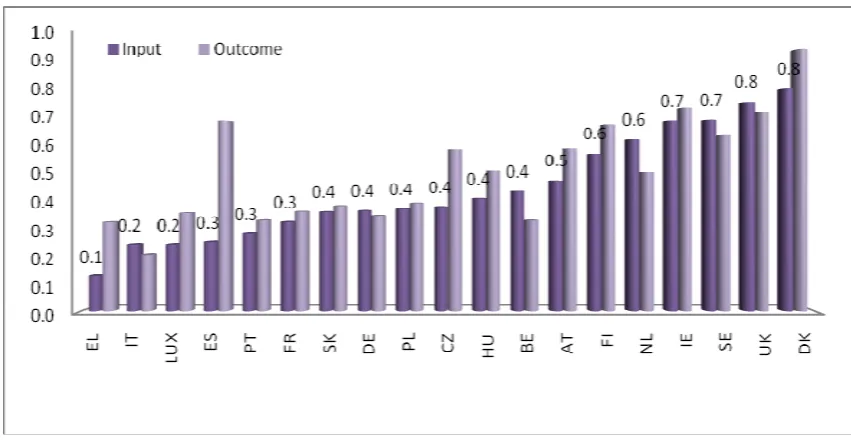
In order to have easily comparable output, all data are normalised. As a consequence also the indicator has minimum and maximum values of 0 and 1 respectively, where a value close to 1 corresponds to a perfect flexicurity regime. Figure 2 shows the ranking of each country for which data are available.
Figure 2.The Flexicurity Index: Input and outcome
Source: Own elaboration.
3.
Analysis of the results
3.1 Cross-country comparative analysis
A cross-country comparative analysis of input indicators reveals that different member states have completely different preferences for the balance between flexibility and security, as well as for the balance between active and passive labour market policies.
INPUT OUTCOME
Flexibility EPL Index by OECD Job tenure Flexibility
Income security
OECD indicator of average of net replacement rates over 60 months of unemployment
Risk of poverty
Active labour market policies
Government expenditure per unemployed person (corrected by GDP per capita)
Long-term unemployment
Lifelong learning Percentage of population that had training
in the 4 previous weeks n.a.
[image:6.595.84.510.394.614.2]BEYOND FLEXIBILITY AND SECURITY |5
Some of the results sketched in Figure 2 are perfectly in line with expectations: Denmark registers the highest score and the top five also include Sweden and the Netherlands. The opposite side of the chart shows Mediterranean countries. What is more surprising is the performance of the UK and Ireland. The interim indicators for flexibility and security, illustrated in Figure 3, help to unveil the mystery: both Anglo-Saxon countries have very high levels of flexibility, as one would imagine, but on the other hand, also show a decent score on the security side (0.5/1).
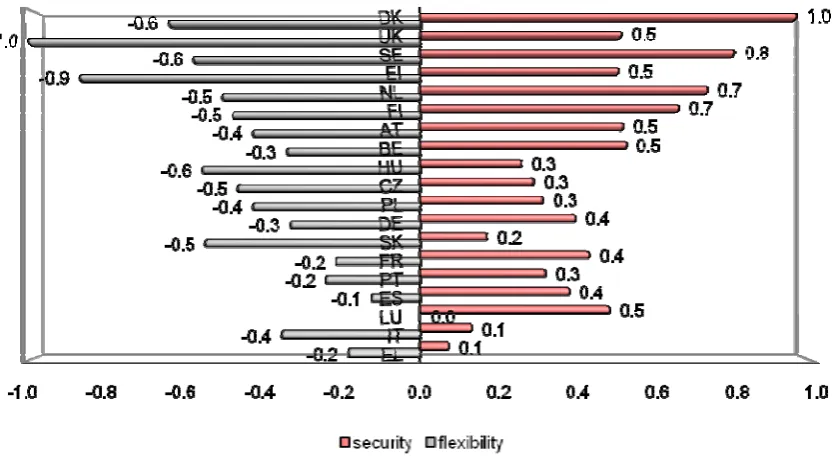
[image:7.595.90.507.305.538.2]Figure 3 also confirms that the overall level of flexicurity and the relative importance of flexibility and security show large disparities among the EU member states included here. In the ranking of countries according to the overall degree of flexicurity, in certain member states (Italy, Slovakia, Hungary, Ireland and the UK) flexibility clearly dominates, while in others (such as Luxembourg, Spain, Portugal, France, Belgium, Finland, the Netherlands, Sweden and Denmark), the security aspects of flexicurity seem to prevail.
Figure 3. The interim indicators for flexibility and security
Source: Own elaboration.
Figure 4. Flexibility and security balance
Source: Own elaboration.
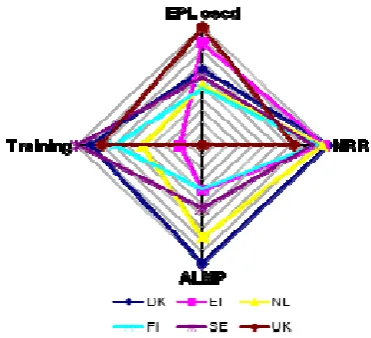
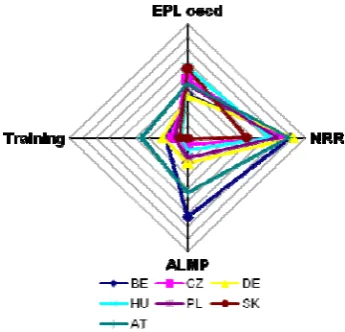
Even more informative is a further breakdown of the index. Radar charts compare the performances of each country for the four elements of flexicurity considered in the index: contractual flexibility, income security, employment security and training. The three radar charts organise countries in three groups according to their score in the overall index: high, poor and medium performers.
High performers are those that score at least 0.6/1 and include, in order: Denmark, the UK, Sweden, Ireland, the Netherlands and Finland. Incredibly, this group combines representative countries of the Nordic and of the Anglo-Saxon models. Nevertheless, one feature distinguishes them: all Nordic countries are characterised by a sort of equilibrium between the four measures, which is unknown in the UK and Ireland. The UK, indeed, registers a good score in all measures with the exception of ALMP: it has the lowest ‘per unemployed capita’ expenditure among the member states considered. Similarly, Ireland fares poorly on training.
Figure 5. High performers
[image:8.595.174.360.563.732.2]BEYOND FLEXIBILITY AND SECURITY |7
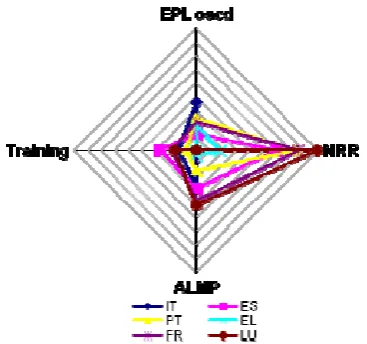
[image:9.595.172.356.325.497.2]Poor performers score between 0.1 (Greece) and 0.3 (France, Spain and Portugal), with Italy and Luxembourg in between. The group is mainly composed of southern countries plus France, which, according to the Esping-Andersen categorisation of welfare regimes, is part-continental model, and Luxembourg. The comparison with the high performers makes it evident that all poor performers are very far from the four corners of the chart. With the exception of Italy and Greece, the only well developed tool concerns passive labour market policies; that is, the unemployment benefits system, meaning that limited attention is paid to activation and learning programmes and flexibility. The three remaining elements are relatively poorly developed, with the exception of ALMP in Luxembourg and France (scoring 0.4/1). Particularly interesting are the cases of Greece and Italy where welfare state powers in the field of labour market policies are restricted. Flexibility and security interim indicators for Italy indicate that the balance is in favour of the former (0.4/1) and that security aspects score only 0.1, whereas in Greece none of the aspects exceeds 0.2.
Figure 6. Poor performers
Source: Own elaboration.
Figure 7. Medium performers
Source: Own elaboration.
The comparison between input and outcome measures show that on average the performance of the outcome indicators is proportioned to the input. This is confirmed by elevating the degree of correlation between the two indexes (78%). There are nevertheless a few exceptions. For instance, Belgium, the Netherlands and Sweden show a slight underperformance indicating that better results could be achieved with existing institutions. In Spain, Greece and Czech Republic, outcome results are higher compared to the input, meaning that other institutions are in place to improve the performance of the labour market, in particular to ensure higher flexibility in Spain and Greece and to reduce the risk of poverty in Czech Republic.
In short, it can be argued that the division of countries between poor, medium and high performers is coherent with the Esping-Andersen classification of welfare regimes, although with some surprises, such as the merge between Anglo-Saxon and Nordic countries and the inclusion of Central Europe countries in the continental group. What is also interesting about the latter group is the ‘degree of persistence’ of the welfare system, which gives more or less space to passive policies but often resists the introduction of new tools.
3.2 Flexicurity as a main determinant of employment performance
To maximise its descriptive power, the index has also been used in a cross-section analysis as an explanatory variable of employment rates. The cross-section analysis proceeds in two steps: at a first stage flexibility and security interim indicators are used as regressors for employment rates. At a second stage, the flexicurity index is the only regressor. The main message from the first stage is that security is more powerful than flexibility as an explanatory variable. The second reveals that flexicurity is not simply the average of flexibility and security and that its impact is stronger on marginal groups.
BEYOND FLEXIBILITY AND SECURITY |9
result of a sort of trade-off by incumbent workers for lower wages in exchange for greater employment protection. On the other hand, EPL will increase the incentives for the employer to invest in training, the loyalty of workers and their will to accept technological changes – all productivity boosters. EPL is also a shock absorber or a circuit-breaker in the current crisis (De Grauwe, 2009) and a tool to impede the discrimination of vulnerable groups like the elderly, women and disabled workers. Nevertheless, what the theory suggests is not always confirmed by empirical evidence. Previous econometric analysis evidenced that the EPL does:
○ Increase the duration of unemployment spells and the share of long-term unemployment;
○ Reduce the dynamism of the labour market by enlarging the share of workers with high job tenure and reducing labour turnover;
○ Have a negative impact on female and youth employment rates.
As far as security is concerned, regressions show that it is relevant in particular for two subgroups: young and older workers. A 10% increase in the indicator (for example from 0.4 to 0.5) generates an increase in the employment rate of 3% for the former and of 2% for the latter. Security aspects also have an impact on female employment (2.5%), activity rates (almost 1.5%) and long-term unemployment (-4%).4
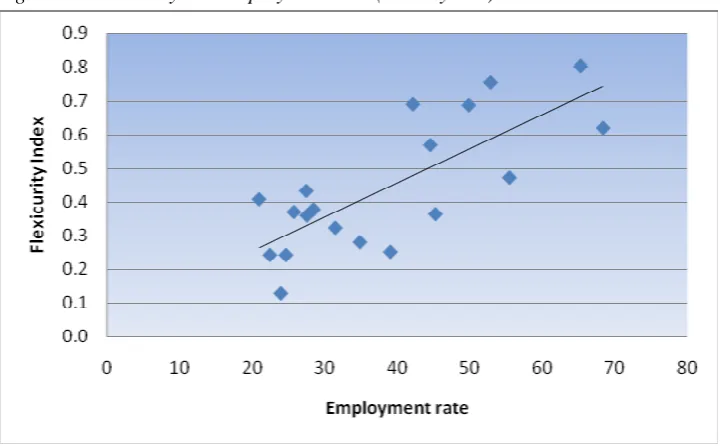
The result of the econometric analysis with the index as explanatory variable shows, as expected, a positive sign: flexicurity goes hand in hand with higher employment rates, meaning that it is successful in attracting people onto the labour market. A closer look also reveals that the magnitude of the relationship between employment rates and the flexicurity indicator varies according to the sub-group considered. It is less strong for core workers (aged 25-54), since for them a standard employment contract might actually exert a positive influence. But it doubles and triples for older and younger workers, respectively, confirming that a robust flexicurity system succeeds in attracting onto the labour market categories of workers that, for different reasons, have less access to jobs. One can therefore argue that, from this point of view, flexicurity helps to increase labour supply. In addition to employment rates, a high level of flexicurity is clearly associated with a low level of long-term unemployment: a 10% increase in the flexicurity index lowers the share of long-term unemployment (out of total unemployment) by 3.5%. In this case, however, the relationship with the security sub-indicator is even stronger (4.5%) confirming that active labour market policies play a major role in curbing long-term unemployment.
4
Figure 8. Flexicurity and employment rate (15-25 years)
Source: Own elaboration.
The coefficients of the regression provide additional interesting information: the average of the sub-indicators for flexibility and security does not produce the average of the regression coefficients; in other words, the relation between flexicurity and employment rates is clear and stronger than with flexibility and security taken separately. These findings provide numerical support to Bovenberg and Wilthagen (2008) who assert that “flexibility and security should not be seen as conflicting aspects of labour-market arrangements, but as mutually supportive components of a well-functioning labour market”. They reject the notion that flexibility is exclusively in the interests of employers while security is all that concerns workers, resulting in a sort of negotiated trade-off between the two. Consequently, flexicurity has to be more broadly interpreted as not simply the addition of flexibility and security, but as a system in which flexibility and security are intertwined.
Table 2. Regression output for flexibility, security and flexicurity (based on input indicators)
Flexibility Security Flexicurity (input)
Coefficient P-value Coefficient P-value Coefficient P-value
Empl. rate 25-54 -0.570 0.794 12.976 0.000 11.002 0.008
Empl. rate 15-64 6.230 0.012 15.741 0.001 20.91 0.000
F Empl. rate 6.433 0.078 25.522 0.000 30.111 0.000
Empl. rate 15-24 24.062 0.006 29.964 0.012 53.922 0.000
Empl. rate 55-64 19.657 0.005 19.204 0.052 37.74 0.001
Activity rate 4.716 0.186 14.020 0.009 18.51 0.000
Long-term unempl. -4.343 0.760 -37.850 0.002 -34.560 0.011
Source: Own elaboration.
[image:12.595.88.513.533.699.2]BEYOND FLEXIBILITY AND SECURITY |11
Conclusions
A number of conclusions can be drawn from the empirical evidence resulting from the use of the index. First of all, it revealed that member states’ preferences for the balance between flexibility and security are highly diversified and cover all possible policy combinations. The recipe ‘low flexibility and low security’ prevails but there are also countries with both elements well developed (mostly the Nordic countries) and others with a stronger preference for flexibility (in Central Europe). Furthermore, radar charts helped to illustrate in which direction countries have to move to reach an economically and socially sustainable equilibrium. Medium performers, for instance, need to modernise their labour market policy by improving activation and training measures. Poor performers need to make huge effort to move in one of the flexicurity directions. Data analysed in the current Working Document provide support to the ‘pathways’ approach proposed by the European Commission at the suggestion of the European Expert Group on Flexicurity. In a nutshell, they argue that starting positions and legal and contractual models are so diverse from country to country and so deep-rooted that they need to be taken into account when any policy transfer is proposed.
A second important conclusion is that the idea of flexibility being in favour of employers and security being in favour of employees needs to be overcome. Flexicurity is ‘both for both’. However, a distinction needs to be made: the positive impact of flexicurity does not apply uniformly to all age groups but is two and three times stronger for older and younger workers respectively. This is important in the short and medium run because, on the one hand the younger group is the one more penalised by the crisis and, on the other, the older group is the one that imposes more challenges on the future sustainability of social systems, given the ageing of the population.
Nevertheless, one cannot discuss the labour market without linking the reflection to the current situation. Therefore the question is: what is the link between the current crisis and flexicurity? It would be tempting to say that the latter is the solution to the former but this would be only partially true. It is true that where a flexicurity system is in place, people losing their jobs obtain financial help from the state and concrete support in finding a new job, but flexicurity will not solve the problem of the current fall in the demand for work. However, as supply strategy, it will contribute to speeding up the recovery by creating a sound and attractive labour market in which firms will be able to find the skills they require. Unfortunately there is one more link between flexicurity and the present recession: setting up such a system requires social investment. Denmark, for example, is the country with the highest total expenditure on labour market policies in Europe. This means that the probability of being able to finance the system is lower the higher the level of public debt.
12 |
References
Bovenberg, L. and T. Wilthagen (2008), “On the Road to Flexicurity, Dutch proposals for a pathway towards better transition security and higher labour market mobility”, Open Access publications from Tilburg University urn:nbn:nl:ui:12-3452610, Tilburg University.
De Grauwe, P. (2009), “Flexibility is out: now we see rigidity’s virtues”, CEPS Commentary, 23 February.
Esping-Andersen, G. (1990), The three worlds of welfare capitalism, Princeton University Press, January 23.
European Commission (2007), “Towards Common Principles of Flexicurity: More and better jobs through flexibility and security”, DG EMPL, Unit D2.
European Expert Group on Flexicurity (2007), “Flexicurity Pathways: Turning hurdles into stepping stones”.
Madsen, P.K. (2002a), "Flexicurity through labour market policies and institutions in Denmark", in P. Auer and S. Cazes (eds), Employment Stability in an Age of Flexibility, ILO, Geneva, pp. 59-105.
Madsen, P.K. (2002b), "The Danish model of flexicurity: a paradise - with some snakes", in H. Sarfati and G. Bonoli (eds), Labour Market and Social Protection Reforms in International Perspective, Aldershot: Ashgate, pp. 243-265.
Madsen, P.K. (2006), “Flexicurity – A new perspective on labour markets and welfare states in Europe”, Conference: Informal meeting of EU Employment and Social Policy Ministers, Villach, Austria, January 20, 2006 - January 20, 2006.
Nardo, M., M. Saisana, A. Saltelli, S. Tarantola, A. Hoffman and E. Giovannini (2005), “Handbook on Constructing Composite Indicators”, OECD Statistics Working Paper N. 13 - 2005/3.
Saint-Paul, G. (2002), "The Political Economy of Employment Protection", Journal of Political Economy, University of Chicago Press, Vol. 110(3), pp. 672-701, June.
Schmid, G. (2006), “Social Risk Management through Transitional Labour Markets”, Socio- Economic Review, Vol. 4, pp. 1-33.