The Key Role of Education
in the Europe 2020 Strategy
CEPS Working Document No. 338/October 2010
Felix Roth and Anna-Elisabeth Thum
Abstract
The EU 2020 Agenda has taken an important step forward by setting the target for tertiary graduation rates at an ambitious 40%. This paper finds, however, that many countries in Europe, including the largest economy – Germany – will not be able to meet this target. Moreover, the crucial topic of educational quality is not even touched upon. Comparing the EU with China in total numbers, the authors find that China’s education system already produces the same number of graduates with tertiary education as the whole EU15. Given the large output of graduates, which is the key to productive spending on R&D, this means that China is likely to soon become a growing power in innovation. Initially the country is expected to concentrate on incremental innovation, with radical innovation to come only later and it is here, the authors warn, that the quality of the university system might represent a major obstacle in the Chinese government’s efforts to close the gap with the US and the EU15 in terms of innovation potential.
CEPS Working Documents are intended to give an indication of work being conducted within CEPS research programmes and to stimulate reactions from other experts in the field. Unless otherwise indicated, the views expressed are attributable only to the authors in a personal capacity and not to any institution with which they are associated.
This paper was originally prepared for presentation at a conference on the “European Dimensions of Education Policies”, held in Maastricht on 21-22 March 2010. The authors wish to thank the participants at the conference for valuable comments. The paper will be published in a forthcoming conference volume, also entitled The European Dimensions of Education Policy, edited by Hildegard Schneider and Jan de Groof of the University of Maastricht. It is pre-published here as a CEPS Working Document with their kind permission.
ISBN 978-94-6138-058-3
Contents
Introduction ... 1
1. The Europe 2020 Strategy – Which educational targets are to be tackled? ... 1
1.1 How far are we from the goal of reducing early school leavers to 10%? ... 1
1.2 How far are we from the goal of 40% of tertiary graduation? ... 2
2. Quantitative and Qualitative Educational Indicators: What has changed? ... 3
3. A Wider Perspective: Non-cognitive Skills and Education ... 6
4. Why will the extension of R&D spending not work without educational investment? ... 7
5. Where is Europe positioned? Are the emerging countries approaching? ... 9
6. What to do? Policy recommendations for the next decade ... 13
References ... 14
| 1
T
HE
K
EY
R
OLE OF
E
DUCATION
IN THE
E
UROPE
2020
S
TRATEGY
CEPS
W
ORKING
D
OCUMENT
N
O
.
338/O
CTOBER
2010
F
ELIXR
OTH ANDA
NNA-E
LISABETHT
HUM*Introduction
This paper examines the European Commission’s 2020 strategy focusing primarily on the dimension of education.1 It will first set out the European Commission’s educational targets for 2020 and comment on these targets and evaluate how realistically they can be met. Second, it will put forward an updated indicator for the innovational potential of the EU27 and OECD countries. An overall indicator will be compared to an indicator focusing solely on subjects related to science, engineering and mathematics. Third, the paper will elaborate on the wider non-cognitive skills that might be crucial for education. Fourth, it will briefly highlight the role of education in scientific R&D and overall investment in intangible capital. Fifth, the EU’s quantitative and qualitative educational performance is compared with that of the three major emerging countries – China, India and Brazil. Finally, it will conclude and offer some policy recommendations.
1.
The Europe 2020 Strategy – Which educational targets are to be
tackled?
In the area of education, the Europe 2020 strategy (European Commission, 2010a) sets two targets: i) reducing the number of early school leavers and ii) increasing the share of young adults who have completed tertiary education, i.e. the educational level following the completion of one’s secondary education, such as a high school, secondary school, university-preparatory school, or gymnasium. More concretely, the Europe 2020 strategy envisages reducing the early school leaver rate from 15% to fewer than 10%, whilst increasing the percentage of the population aged 30-34 who have completed their tertiary education from 31% to at least 40% by 2020. The second target is particularly crucial since education plays a key role in employment and competitiveness by increasing employability and by fostering long-term growth (Gros & Roth, 2008). This section examines the extent to which these goals have been achieved.
1.1 How far are we from the goal of reducing early school leavers to
10%?
Figure 1 shows the rate of early school leavers in the 27 member states of the European Union. Reducing the number of early school leavers should be considered crucial because the lower educated population faces lower employment rates (see Figure A.1 in the Appendix). This effect adversely affects an economy in two ways. First, due to their lower employment probability,
*
Felix Roth is a Research Fellow at the Centre for European Policy Studies (CEPS) and Anna-Elisabeth Thum is a Research Assistant at CEPS. They wish to thank the participants at a conference on the European Dimensions of Education Policies, held in Maastricht on 21-22 March 2010, for valuable comments.
1
lower educated citizens are less likely to actively participate in the labour market and thus to contribute to productivity. Secondly, it is more likely that citizens who are not integrated in the labour market will become dependent on social transfers. A grouping of EU member states has already reached the goal of reducing early school leavers to 10%, notably the transition countries of Poland, Slovenia, the Czech Republic, Slovakia and Lithuania.2 Luxembourg, Finland and Austria are the three western European countries that have already reached the benchmark of 10%. Other western countries – namely Sweden, Ireland, the Netherlands, Denmark, Hungary, France, Germany and Belgium – are very close to reaching the goal. However, the four Mediterranean countries of Malta, Portugal, Spain and Italy present a dramatically different picture. In Malta over 35% of students leave school with only a lower secondary degree. In Europe’s fifth-largest economy – Spain – as well as in Portugal, the figure is still over 30%, and in Italy around 20% of its students leave school early. These numbers already underline the huge competitive problems of Spain and Italy’s economies. Taking the ongoing eurozone crisis into account, it becomes apparent that Spain and Italy have to undergo structural reforms, in the sense of investing in their stock of human capital, to be able to strengthen competitiveness in the long run.
Figure 1. Early school leavers in EU27: Distance to the 10% benchmark of the percentage of the population aged 18-24 with only lower secondary education not in education, 2009
-10 -5 0 5 10 15 20 25 30
sk pl si cz lu lt at fi dk se nl be de hu ie cy fr ee lv gr bg uk ro it es pt mt
Source: Eurostat, Europe 2020 Indicators, Brussels.
1.2 How far are we from the goal of 40% of tertiary graduation?
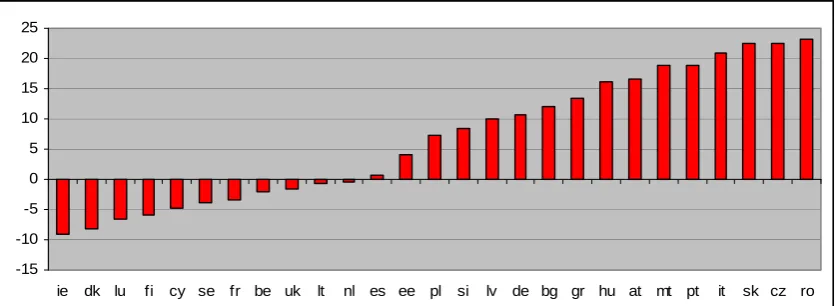
In the area of tertiary education, the Europe 2020 strategy calls for reaching a 40% graduation rate in every EU27 country. The distance to this goal differs widely from country to country. In Romania, the Czech Republic and in Slovakia, an immense effort would have to be made to fulfil the criteria. In these countries the tertiary graduation rate has to be increased by more than 20% by 2020, which means more than doubling the number of tertiary graduates in just one decade. Realistically this will not be possible for any of these three countries without a severe deterioration in the quality of such education. The same difficulty is faced by the two Mediterranean countries Portugal and Italy, the transition country Hungary and the coordinated country Austria. Whereas Italy would need to more than double its graduates, Austria would
2
still need to invest immensely to increase its tertiary graduation rate by more than 15% to reach the 40% benchmark.
Figure 2. Progress to be made to reach the Europe 2020 goal: Distance to the 40% benchmark of tertiary educational attainment of 30-34 year-olds, 2009
-15 -10 -5 0 5 10 15 20 25
ie dk lu fi cy se fr be uk lt nl es ee pl si lv de bg gr hu at mt pt it sk cz ro
Source: Eurostat, Europe 2020 indicators, Brussels.
On the other hand there are those countries that have reached the 40% goal today: Ireland, Denmark, Luxembourg, Finland, Cyprus, Sweden, France, Belgium, the United Kingdom, Italy and the Netherlands. Quite astonishingly, Spain is very close to the benchmark. Ireland has experienced waves of highly skilled net migration, which contributed to its increase in tertiary educational attainment rates (European Commission, 2009: 62). Spain has already experienced a strong increase in its tertiary graduation rate between 1994 and 2003 (Machin & McNally, 2007: 6) and profited immensely from the implementation of the Bachelor of Arts undergraduate degree and especially of the expansion of the ‘sub-Bachelor of Arts’ programme (Hauptmann & Kim, 2009), which resulted in another rapid improvement in Spain’s tertiary graduation rate. However, notwithstanding these results, Spain seems to be characterised by a huge educational inequality with almost 30% of school leavers and 40% of the young cohort graduating from university. The second- and third-largest economies France and UK have both reached the benchmark of 40%. The largest European economy (Germany), however, is far from fulfilling the benchmark with a further increase of 12%.3
2.
Quantitative and Qualitative Educational Indicators: What has
changed?
Although establishing a benchmark of 40% graduation at the tertiary level among the 30-34 year old population is a first promising start, a serious weakness of a benchmark is purely the fact that it is a single quantitative factor of the educational resources within the economy. Without adding a quality measure to this indicator, it is not possible to evaluate whether future graduates will be able to meet the requirements that are so crucial for future labour markets. This is why Gros & Roth (2008) decided to construct a composite indicator between a quantitative indicator, graduation rate from tertiary education, and a qualitative indicator, the given PISA test scores constructed by the OECD. Taking PISA test results, which were designed for evaluating high
3
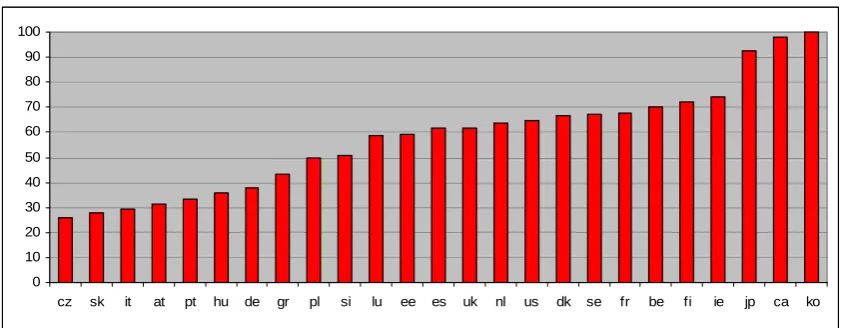
school performance, is surely a somewhat crude measure, but it still is the only indicator allowing a valid comparability among OECD countries.4 When analysing a composite indicator, for instance, Spain’s performance would be less successful as they underachieve in comparison with the rest of the EU in the quality of their education. Thus the benchmark of 40% is somehow weak without adding an additional benchmark for the quality of education. Figure 3 updates the innovation index presented in Gros & Roth (2008) by using updated data from the OECD.
Figure 3. Tertiary educational attainment and PISA test results, 2007
0 10 20 30 40 50 60 70 80 90 100
cz sk it at pt hu de gr pl si lu ee es uk nl us dk se fr be fi ie jp ca ko
Source: OECD (2009), Education at a Glance 2009, Paris.
The distribution is still clearly led by the three OECD and non-EU countries Korea, Canada and Japan, followed by Ireland, Finland and Belgium. The two free-market economies countries US and UK are situated in the midst of the distribution and Germany is positioned in the lower third of the distribution,5 lagging clearly behind the other big European economies and the biggest transition country Poland. This finding is supported by Marin (2010: 23), who proves that the stocks of human capital of Germany and Austria fare poorly in an international comparison. Nevertheless, this indicator was criticised along several lines. It was argued that taking an indicator of overall tertiary graduation gives a skewed picture of reality. As the inclusion of graduates from the discipline of social sciences and humanities is not an appropriate proxy to measure the innovational capacities of a country, one would rather have to focus on the graduates from science, engineering and mathematics.
4
The OECD is also aware of the crucial need to evaluate the quality of European universities and has started to fund the Assessment of Higher Education Learning Outcome (AHELO).
5
Figure 4. Percentage of graduates in the sciencesamong employed 25-34 year olds and PISA science test results, 2007
0 10 20 30 40 50 60 70 80 90 100
hu gr nl es us at it cz se sk de be dk jp pt pl ie uk fr fi ko
Note: The percentage of graduates in sciences includes graduates in life sciences, physical sciences, mathematics and statistics, computing, engineering and engineering trades, manufacturing and processing, architecture and building. The PISA science score measures science literacy. Due to lack of data Canada is not included in the distribution.
Source: OECD (2009), Education at a Glance 2009, Paris.
Taking this argument into consideration, Figure 4 shows an index of the graduation rates of scientists multiplied by the achievement in the PISA science test. And indeed the picture changes slightly. Whereas Korea is still in the top position, Japan has fallen behind many European countries. The European ranking is led by Finland, followed by the two big economies France and the United Kingdom. However, Germany’s position has only slightly increased from the lower third of the distribution to the middle of the distribution. The US, which ranges in the lower third of the distribution, has to improve. Although one has to denote that the US is largely solving its problem of low educational quality by intensely ‘brain draining’ young talent from all over the world (Boeri, 2008 and Freeman, 2008). Thus the US is less dependent on its own labour force when it comes to educational quantity and quality.
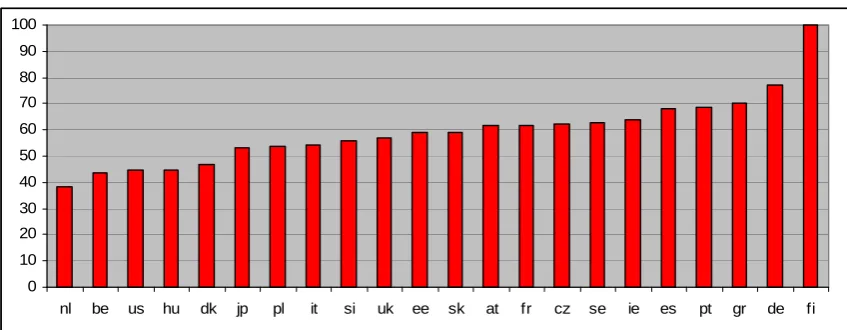
Figure 5. Graduate rates in the sciences (2007) combined with PISA mathematics and science scores (2006)
0 10 20 30 40 50 60 70 80 90 100
nl be us hu dk jp pl it si uk ee sk at fr cz se ie es pt gr de fi
[image:7.595.88.512.569.734.2]As Germany is the biggest economy in Europe and as it is often described as the economic engine of the European Union, one wonders whether it is the simple fact that there is not enough interest in the study of science, mathematics, computing, engineering, manufacturing and construction on behalf of students or whether the drop-out rate from those subjects might be a driving force behind Germany’s lack of graduates within science. Figure 5 shows a measure of the interest of students in these fields in 2007 (the percentage of enrolments in these fields among all students) and the quality of students in mathematics and science in 2006 across EU27 countries. This graph gives a slightly different picture than the previous graph. Finland is still the leading country. Germany, in the second position, occupies a much better position than it does in terms of graduates. The Mediterranean countries Spain, Portugal and Greece are in high positions as well. The Netherlands and Belgium have the lowest enrolment rates in mathematics, engineering, computing, manufacturing and construction. The comparison of Figures 4 and 5 seem to underline that it is not the lack of interest in the topic of science but a significant drop out rate from the scientific sciences within Germany’s universities.6
3.
A Wider Perspective: Non-cognitive Skills and Education
PISA scores measure cognitive abilities which are clearly linked with educational outcomes. But beside literacy, numeracy and abstract reasoning, other factors seem to be additionally at play in the determination of educational performance. These factors include self-confidence, persistence, conscientiousness, motivation, trust and other dimensions of social capital, such as social networks. In the literature they are often referred to as “non-cognitive skills”. In a rather recent body of literature the link between non-cognitive skills and human capital as well as labour market outcomes is being established by several prominent economic and non-economic researchers. Heckman & Rubinstein (2001) study a sample of American high-school dropouts who took a General Educational Development (GED) examination. This examination gives a second chance to dropouts by testing whether their cognitive abilities are equivalent to those of high-school graduates. The GED outcomes show that recipients of this diploma are as smart as high-school graduates and that it therefore cannot be cognitive skills alone that determine outcomes. Heckman & Rubinstein (2001) show that it is a lack in non-cognitive skills such as self-discipline that accounts for the gap in educational and labour market outcomes between high-school dropouts and high-school graduates.
There is a vast range of different non-cognitive skills that can affect educational and labour market outcomes. We consider social capital as an important non-cognitive skill for society in general and for education in particular. Putnam (2000) believes in a virtuous cycle between social capital and educational performance. He shows for different American states that a measure of social capital is positively related to student test scores.
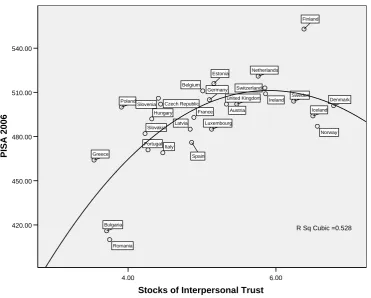
Figure 6 tests Putnam’s hypothesis in Europe by studying the relationship between social capital in the form of interpersonal trust and PISA scores across European countries. In contrast to Putnam (2000), who finds a positive linear relationship in the US, Figure 6 shows that the relation is of parabolic nature across European countries. It is evident from the figure that PISA scores increase with higher levels of interpersonal trust. However, after a certain point, the relationship becomes negative. So there seems to be an optimal amount of trust for which PISA scores are at their maximum across European countries.
6
Figure 6. Scatter plot between stocks of interpersonal trust and PISA test results
6.00 4.00
Stocks of Interpersonal Trust 540.00
510.00
480.00
450.00
420.00
PISA 2006
united Kingdom
Slovakia Slovenia
Sweden
Romania Portugal Poland
Norway Netherlands
Latvia Luxembourg
Italy
Iceland Ireland
Hungary
Greece
France
Finland
Spain Estonia
Denmark Germany
Czech Republic
Switzerland
Bulgaria
Belgium
Austria
R Sq Cubic =0.528
The OECD also recognises the link between education and social capital in its publication
Human Capital by Brian Keeley (2007). According to Keeley, social capital increasingly interests policy-makers because of a rising concern over marginalisation in developed societies. Individuals can be marginalised because they do not have enough education and have not made the ‘right’ social contacts.
4.
Why will the extension of R&D spending not work without
educational investment?
The goal of spending 3% of GDP on R&D has been carried over into the Europe 2020 strategy from the Lisbon strategy.7 Figure 7 shows the relationship between the percentages of tertiary graduates among the 25-34 year-old population and R&D expenditure per GDP. The figure shows that countries with higher stocks of people with a completed tertiary degree tend to have higher R&D expenditure and vice versa: countries with a low percentage of tertiary graduates tend to have a lower percentage of R&D expenditure per GDP.
7
Figure 7. Scatter plot between tertiary graduation rate and R&D expenditure per GDP
at
be
cz
dk
ee fi
fr de
gr hu
ire it
j
nl
pl pt
sk
sl
es se
uk us
0
1
2
3
4
R
&
D E
x
pe
nd
it
ur
e
10 20 30 40 50
Tertiary Graduates 25-34
Source: Eurostat and OECD (2009), Education at a Glance 2009.
The graph gives some insights into the proposed aim of the Europe 2020 strategy to increase R&D spending to 3% of GDP. A large part of R&D expenditure is attributed to research personnel. Accordingly in extreme cases, an increase in R&D expenditure without an increase in the number of highly-skilled graduates might simply result in higher wages for the researchers. Focusing on this issue, Figure 7 indicates those countries for which an actual increase of their R&D expenditure is reasonable and those in which an increase in R&D expenditure seems to be unreasonable since there are not enough young highly-skilled graduates. In Ireland, for instance, an increase in R&D expenditure seems to be reasonable, as it has the second highest percentage of tertiary graduates, but at the same time it is among the countries with the lowest R&D expenditure. Similarly, the strategy to increase R&D investment in Greece, Poland and Spain also seems to be reasonable. Germany and Austria, on the other hand, have a relatively high expenditure on R&D with a relatively low proportion of young tertiary graduates. In their case it would not be recommended to increase expenditure in R&D if the percentage of young tertiary graduates is not increased.
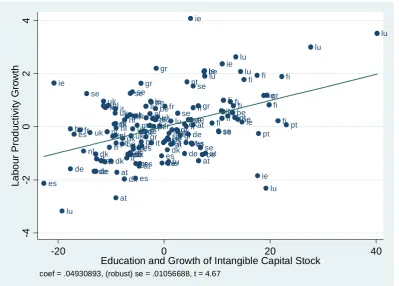
Figure 8. The effect of intangible capital and education on labour productivity growth (partial regression plot) es ie lu be de esfr nl se uk de dk de ites uk nl fr ie nl nl fr dk fr dk nl uk nl it at pt nl at beuk dk nl it uk esde uk es se pt dk uk se uk frdk fr es gr pt es ates pt gr nl it defr gr lu dk uk nl ie be it be ptdk be gr uk fr es de at fr it dk be ie de lu it lu at gr it gr se grgr dk de pt it pt de se ie de esat at se frgr at se be beie lu at fi se se it fi ie se fi at fi befi pt lu be lu ie fi fi ie pt ie lu gr fi fi fi pt lu lu -4 -2 0 2 4 La bo ur P ro d uc ti v it y G row th
-20 0 20 40
Education and Growth of Intangible Capital Stock
coef = .04930893, (robust) se = .01056688, t = 4.67
Source: Roth & Thum (2010) and OECD (2009), Education at a Glance 2009, Paris.
5.
Where is Europe positioned? Are the emerging countries
approaching?
It has been stressed that in order to preserve European competitiveness it is essential to invest in education. As a whole range of classic manufacturing has already shifted to lower wage countries such as China, India and many others, the creation of knowledge societies would permit European economies to generate future wealth. This argument, however, is based on the assumption that countries like China will continue to do solely manufacturing. The reality looks gloomier for the European economies. A special report from The Economist on innovation in emerging markets (2010) stresses that the emerging countries China, India and Brazil are becoming more and more innovative and following Japan’s economic development from the 1950s onwards, only much faster. This fact is also highlighted by China’s 2020 education strategy which is highly ambitious and plans huge investments in the upcoming decade. China aims for 195 million of its citizens to have tertiary degrees by 2020, thus almost as many graduates as half of the total EU27 population (Government of China, 2010). Freeman (2008) has already highlighted the immense effort the Chinese have been investing in building up its universities. According to some recent estimates, e.g. Li et al. (2008), there are already more PhD-level engineers and scientists in China today than in the US.
taken from a dataset recently constructed by Barro & Lee (2010).8 Figure 9 shows the percentage of people with a completed tertiary degree for the 30-34 year old population, the generation that is just entering the labour market. These numbers reflect the countries’ future potential to innovate. Japan is in the leading position with 40%, followed by Canada and the US, with just above 25% and 20%, respectively. The EU15 countries have on average just under 20%. The BRIC countries are all situated at the low end of the distribution. China has around 5% tertiary graduates. This number, however, is bound to rise if China realises its plan to have 195 million tertiary graduates by 2020.
Figure 9. Comparison of human capital in selected OECD Economies, EU15 and BRIC countries: Percentage of the population (aged 30-34) with completed tertiary education, 2010
0 5 10 15 20 25 30 35 40 45
in cn br ko eu15 us ca jp
Source: Barro & Lee (2010).
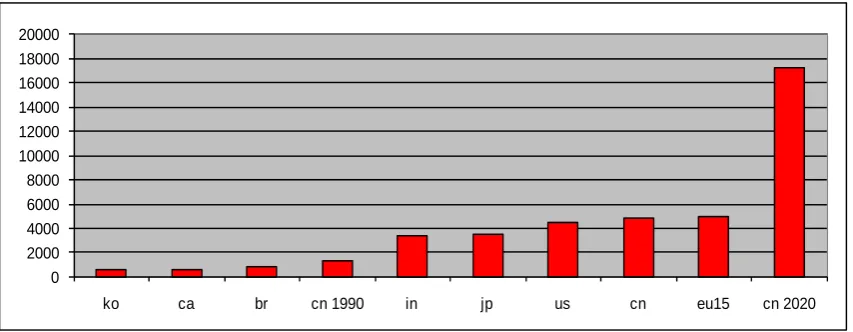
Figure 10 shows a comparison of the total number (in thousands) of tertiary graduates within the population aged 30-34. This time the EU15 countries lead the distribution with around 5 million tertiary graduates aged 30-34. China is only slightly behind the EU15 with slightly less than 5 million people aged 30-34 and who have obtained completed tertiary education. The United States follows with about 4.2 million 30-34 year old tertiary graduates. According to the Barro & Lee (2010) dataset, India and Japan have about 3.2 million tertiary graduates in this age group.
8
Figure 10. Comparison of human capital between selected OECD Economies, EU15 and BRIC countries: Population (in thousands) (aged 30-34) with completed tertiary education, 2010
0 2000 4000 6000 8000 10000 12000 14000 16000 18000 20000
ko ca br cn 1990 in jp us cn eu15 cn 2020
Source: Barro & Lee (2010).
Figure 10 clarifies that China, Brazil and India are clearly behind in relative numbers the EU15, the US, Canada and Korea. But in view of the large populations of both China and India, when studying a comparison in absolute numbers, China has already achieved nearly the same number of graduates as the EU15. In addition, taking the immense size of the Chinese population into consideration, the bar at the far right of the distribution shows the goal of the China 2020 strategy (proportionally to the goal of 195 million tertiary graduates by 2020 in total, the number for the 30-34 year old population should be around 17.3 million). One has to note, however, echoing our earlier comments, that tripling the graduation rate in China in one decade still seems to be highly unrealistic and if achieved, it will most likely result in a significantly lower quality within the educated academic workforce. However, China’s potential to rapidly increase its tertiary graduation rate can be inferred from the fact that it nearly quadrupled that rate over the two decades from 1990 to 2010. Thus doubling its graduation rate by 2020 might be quite realistic.
As both Figures 9 and 10 merely give a picture of the quantitative aspects of the future academic workforce, Figure 11 constructs a composite index9 including a measure of educational quality (the so-called “Shanghai index”10) and of quantity (the percentage of tertiary
9
The composite indicator was constructed by multiplying the percentage of tertiary graduates among the 30-34 year-old population with the sum of the percentages of universities ranked among the top 20, top 100, top 200 and top 500. The data are weighted by applying the share of 30-34 year-old tertiary graduates over the population aged 15 years and older.
10
graduates among the population aged 30-34 taken from the Barro & Lee (2010) dataset). The figure shows that the UK leads the ranking followed by the US and Canada, as well as Germany. Whereas France, Japan, Italy and Korea are located at the middle of the distribution, the emerging countries perform poorly when focusing on a composite index that includes the quality measure “rankings of universities”. Based on this composite index, the emerging countries China, India and Brazil will have to improve their universities immensely.
Figure 11. Tertiary education attainment (aged 30-34) and universities in top rankings, 2010
0 10 20 30 40 50 60 70 80 90 100
in cn br ko ¹ it jp fr d e ca us uk
Source: Barro & Lee (2010) and Shanghai Jiao Tong University (2009).
One of the remaining questions now is whether the Chinese economy will absorb these steadily increasing numbers of tertiary graduates by an increased level of R&D.11 The recent development of R&D can already provide some insights on this question. Figure 12 shows the total R&D expenditure (gross domestic expenditure on R&D) in selected countries for the private and the government sector for the period 1990-2008. The United States clearly has the largest numbers, followed by the EU15. Japan and Germany have the next largest figures. The expenditure on R&D in the EU15, Germany and Japan are all rising gradually. In the US there has been a stronger increase between 1994 and 2000 and after 2004. In China R&D expenditure is increasing at a faster rate since 2000. China overtook Germany in 2004 and will surpass Japan next if the rates of increase remain constant. The figure clearly underlines Chinese policy-makers’ announcement that one of China’s main objectives on the political agenda is to focus on R&D and innovation. This policy seems to be quite reasonable considering the strategy shown above to triple the tertiary education graduation rate in 2020, which can then be allocated to the increasing R&D investments.
citation indices. In addition, Florian (2007) finds that the Shanghai ranking cannot be reproduced even when the raw data are available. However, as there is no other known available dataset to evaluate and compare the quality of international university systems, the authors still used the data from the Shanghai Index, despite its disadvantages.
11
Figure 12. Total R&D expenditure (GERD) in millions of PPP in 2000 prices for selected countries
0 50000 100000 150000 200000 250000 300000
1990 1991 1992 1993 1994 1995 1996 1997 1998 1999 2000 2001 2002 2003 2004 2005 2006 2007 2008 European Union (15 countries) Germany (including ex-GDR from 1991) United States China (excluding Hong Kong) Japan
Source: Eurostat.
6.
What to do? Policy recommendations for the next decade
14 |
References
Barro, R. and J-W Lee (2010), A New Data Set of Educational Attainment in the World, 1950– 2010, NBER Working Paper Series, National Bureau of Economic Research, Cambridge, MA.
Boeri, T. (2008), “Migration and economic growth: Is there a trade-off?”, paper presented at DG ECFIN’s 2008 annual research conference (http://ec.europa.eu/economy_finance/events/ event12197_en.htm).
The Economist (2010), “The World Turned Upside Down”, Special report on innovation in emerging markets, 17 April (http://www.unc.edu/world/2010Residential/
The_World_Turned_Upside_Down.pdf).
EurActive (2010), “Germany calls off EU summit talks on education”, 19 March ( http://www.euractiv.com/en/priorities/germany-cancels-eu-summit-talks-education-news-357895).
European Commission (2009), “Progress towards the Lisbon objectives in education and training”, Commission staff working document, European Commission, Brussels.
European Commission (2010a), Europe 2020 - A European strategy for smart, sustainable and inclusive growth, Communication from the Commission, European Commission, Brussels (http://ec.europa.eu/eu2020/pdf/COMPLET%20EN%20BARROSO%20%20%20007%2 0-%20Europe%202020%20-%20EN%20version.pdf).
European Commission (2010b), Benchmark Sheets, Directorate-General for Education and Culture, Directorate A, Document 3A, Brussels.
European Council (2010), Conclusions, EUCO 13/10, Brussels, 17 June.
Florian, R. (2007), “Irreproducibility of the results of the Shanghai academic ranking of world universities”, Sciencometrics 72(1), 25-32.
Freeman, R.B. (2008), “International students, university training, and multinationals in the flow of technology to China and India: Implications for growth and trade”, paper presented at the 5th DG ECFIN Annual Research Conference on Boosting growth and productivity in an open Europe: The role of international flows of goods, services, capital and labour, 16-17 October (http://ec.europa.eu/economy_finance/events/
event12197_en.htm).
Frey, B. and K. Rost (2009), “Do rankings reflect research quality?”, Journal of Applied Economics, 8 (1), 1-38.
Government of China (2010), “Outline of China’s National Plan for Medium and Long-term Education Reform and Development (2010-2020)”, State Council of the Peoples’ Republic of China, Beijing, 29 July.
Gros, D. and F. Roth (2008), The post-2010 Lisbon Process: The key role of education in employment and competitiveness, CEPS Working Document No. 308, Centre for European Policy Studies, Brussels.
Hauptmann, A. and Y. Kim (2009), Cost, commitment and attainment in higher education – an international comparison, Jobs for the future, Washington, D.C.
Keeley, B. (2007), “Human Capital”, OECD insights, OECD, Paris.
Li, Y., J. Whalley, Z. Shunming, S. Zhang and X. Zhao (2008), “China’s higher education transformation and its global implications”, Vox, 18 April (http://www.voxeu.org/index.php?q=node/1066).
Machin, S. and S. McNally (2007), “Tertiary Education Systems and Labor Markets”, OECD Thematic Review of Tertiary Education, OECD, Paris.
Marin, D. (2010), The Opening Up of Eastern Europe at 20-Jobs, Skills, and ‘Reverse Maquiladoras’ in Austria and Germany, Munich Discussion Paper No. 2010-14, Department of Economics, University of Munich.
OECD (2009), Education at a Glance 2009, Paris.
Putnam, R. (2000), Bowling Alone – The collapse and revival of American society, New York: Simon & Schuster.
Roth, F. (2010), “Measuring Innovation – Intangible Capital Investment in the EU”, forthcoming in Intereconomics.
Roth, F. and A.E. Thum (2010), Does intangible capital affect economic growth?, CEPS Working Document No. 335, Centre for European Policy Studies, Brussels (http://www.ceps.eu/book/does-intangible-capital-affect-economic-growth).
Shanghai Jiao Tong University (2009), “Academic Ranking of World Universities (ARWU)”, carried out by the Center for World-Class Universities (CWCU ) and Graduate School of Education (GSE), July (http://www.arwu.org/ARWU2009.jsp).
16 |
[image:18.595.88.507.176.358.2]Appendix
Figure A.1 Employment rates by educational attainment for population aged 25-64 in
2007, by member state
0 10 20 30 40 50 60 70 80 90 100
at be cz dk fi fr de gr hu ie it lu nl pl pt sk es se uk ee si Below upper secondary Upper secondary and post-secondary non-tertiary Tertiary education
About
CEPS
Place du Congrès 1 • B-1000 Brussels Tel : 32(0)2.229.39.11 • Fax : 32(0)2.219.41.51
E-mail: [email protected] Website : www.ceps.eu
Founded in Brussels in 1983, the Centre for European Policy Studies (CEPS) is among the most experienced and authoritative think tanks operating in the European Union today. CEPS serves as an leading forum for debate on EU affairs, but its most distinguishing feature lies in its strong in-house research capacity, complemented by an extensive network of partner institutes throughout the world.
Goals
• To carry out state-of-the-art policy research leading to solutions to the challenges facing Europe today. • To achieve high standards of academic excellence
and maintain unqualified independence. • To act as a forum for discussion among
stakeholders in the European policy process • To provide a regular flow of authoritative
publications offering policy analysis and recommendations.
• To build collaborative networks of researchers, policy-makers and business representatives across the whole of Europe.
• To disseminate our findings and views through our publications and public events.
Assets
• Multidisciplinary, multinational & multicultural research team.
• Complete independence to set its own research priorities and freedom from any outside influence. • Seven research networks, comprising numerous
other highly reputable institutes, to complement and consolidate CEPS’ research expertise and to extend its outreach.
• An extensive membership base of Corporate and Institutional Members, which provide expertise and practical experience and act as a sounding board for CEPS policy proposals.
Programme Structure
Research Programmes
Economic & Social Welfare Policies •
Financial Markets & Institutions •
Energy & Climate Change •
Regulatory Policy •
EU Foreign, Security & Neighbourhood Policy •
Justice & Home Affairs •
Politics & Institutions •
Agricultural & Rural Policy •
Research Networks
European Capital Markets Institute (ECMI) •
European Climate Platform (ECP) •
European Credit Research Institute (ECRI) •
European Network for Better Regulation •
(ENBR)
European Network of Economic Policy •
Research Institutes (ENEPRI)
European Policy Institutes Network (EPIN) •
European Security Forum (ESF) •
CEPS organises a variety of activities, involving its members and other stakeholders in the European policy debate, including national and EU-level policy-makers, academics, corporate executives, NGOs and the media. Its funding is obtained from a variety of sources, including membership fees, project research, foundation grants,