Int. J. Electrochem. Sci., 12 (2017) 7877 – 7889, doi: 10.20964/2017.08.81
International Journal of
ELECTROCHEMICAL
SCIENCE
www.electrochemsci.org
High-cycling-stability of Nanosized Sandwich Structure
Silicon/Graphene Composite as Anode for Lithium-Ion Batteries
Rui Yang*, Yiding Shen, Xiaowu Yang, Liewei Qiu, Xin Li
Key Laboratory of Auxiliary Chemistry & Technology for Chemical Industry, College of Chemistry and Chemical Engineering, Shaanxi University of Science & Technology, Xi’an 710021, P.R.China
*
E-mail: [email protected]
Received: 15 May 2017 / Accepted: 22 June 2017 / Published: 12 July 2017
The nanosized sandwich structure silicon/graphene composite anode material was designed to enhance anode performance for lithium-ion batteries (LIBs) by a facile method of mechanical ball milling. The structure and morphology of the materials were investigated by X-ray diffraction (XRD) and field emission scanning electron microscope (FESEM). The electrochemical properties of this composites electrode were studied by a series of electrochemical tests. As anode of LIBs, the composite material exhibited a high initial reversible capacity of 2189.7 mAh·g-1
at a current density of 1000 mA·g-1, and showed an enhanced cyclic performance with a reversible capacity of 1212.9 mAh·g-1
after 100 cycles. The performance improvement be attributed that as a good matrix, the graphene sheets mitigated the volume expansion/shrinkage of silicon during the lithiation/delithiation processes and increased electrical conductivity of anode materials.
Keywords: nano-Si powder, graphene nanosheets, lithium-ion batteries, composite anode material, electrochemical performance
1. INTRODUCTION
voltage[3]. However, it cannot meet the ever increasing energy density requirements for applications due to its limited theoretical capacity of 372 mAh·g-1
[2,4,5]. Therefore, how to seek higher capacity anode materials to replace the currently used graphite anodes becomes an highly significant research direction.
Recently, the Li-alloy and semiconductor materials possess higher theoretical specific capacity than graphite. For instance, Ge[3], Si[6] and Sn[7] have drawn great attention that replaced graphite to be the anode materials of lithium-ion battery, especially Si-based materials, due to its low cost, natural abundance and most of all their highest theoretical capacity of about 4200 mAh·g-1
corresponding to the formation of Li22Si5 alloy[8,9,10]. Meanwhile, the discharge plateau of silicon is slightly higher
than that of graphite anodes, which unlikely lead to lithium dendrite growth on the electrode surface[11]. However, most Si based anodes have some problems such as a huge volume change during the lithiation/delithiation of silicon (>300%). This volume change could result in two effects: (1) leading to a pulverization of the anodes and the electrical disconnection from current collector, which usually cause the rapid capacity decay and poor cycling characteristics[12,13]. (2) Solid electrolyte interphase (SEI) layers will continually form on the surface of pulverized silicon, which increases the intrinsic resistance and decreases the coulomb efficiency step-by-step[14]. In order to alleviate the volume change in the process of lithiation/delithiation, researchers have attempted various methods, such as using nanosized Si particles[15,16], thin film and amorphous structures[17], silicon-based conductive polymer composites[18] and Si/C composites[19].
Graphene, a two-dimensional monolayer structure composed of carbon atoms, has attracted much attention due to its unique structure and properties, such as superior electrical conductivities, high theoretical surface areas of over 2600 m2·g-1, excellent structural flexibility, good flexibility and high mechanical strength[20]. As an anode material, graphene can provide a stabler conductive network and better matrix to buffer the volume expansion and reduce the particle agglomeration of silicon particles[21-23]. Therefore, a number of researchers have attempted to synthesize graphene/silicon composites by chemical reaction, for example thermally reduced graphene oxide (GO) and nanosized silicon composites[16], flexible, free-standing, paper-like, graphene-silicon composite materials have been synthesized by a simple, one-step, in-situ filtration method[24].
In this work, we report on a facile synthesis method that using mechanical ball milling to product the nanosized silicon/graphene composite with sandwich structures. Nanosized silicon particles are embedded between flexible graphene nanosheets. This structure not only buffer the volume expansion and reduce the particle agglomeration of silicon particles, but also provid the continuous conducting pathways for lithium ions and electrons. Meanwhile, due to the gaps among graphene sheets absorbed the volume expansion of silicon during the lithiation/delithiation process, the expansion and fragmentation of the anode material can be reduced effectively and the cycling stability can be enhanced significantly. Including the long cycle stability and retention rate, the electrochemical performance of the composite have been measured. It exhibited good cyclability with a high initial reversible discharge capacity of 2189.7 mAh·g-1 at a current density of 1000 mA·g-1 and showed an excellent cyclic performance that still maintain in 1212.9 mAh·g-1
after 100 cycles. Even after 400 cycles, the specific capacity still could remained at 1132.1 mAh·g-1
2. EXPERIMENTS
2.1 Material preparation and characterization
Nanosized silicon powder and graphene nanosheets were used as raw materials. Nanosized silicon powder with an average particle size of 100 nm was obtained from Shanghai Aladdin Bio-Chem Technology Co., LTD. Graphene nanosheets were supplied by Shenzhen Kejing Star Technology Co., LTD and have an average particle size of 5 μm. A 70:30 mass ratio of nano-Si powder and graphene nanosheets were blended and placed in the planetary ball milling machine and the mass ratio of grinding media to material was 10:1. Prepared the nanosized silicon/graphene by planetary ball milling machine for 5, 10 and 20 h, respectively. The as-prepared nanosized silicon/graphene composite were characterized by the field emission scanning electron microscopy (FESEM, JEOL JSM-6700F) and the Bruker D8 advance X-ray diffraction (XRD) with Cu-Kα radiation at 40 kV/30 mA and a scan rate of 6 °/min.
2.2 Electrochemical measurements
The electrochemical properties of nanosized silicon/graphene composite were measured by coin cell testing. The silicon/graphene electrodes were made by dispersing 60 wt% active material, 20 wt% Super-P as an electron conductor, and 20 wt% sodium alginate (SA) solution dissolved in ultrapure water as a binder to form a homogeneous slurry. All chemicals were analytical grade and used without further purification. The surface of copper foil was evenly overlaid with mixed slurry. The coated copper foils were dried in vacuum oven at 60 °C for 12 h and roll-pressed to enhance the contact between the active materials and the conductive carbons, then cut into wafers with diameter of 10 mm. The average weight of active material in each electrode wafer was about 1~1.2 mg·cm-2
. The CR2032 coin cells were assembled in the argon-filled glovebox (Mikrouna Super 1220/750, Mikrouna (China) Co., LTD) with lithium foil as the counter electrode. The electrolyte consisted of LiPF6 (1 M)
solution in a mixture of ethylene carbonate (EC), ethyl methyl carbonate (EMC) and dimethyl carbonate (DMC) (1:1:1, by volume, provided by Shenzhen Ke Jing Star Technology Co., LTD).
After rest for 24 h, using the Land-CT2001A battery-testing system to carry out the galvanostatic discharge-charge tests of cells in the range of 0.01-1.5 V at a current density of 1000 mA·g-1
and using the electrochemical workstation to carry out the cyclic voltammetry (CV) test from 0.01 to 1.5 V, with a scanning rate of 0.03 mV·s-1
. Besides, the electrochemical impedance spectroscopy (EIS) test was also measured by the same electrochemical workstation with applying a 10 mV voltage in the frequency range from 10 mHz to 100 kHz at open ciruit voltage (~1.5 V).
3. RESULTS AND DISCUSSION
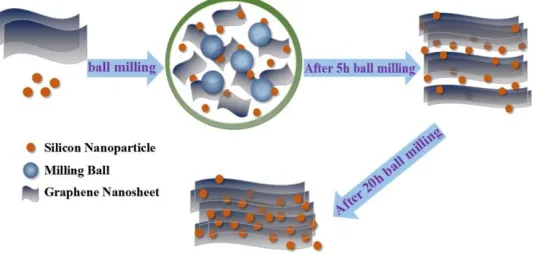
and placed in the planetary ball milling machine. During the ball milling, the impact force of milling balls accelerated the process of embedding the nano-Si particles between flexible graphene sheets. At first, the nano-Si particles were only uneven dispersion or aggregation in the surrounding and interior of graphene. With the increase of milling time, the nano-Si particles were homogeneous embedded and surrounded the gaps between the graphene sheets. Therefore, the nanosized silicon/graphene composite formed with a unique sandwich structure.
Figure 1. Schematic illustration of nanosized silicon/graphene composite preparation by mechanical ball milling.
3.1 Structure and morphology characterizations
The morphological and structural feature of the raw material and nanosized silicon/graphene composite were characterized by the FESEM, which shown in Fig. 2. The images are as follows: a) The nano-Si particles are spherical with an average particle size of 80~100 nm, b) Graphene has a typical flexible lamellar structure, c) After 5 h ball milling, the nano-Si particles were start mixing with graphene sheets and randomly distributed or agglomerated around the graphene sheets, d) and e) After 10 and 20 h, the graphene layer became thinner and the nano-Si particles were more evenly distributed in the gaps which among the graphene sheets. The microstructure of the nanosized silicon/graphene composite was influenced by the ball milling time. As the milling time is prolonged, the gaps among the graphene nanosheets were filled with nano-Si particles, thus formed a great quantity of randomly distributed nanosized space between the graphene sheets and the nano-Si particles. During the lithiation/delithiation process, these free spaces could accommodate the large volume change of nano-Si particles to some extent. Therefore, a buffer matrix and conductive network can be achieved for the Li-Si reactions with this unique sandwich structure of graphene nanosheets covered and embedded by nano-Si powder. The results are in agreement with the experimental procedure which envisaged of Fig. 1.
[image:4.596.166.435.192.319.2]
Figure 2. SEM images of (a) pure nano-Si, (b) graphene sheets and nano-Si/graphene composite at different milling time:(c) 5 h, (d) 10 h, (e) 20 h.
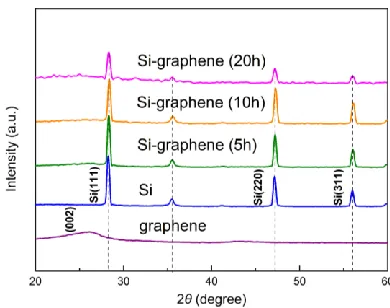
[image:5.596.114.483.68.244.2]In addition, a broad peak at 26.0° attributed to the graphite-like (002) structure from the amorphous graphene phase can also be observed in each spectrum of nano-Si/graphene composite. With the increase of milling time, the major peaks of Si (111), Si (220) and Si (311) shown no obvious change. This might have been due to its nature nanocrystalline and high hardness[10]. However, the diffraction peak at 26.0° were increasingly smooth and weak, it indicating that graphene was uniformly dispersed in the nanocomposites without significant agglomeration or stacking[16,25].
Figure 3. XRD for pure nano-Si powder, pure graphene sheets, and nano-silicon/graphene composite (5 h, 10 h, 20 h ball-milled).
3.2 Electrochemical characterization
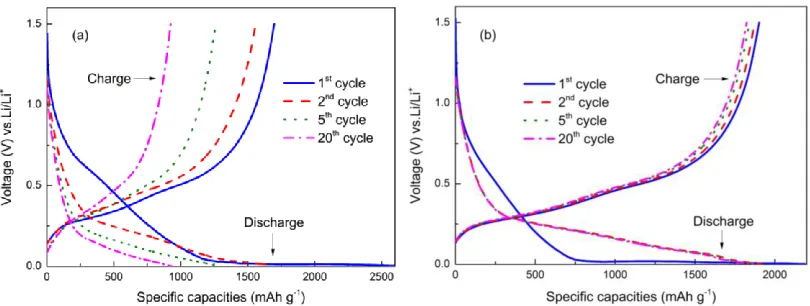
The electrochemical properties of the nanosized silicon/graphene composite electrode were studied by coin cell tests, and compared to the pure nano-Si electrode. Fig. 4 displays the first twenty cycles voltage profiles of the pure Si and silicon/graphene composites at a current density of 1000 mA·g-1
[image:5.596.199.394.440.594.2]
capacities of 2596.7/1697.2 mAh·g-1
, corresponding to an initial irreversible capacity loss of 34.64%, in the first cycle. Meanwhile, there was an inclined platform at 0.7 V during the first discharge, and disappeared in the subsequent process of discharge. This irreversible capacity loss is due to the electrochemical reduction of electrolyte for the formation of SEI film and the partial deactivation of inserted lithium in the host lattice, particularly in the case of Si anodes[26,27]. The irreversible capacity loss decreases to about 7.27% (from 1681.6 mAh·g-1
to 1559.3 mAh·g-1) in second cycle, and in the subsequent cycle, the specific capacity was uncreasingly decayed (Fig. 4a). By contrast, the nanosized silicon/graphene composite anode has 13.13% capacity loss (from 2189.7 mAh·g-1 to 1902.3 mAh·g-1
) in the first cycle, and only 2.26% irreversible capacity loss in the second cycle. The voltage-specific capacity curves almost coincide from the second to twentieth cycle, it can prove that the composite electrodes have a good reversibility in cycling process (Fig. 4b). The trends of these voltage profiles curves are consistent with the CV curve which shown in Fig. 7. Obviously, the irreversible capacity loss of the nanosized silicon/graphene composite anode during the first two cycles is smaller than that of the pure nano-Si anode, which means using this composite can not only ameliorate the lithium dealloying/alloying, but also reduce the irreversible capacity loss.
Figure 4. The first twenty-cycle voltage-specific capacity curves of: (a) pure nano-Si anode and (b) nano-Si/graphene composite (20 h ball-milled) anode.
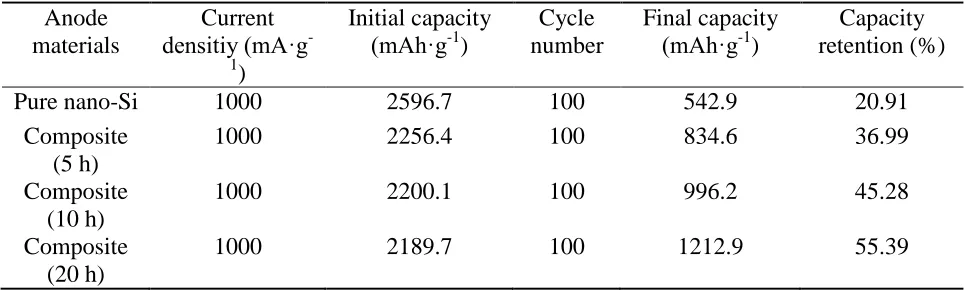
Fig. 5 compares the cycling performance of the electrodes which prepared with nanosized silicon/graphene composite and pure nano-Si at the same current density of 1000 mA·g-1, the potential range from 0.01V to 1.5 V. The pure nano-Si anode shows poor capacity retention characteristics that decreases to 542.9 mAh·g-1
after 100 cycles. This is mainly due to the agglomeration of nano-Si powder and the large volume change during discharge/charge cycles, result in the anodes cracking or crumbling, and losing the electrical contact with the collector[28]. In contrast, nanosized silicon/graphene composite, especially with increasing milling time, shows a better cycling stability. The initial discharge of the nano-Si/graphene composite is lower than the pure nano-Si,which is due to the addition of the graphene particles in composite. But the capacity retention of the nano-Si/graphene composite is much higher than that of the pure nano-Si, in subsequent cycles. The composite (5 h ball milled) delivered a capacity of 2256.4 mAh·g-1
[image:6.596.97.502.353.506.2]
mAh·g-1
after 100 cycles. The composite (20 h ball milled) delivered a reversible capacity of 1212.9 mAh·g-1
after 100 cycles, even after 400 cycles, the specific capacity still could remained at 1132.1 mAh·g-1
. In addition, the detailed cycling and capacity retention data of anode materials are shown in Table 1. Obviously, with the prolonging of the milling time, the capacity fading of pure nano-Si and nano-Si/graphene composite were suppressed to some extent. The excellent capacity retention during extended cycling is most likely due to several factors: Firstly, graphene is a conductive carbon, so that can increase the conductivity of the electrodes. Secondly, as the milling time is prolonged, the gaps among the graphene nanosheets were filled with nano-Si particles, thus formed a great quantity of randomly distributed nanosized space between the graphene sheets and nano-Si particles. This free spaces could accommodate a volume change of the inner active nano-Si particles during the lithiation/delithiation process, prevent their agglomeration and fragmentation. Meanwhile, the data of this work was compared with the data of the reported similar anode material[2,10,24](Table 2). As can be seen from the table, it is higher than most of the related reports that the data of this work. However, the reversible capacity of the present silicon/graphene composite is still lower than the theoretical capacity. This is probably caused by the addition of graphene and the irreversible damage during the discharge/charge process including volume and structural changes.
[image:7.596.189.407.358.514.2]Figure 5. Cycling performance at a current density of 1000 mA·g-1 of pure nano-Si and nanosized silicon/graphene composite (5 h, 10 h, 20 h ball-milled).
Table 1. The cycling performances of anode materials.
Anode materials
Current densitiy (mA·g
-1
)
Initial capacity (mAh·g-1
)
Cycle number
Final capacity (mAh·g-1
)
Capacity retention (%)
Pure nano-Si 1000 2596.7 100 542.9 20.91
Composite (5 h)
1000 2256.4 100 834.6 36.99
Composite (10 h)
1000 2200.1 100 996.2 45.28
Composite (20 h)
[image:7.596.57.545.613.758.2]
Table 2. The cycling performances of some similar anode materials[2,10,24].
Nanosized materials Current densitiy (mA·g-1 ) Cycle number Final capacity (mAh·g-1 ) Voltage window (V) Preparation method Silicon/graphene composite
100 30 1168 0.02-1.2 Simply mixing
Silicon/graphene composite
200 50 715 0.01-1.5 Plasma assisted
milling Graphite/silicon/
graphene composite
50 50 420.5 0.01-2 Via spray drying
and subsequent annealing
Our work 1000 100 1212.9 0.01-1.5 High-energy ball
milling
The pure Si and nano-Si/graphene composite electrodes were cycled at different current densities beyond conventional conditions to compares their specific capacity characteristic and coulombic efficiency. As shown in Fig. 6, when the current density increased from 500 mA·g-1 to 2000 mA·g-1
in the potential range of 0.01-1.5 V, the capacity of the nano-Si/graphene composite declined slightly from 2103.1 mAh·g-1
to 1778.8 mAh·g-1, 1524.4 mAh·g-1, and 1124.8 mAh·g-1, while the pure Si only shows lower capacity than the nano-Si/graphene at the same current density (from 1194.3 mAh·g-1
to 616.7 mAh·g-1, 458.3 mAh·g-1, and 141.5 mAh·g-1). During the final fifteen cycles, the current density was returned to 500 mA·g-1
, the reversible capacity of the nano-Si/graphene composite can be recovered to 1407.8 mAh·g-1, but the pure Si anode only can be recovered to 405.6 mAh·g-1
. In addition, the coulombic efficiency curve of the composite anode is more stable than that of the pure Si anode. Apparently, the good cycle stability and coulombic efficiency of the nano-Si/graphene composite are benefit from the graphene nanosheets which can not only improved electrical conductivity greatly, but also formed a large number of nanosized free spaces that could accommodate a volume expansion of the inner active nano-Si particles during the lithiation/delithiation process.
[image:8.596.181.413.548.704.2]
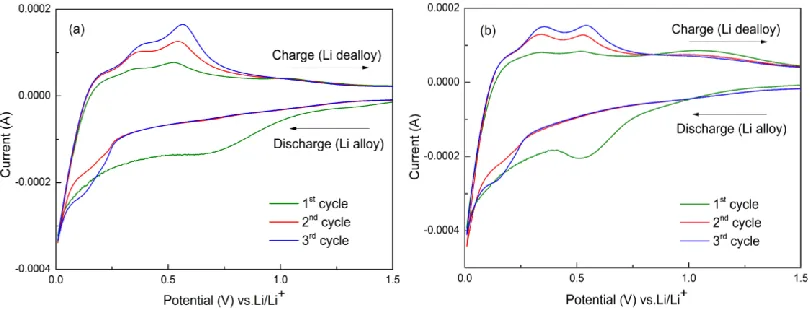
As presented in Fig. 7, the first three cyclic voltammetry (CV) curves between 0.01-1.5 V at a scan rate of 0.3 mV·s-1
were carried out to investigate the performance of the pure nano-Si and the nano-Si/graphene composite (20 h ball milled). The CV curves of all samples clearly shown the peaks corresponding to the lithiation/delithiation process. As shown in fig. 7(a) and 7(b), there are both a broad peak around 0.6-0.8 V during the first discharge, and both disappeared in the subsequent process of discharge. This phenomenon is probably attribute to an irreversible reduction of electrolyte solvent for the forming of solid electrolyte interface (SEI) film on the anode[29-31]. At the second discharge, another new cathodic peak appears about 0.15-0.2 V and also appears in the subsequent cycles, which means the insertion of Li+ into the pure Si or the nano-Si/graphene composite anodes[32]. In the charge, two anodic peaks appeared at 0.33 and 0.58 V, marking to the Li+ deintercalate from Li-Si phases to amorphous Si[33]. After compared between Fig. 7(a) and 7(b), the tendency is very similar to that the CV curves of the pure nano-Si and the nano-Si/graphene composite, and the anodic peaks of nano-Si/graphene composite are more remarkable than pure nano-Si. It indicated that the nano-Si is the main reaction component of the nano-Si/graphene composite in the process of lithium, and the present of graphene did not have apparent effect of the lithiation process of Si but can improve the performance of pure Si electrode.
Figure 7. Cyclic voltammetry results of (a) the pure nano-Si and (b) the nano-Si/graphene composite.
[image:9.596.97.502.360.515.2]
impedance of the nano-Si/graphene composite are less than the pure nano-Si, and the electrochemical reaction rate of the nano-Si/graphene also faster than the pure nano-Si. This result confirms that the addition of graphene can increase the conductivity and decrease the impedance of the electrodes. On the other hand, as the extension of milling time, nanosized silicon particles are embedded between flexible graphene nanosheets, this structure can buffer the volume expansion, reduce the particle agglomeration of silicon particles, provide the continuous conducting pathways for lithium ions and electrons, improve the connection between electrode material and collector, thus decrease the resistance of charge transfer[39]. Therefore, the nano-Si/graphene composite electrode can significantly enhance the electron transfer, thus remarkable improved the kinetic performance of electrochemical lithium insertion/extraction.
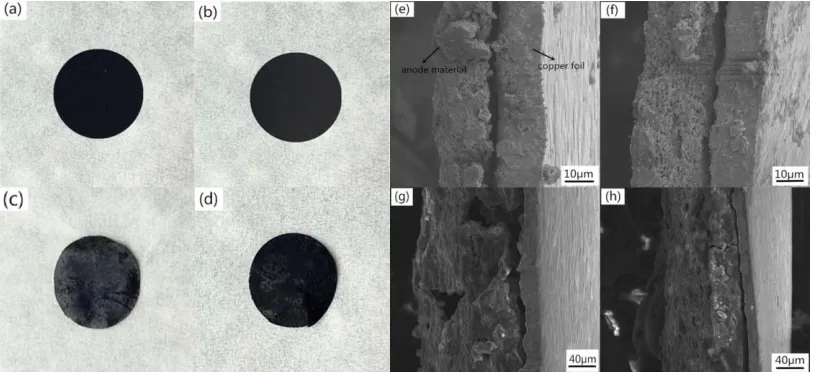
As shown in Fig. 9, the surface and cross sectional of the pure nano-Si and nano-Si/graphene composite electrodes were individually further investigated by photograph and FESEM imaging that before and after 20 cycles. The results indicated that the surfaces of these two electrod were both uniform and smooth, before cycling. After 20 cycles, the obviously fragmentation and pulverization were appeared on the surface of pure-Si electrode, but the surface of nano-Si/graphene composite electrode was still flat, relatively (Fig. 9(a), (b), (c), (d)).
Figure 8. Nyquist plots of electrodes of pure nano-Si and the nano-Si/graphene composite before cycling.
[image:10.596.170.428.362.551.2]
Figure 9. The surface photographs of (a) pure nano-Si electrode, (b) nano-Si/graphene composite electrode, (c) pure nano-Si electrode after 20 cycles, (d) nano-Si/graphene composite electrode after 20 cycles and the cross sectional images of (e) pure Si electrode, (f) Si/graphene composite electrode, (g) pure Si electrode after 20 cycles, (h) nano-Si/graphene composite electrode after 20 cycles.
4. CONCLUSIONS
The nano-Si/graphene composite with sandwich structure can be synthesized by high-energy ball milling with nanosized silicon powder and graphene nanosheets. The presence of graphene nanosheets provides a mechanical and electrochemical defence to prevent the agglomeration of silicon, and improves the contact between the electrode materials as well as the electrode material and collector, which decreases the internal resistance and increases the coulomb efficiency. With the increasing of milling time, the gaps among the graphene nanosheets were filled with nano-Si particles, thus formed a great quantity of randomly distributed nanosized space between the graphene sheets and nano-Si particles. These free spaces could accommodate a volume change of the inner active nano-Si particles during the lithiation/delithiation process and reduce the fragmentation and pulverization of the electrode, thus relieve the capacity decay. It shows a reversible specific capacity of 1212.9 mAh·g-1 after 100 cycles and better cycle stability that the nano-Si/graphene composite with 20 h ball milled. Even under the different current density, the composite anode still keep a relatively good charge/discharge performance. In this work, the one-step synthesis method of nanosized silicon/graphene composites is easily achievable, low-cost and have obvious effect, so that can be used in the industrial production.
ACKNOWLEDGEMENT
We would like to express our great thanks to Natural Science Foundation of China (51603117), the Scientific Research Fund of Shaanxi University of Science and Technology (2016QNBJ-15) for financial support.
Reference
[image:11.596.96.508.70.256.2]
2. L. Gan, H. Guo, Z. Wang, X. Li, W. Peng, J. Wang, S. Huang and M. Su, Electrochimica Acta, 104 (2013) 117.
3. I. Kovalenko, B. Zdyrko, A. Magasinski, B. Hertzberg, Z. Milicev, R. Burtovyy, I. Luzinov and G. Yushin, Science, 334 (2011) 75.
4. A. M. Chockla, J. T. Harris, V. A. Akhavan, T. D. Bogart, V. C. Holmberg, C. Steinhagen, C. B. Mullins, K. J. Stevenson and B. A. Korgel, Journal of the American Chemical Society, 133 (2011) 20914.
5. F. Maroni, R. Raccichini, A. Birrozzi, G. Carbonari, R. Tossici, F. Croce, R. Marassi and F. Nobili, Journal of Power Sources, 269 (2014) 873.
6. X. Xin, X. Zhou, F. Wang, X. Yao, X. Xu, Y. Zhu and Z. Liu, Journal of Materials Chemistry, 22 (2012) 7724.
7. L. Xiao, Y. Cao, J. Xiao, W. Wang, L. Kovarik, Z. Nie and J. Liu, Chemical communications, 48 (2012) 3321.
8. U. Kasavajjula, C. Wang and A. J. Appleby, Journal of Power Sources, 163 (2007) 1003. 9. M. Ge, J. Rong, X. Fang, A. Zhang, Y. Lu and C. Zhou, Nano Research, 6 (2013) 174.
10. W. Sun, R. Hu, H. Liu, M. Zeng, L. Yang, H. Wang and M. Zhu, Journal of Power Sources, 268 (2014) 610.
11. H. E. Park, C. H. Hong and W. Y. Yoon, Journal of Power Sources, 178 (2008) 765.
12. Y. Yu, L. Gu, C. Zhu, S. Tsukimoto, P. A. van Aken and J. Maier, Advanced materials, 22 (2010) 2247.
13. C.-M. Park, J.-H. Kim, H. Kim and H.-J. Sohn, Chemical Society Reviews, 39 (2010) 3115. 14. M. Gauthier, J. Danet, B. Lestriez, L. Roué, D. Guyomard and P. Moreau, Journal of Power
Sources, 227 (2013) 237.
15. S. Iwamura, H. Nishihara and T. Kyotani, The Journal of Physical Chemistry C, 116 (2012) 6004. 16. H. Xiang, K. Zhang, G. Ji, J. Y. Lee, C. Zou, X. Chen and J. Wu, Carbon, 49 (2011) 1787.
17. T. Zhang, L. J. Fu, H. Takeuchi, J. Suzuki, K. Sekine, T. Takamura and Y. P. Wu, Journal of Power Sources, 159 (2006) 349.
18. Z. Liu, Y. Luo, M. Zhou, W. Wang, N. Gan, S. Okada and J.-i. Yamaki, Electrochemistry, 83 (2015) 1067.
19. R. Zhou, R. Fan, Z. Tian, Y. Zhou, H. Guo, L. Kou and D. Zhang, Journal of Alloys and Compounds, 658 (2016) 91.
20. Y. Chen, N. Du, H. Zhang and D. Yang, Rsc Advances, 5 (2015) 46173.
21. Wang, Y. Yang, Y. Liang, J. T. Robinson, Y. Li, A. Jackson, Y. Cui and H. Dai, Nano letters, 11 (2011) 2644.
22. L. H. Hu, F. Y. Wu, C. T. Lin, A. N. Khlobystov and L. J. Li, Nature communications, 4 (2013) 1687.
23. J. S. Bunch, A. M. van der Zande, S. S. Verbridge, I. W. Frank, D. M. Tanenbaum, J. M. Parpia, H. G. Craighead and P. L. McEuen, Science, 315 (2007) 490.
24. J.-Z. Wang, C. Zhong, S.-L. Chou and H.-K. Liu, Electrochemistry Communications, 12 (2010) 1467.
25. D. Chen, R. Yi, S. Chen, T. Xu, M. L. Gordin and D. Wang, Solid State Ionics, 254 (2014) 65. 26. H. Ghassemi, M. Au, N. Chen, P. A. Heiden and R. S. Yassar, ACS Nano, 5 (2011) 7805.
27. Y. Chen, J. Qian, Y. Cao, H. Yang and X. Ai, ACS Applied Materials & Interfaces, 4 (2012) 3753. 28. M. Li, X. Hou, Y. Sha, J. Wang, S. Hu, X. Liu and Z. Shao, Journal of Power Sources, 248 (2014)
721.
29. Y. Cao, L. Xiao, X. Ai and H. Yang, Electrochemical and Solid-State Letters, 6 (2003) A30. 30. T. Jiang, S. Zhang, X. Qiu, W. Zhu and L. Chen, Electrochemistry Communications, 9 (2007) 930. 31. M.-S. Park, S. Rajendran, Y.-M. Kang, K.-S. Han, Y.-S. Han and J.-Y. Lee, Journal of Power
Sources, 158 (2006) 650.
Engineering, 43 (2014) 1073.
33. J. Eom and H. Kwon, Journal of Materials Research, 23 (2011) 2458.
34. T. Kim, Y. H. Mo, K. S. Nahm and S. M. Oh, Journal of Power Sources, 162 (2006) 1275. 35. J. Wang, C. Wang, Y. Zhu, N. Wu, W. Tian, Ionics, 21 (2015) 579.
36. Y.-S. Hu, Rezan D.-C., M.-M. Titirici, J.-O. Müller, R. Schlögl, M. Antonietti and J. Maier, Angewandte Chemie International Edition, 47 (2008) 1645.
37. S.-L. Chou, J.-Z. Wang, M. Choucair, H.-K. Liu, J. A. Stride and S.-X. Dou, Electrochemistry Communications, 12 (2010) 303.
38. R. Ruffo, S. S. Hong, C. K. Chan, R. A. Huggins and Y. Cui, Journal of Physical Chemistry C, 113 (2009) 11390.
39. S. A. Klankowski, G. P. Pandey, B. A. Cruden, J. Liu, J. Wu, R. A. Rojeski and J. Li, Journal of Power Sources, 276 (2015) 73.
![Table 2. The cycling performances of some similar anode materials[2,10,24].](https://thumb-us.123doks.com/thumbv2/123dok_us/1818792.137471/8.596.181.413.548.704/table-cycling-performances-similar-anode-materials.webp)