Int. J. Electrochem. Sci., 12 (2017) 6705 – 6713, doi: 10.20964/2017.07.81
International Journal of
ELECTROCHEMICAL
SCIENCE
www.electrochemsci.orgCorrosion Behavior of Drill Pipe Steel in CO
2-H
2S Environment
Yisheng Hu1*, Ping Guo1, Zhiwu Yao2, Zhouhua Wang1, Olujide Sanni3
1
State Key Laboratory of Oil and Gas Reservoir Geology and Exploitation, Southwest Petroleum University, Chengdu, 610500, China
2
Sichuan Geophysical Company, CNPC, Chengdu, 610213, China
3
School of Mechanical Engineering, University of Leeds, Leeds, LS2 9JT, UK
*
E-mail: [email protected]
Received: 19 April 2017 / Accepted: 17 May 2017 / Published: 12 June 2017
In this paper, scanning electron microscopy, potentiodynamic polarization tests and electrochemical impedance spectroscopy were used to examine the effect of H2S concentration on H2S/CO2 corrosion
of pipeline steel. The results showed that the corrosion process of the steel when H2S coexists with
CO2 at different H2S concentrations is related to the morphology and consistency of the corrosion
product film. When a small quantity of H2S was added, the surface area of the anode reaction zone
decreased due to the continuous adsorption and separation of more substantial FeS deposits or a greater amount of FeHS+ ions on the steel surface. At the same time, the dual layer capacitance decreased, while the anion adsorption capacity improved. Consequently, the inhibition of the corrosion process was realized. After the addition of a small quantity of H2S under the environment such that H2S
coexists with CO2, the general corrosion rate of the steel declined quickly. Some elements of the
corrosion product film became loose or even diminished when H2S concentration became higher. As a
result, the protective effect of the corrosion product film was reduced, and the rate of corrosion increased. .
Keywords: H2S; Corrosion; Electrochemical impedance spectroscopy; Carbon dioxide
1. INTRODUCTION
The inner corrosion of pipe steel when CO2 coexists with H2S is a critical issue for both
upstream and downstream oil and gas equipment [1-5]. The corrosive environment in the presence of both CO2 and H2S results in severe damage to tubes, pipelines, as well as system facilities. While the
issues relevant to CO2/H2S corrosion of tubing steel have been studied for more than 60 years since the
severe environments with high H2S and CO2 concentrations, such as in the Chinese Sichuan and
Changqing oil fields. Therefore, understanding, prediction and manipulation of corrosion under this kind of environment are a critical challenge for effective equipment design and management, and the consequent guaranteed integrity.
The existing reports have proved that the impact of H2S on the corrosion of CO2 changes with
different H2S concentrations [7-9]. It is found that low levels of H2S have several effects on CO2
corrosion. H2S not only serves as an accelerant of anodic dissolution through sulfide adsorption and
the change of the pH to accelerate the corrosion but can also reduce the rate of CO2 corrosion through
the development of a protective sulfide coating [10, 11]. Additionally, H2S affects the category and
attributes of the developed corrosion coatings, either enhancing or damaging them [12]. Pots et al. stated that for P/P >500, the corrosion process was controlled by CO2 corrosion, but for P/P <20, it was
the H2S corrosion that played the main role within this mechanism, and for the intermediate 20<P/P
<500 range, the process was controlled by both factors. [13]. It should be emphasized that the majority of these studies were carried out in the low H2S/CO2 content environment, so that the studies of the
corrosion process in the high H2S/CO2 content environment are currently very limited. Ma et al. [14]
found that H2S provides great inhibition under the following environment: a low H2S concentration, a
pH value of 3-5, and a longer immersion period (≥ 2 h). Abelev et al. [15] observed that 5 ppm of H2S
inhibits corrosion in the environment that also contain CO2. Nevertheless, the H2S/CO2 corrosion
process of steel is related to the development of a sulfide film on the steel surface; this film can assume different crystal structures, such as mackinawite (FeS1−x), pyrrhotite (Fe7S8), cubic ferrous sulfide
(FeS), pyrite (FeS2), troilite (Fe1−xS), or greigite (Fe3S4) [16-22].
Despite the many studies of the corrosion process of carbon steel, the corrosion system in the presence of both H2S and CO2 is rarely studied. This work aims to elucidate the impact of H2S content
on the H2S/CO2 corrosion of pipeline steel under the coexistence of H2S and CO2. It is found that this
provides insight into the prediction of the potential hazards resulting from corrosion and into the methods for effective control of premature failure.
2. EXPERIMENTS
2.1. Materials
Using electric discharge wire-cutting machining, the laboratory samples were cut into rectangles (25 mm×20 mm×3 mm) from a P110 steel oil casing tube, and their chemical components (wt%) are as follows: C 0.26; Si 0.19; Mn 1.37; P 0.009; S 0.004; Cr 0.148; Ni 0.028; Mo 0.013; Cu 0.019; Nb 0.06; V 0.006; Ti 0.011; and Fe balance. The samples were ground by hand using SiC abrasive paper, ultrasonically cleaned in acetone solution and dried prior to the other treatments.
2.2. Immersion tests
mm. Both at the beginning and end of the tests, the specimens were ultrasonically cleaned with acetone, degreased, washed, dried, and weighed on an analysis balance with the accuracy of 0.1 mg. The experimental solution simulating the development water extracted from one oil field was prepared from analytical reagents and deionized water and included 5 wt% NaCl. This solution underwent 4-hour oxygen deprivation using N2. These tests were performed for a variety of volumes of a saturated
solution of H2S and CO2, as well as for a solution free of H2S or CO2. The specimens were quickly
placed in a uniform temperature water bath, and the starting time of the experiment was set when the bath temperature reached 60°C. 48 hours later, the samples were removed from the water bath. The corrosion rate was calculated using the weight-loss technique.
After the corrosion tests, the specimens were removed from the autoclave, rinsed in deionized water, dehydrated in alcohol and dried in air. One of the four specimens was retained for surface characterization of corrosion scales. The remaining three specimens were descaled in the solution consisting of hydrochloric acid (100 mL, density is 1.19 g/mL), hexamethylene tetramine (5 g), and deionized water (900 mL) at room temperature and then processed as above. Then, the specimens were weighed again to determine the weight loss. The corrosion rate was calculated according to
4 8.76 10
CR
W V
S t
where VCR is the corrosion rate, mm/y; W is the weight loss, g; S is the exposed surface area of
specimen, cm2; r is the density of specimen, g/cm3; t is the corrosion time, h; and 8.76×10⁴ is the unit conversion constant. The average corrosion rate with error bars was calculated from the three parallel specimens for each test.
2.3. Electrochemical characterization
Using a potentiostat/galvanostat system, the potentiodynamic polarization curves as well as electrochemical impedance spectroscopy (EIS) results of the specimens that were placed in different H2S concentrations were studied. Prior to the electrochemical measurements, all specimens were
wet-ground to 2000 grit using SiC paper and were then polished to a mirror finish, cleaned with acetone ultrasonically, rinsed in distilled water, and dried in warm air. The measurements were carried out in a three-electrode flat cell in which the counter electrode consisted of a Luggin capillary and a large platinum plate. All potential measurements were performed with Ag/AgCl as the reference electrode. It should be emphasized that the EIS test was conducted within the 105-10−2 Hz frequency range with a sinusoidal potential disturbance of 1 mV. To analyze the EIS data, a fitting simulation of the FRA was adopted. For polarization curve measurements, the scan range of the potential was from −1400 to −100 mV with the scan rate of 1 mV/s. The corrosion potential (Ecorr) and corrosion current density (icorr)
were derived directly from the polarization curves by Tafel region extrapolation.
3. RESULTS AND DISCUSSION
constant at approximately 120 kΩ cm2
when the immersion period was less than 5 days. Nevertheless, when the immersion period was increased to 10 days, a rapid decline in the capacitive loop was observed. It could be seen clearly in Figure 1B that the phase angle declined and separated into two peaks when the immersion period rose to 10 days. Table 1 presents the fitting results of the pipeline steel EIS measurements. It was clear that there was a decline in the solution’s resistance from 72.5 kΩ/cm2
to 32.6 kΩ/cm2 due to the improved conductivity of the solution when the immersion time increased. The decline of nf means that the passive film became growingly inhomogeneous or flawed due to the permeation of carbon dioxide. Under the CO2 corrosion environment, the steel in the matrix
[image:4.596.53.543.310.589.2]showed a strong electron affinity to OH-[23].
Table 1. Fitting results of the pipeline steel EIS measurements in carbon dioxide saturated water for a variety of immersion periods.
Immersion time Rs (Ωcm2) Rf (Ωcm2) Rct (Ωcm2)
0 Day 72.5 133.5 91.0
5 Days 70.6 121.6 84.6
10 Days 57.7 63.5 49.2
20 Days 32.6 1.11 3.25
Figure 1. Changes of the Nyquist plots (A) as well as plots of the phase angle (B) of the pipeline steel in carbon dioxide saturated water for a variety of immersion periods.
Table 2. Average corrosion rate of steel placed in different H2S concentrations under the coexistence
of H2S and CO2 (CCO2 = 10 mM).
PH2s (mM) 0 0.05 0.1 0.2 0.8 2 4
Table 2 presents the data for the corrosion rates of the steel placed in different H2S
concentrations under the environment where H2S coexists with CO2 (CCO2 = 10 mM). It was found that
the general corrosion rate of the steel under the environment containing CO2 only was 0.347 mm/a.
Nevertheless, with the addition of a small quantity of H2S, the corrosion rate was reduced to 0.25
mm/a. When the H2S content was raised to 2 mM from 0.05 mM, no evident variation was observed in
the corrosion rate. With the increase of the H2S concentration, the corrosion rate tended to improve. In
other words, the addition of a small amount of H2S has an inhibitive effect on CO2 corrosion.
Generally, the corrosion rate increases with increasing H2S concentration [24]. In the case of a
sufficiently high H2S concentration, the situation may be different. The decrease of the corrosion rate
with the increase H2S concentration was also observed by other researchers [25, 26].
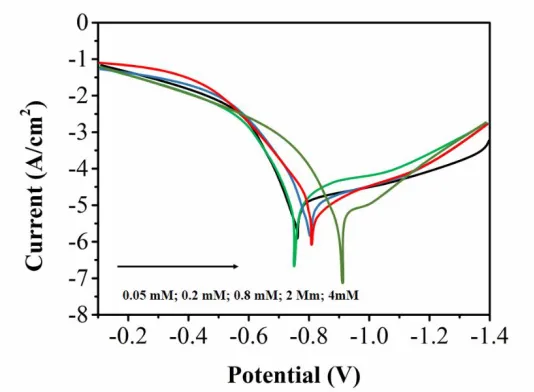
Figure 2. Potentiodynamic polarization curves of the steel placed in different H2S concentrations
under the coexistence of H2S and CO2 (CCO2 = 10 mM).
The potentiodynamic polarization curves of the steel placed in different H2S concentrations
under the coexistence of H2S and CO2 (CCO2 = 10 mM) are shown in Figure 2. Table 3 presents the
corrosion parameters deduced from the potentiodynamic polarization curves. As the concentration of H2S decreased from 0 to 0.2 mM, a moderate negative switching in the steel corrosion potential
(Ecorr) was observed, while with the increase of the H2S concentration, the corrosion current density
(icorr) declines accordingly. All of these results demonstrate that the corrosion of pipeline steel is restrained under the environment of low H2S concentration. Due to the existence of H+, cathodic
polarization is relieved, facilitating the electrons flowing to cathode so that the corrosion process is enhanced; this is known as the hydrogen depolarization corrosion [27]. When the H2S concentration is
increased from 0.8 mM to 4 mM, the icorr rises step by step, demonstrating that the growing concentration of H2S concentration can accelerate steel corrosion. These outcomes are in accordance
with data relevant to the corrosion rate. An increase in the corrosion current density of the specimen of steel was observed when the H2S concentration was increased. For the vacant substrate on the steel, it
[image:5.596.165.432.264.460.2]
concentration environment corrosion’s potential Ecorr revealed a positive displacement from −720 mV
to −911 V. This results from the decomposition effects on the substrate contributed by H2S.
Table 3. Electrochemical polarization parameters for the steel with coexistence of H2S and CO2
Sample Ecorr
(mV)
Icorr
(mA/cm2)
ba (mV/dec) bc (mV/dec)
0.05 -720 4.22 87 114
0.2 -731 4.47 59 89
0.8 -797 4.58 79 95
2 -806 4.60 72 94
4 -911 4.72 81 90
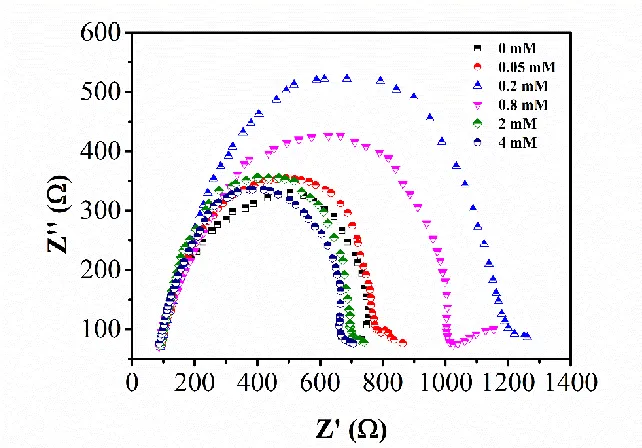
It has been shown that EIS is a useful technique for the characterization of the surface layers as well as for the investigations of the H2S/CO2 corrosion systems[18]. Figure 5 shows the EIS Nyquist
plot of the steel placed in different H2S concentrations under the coexistence of H2S and CO2 (CCO2 =
10 mM). When the H2S concentration is in the 0–0.2 mM range, great capacity reactance arcs are
developed at high frequencies, while inductance reactance arcs are developed at low frequencies. In H2S/CO2 corrosion environments, CO2 and H2S are hydrolyzed to form H+. Hydrogen atoms [H]
generated from the cathodic process of the electrochemical reaction desorbed mainly in two forms from the electrode surface. The commonly acceptable mechanism is that the process of hydrogen atoms generated from the reduction reaction bonding to each other as molecules is impeded because of the strong absorbability of H2S, HS- and S2- on the electrode surface; on the other hand, the process of
hydrogen atoms diffusing into the metal matrix is enhanced strongly, so that hydrogen atoms may gather at crystal defect points such as inclusions and grain boundaries, or exist in the crystal lattice in the form of an interstitial atom; and both of these mechanisms lead to a degradation in the mechanical properties of the metal material and to a remarkable increase in susceptibility. The reactance arcs developed at high frequencies are related to both the dual-layer capacitance and the transfer resistance, whereas the reaction arcs developed at low frequencies are likely to be related to the adsorption and isolation of the intermediate products appearing on the electrode surface, namely, FeHS+ under the H2S/CO2 environment (CCO2 = 10 mM) [28], in which FeHS− ions are adsorbed upon the appearance of
the corrosion product film. The intermediate products FeHS+ can generate FeS1−x or Fe2+ directly
through hydrolysis. In addition, Fe2+ can generate FeS or Fe(HS)2 byreacting with HS− or H2S [29,
30].
The semi-diameter of capacity reactance arcs developed at high frequencies reveal an evident rise with increasing H2S concentration when the concentration is lower than 0.2 mM, indicating the
charge relaxation course of the electric dual layer. Not only is the time constant but also the charge transfer resistance is improved. Features of inductance reactance arcs developed at low frequencies tend to become more obvious. When a small quantity of H2S is added, the anode reaction area
FeHS+ ions on the steel surface. At the same time, the double-layer capacitance decreases with the rise of adsorptive power the of anions, indicating that the corrosion course is restrained.
When the H2S concentration is within the 0.8–4 mM range, the semi-diameter of the capacity
reactance arcs developed at high frequencies clearly declines with the rise of the H2S concentration,
accelerating the electric double layer’s charge relaxation course. Declines in both the time constant and the charge transfer resistance are observed. This indicates that the increased H2S concentration can act
[image:7.596.137.458.260.484.2]as a promoter of the corrosion process. An arc that is similar to a capacity reactance arc can be seen in the low-frequency area, which likely to be due to the disintegration of the sulfide film. Consequently, for the sulfide film developed on the electrode surface with many flaws, its discontinuities and drawbacks rise with the improvement of H2S concentration, further promoting the corrosion process.
Figure 5. EIS Nyquist plot of steel placed in different H2S concentrations under the coexistence of H2S
and CO2 (CCO2 = 10 mM).
There is a difference between the equivalent circuit applied for the purpose of fitting the EIS results for the steel for the H2S concentration within the 0–0.2 mM range, and the equivalent circuit
applied for the purpose of fitting EIS results for the steel when the H2S concentration is in the 0.8–4
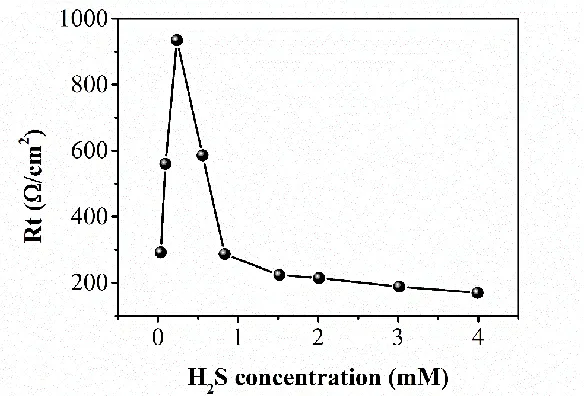
mM range. The equivalent circuits’ parameters are defined as follows: Rs represents the electrolyte resistance between the working electrode and the control electrolyte; Qdl represents the fixed phase element of the electric double layer capacity between the electrolyte and the corrosion product film; Rt represents the charge transfer resistance; L represents the inductive resistance; RL represents the inductive reactance resistance; C represents the fixed phase element of the corrosion product film capacitor, and RC represents the film resistance. The Rt values of the steel placed in different H2S
concentrations under the coexistence of H2S and CO2 (CCO2 = 10 mM) are shown in Figure 6 and were
fit using the ZSIMPWIN program package. The Rt rises quickly when the H2S concentration increases
mM to 4 mM. The Rt relies greatly on the corrosion product film on the steel surface. With the micro-concentration of H2S, the density of the film structure tends to be higher with the growing H2S
concentration and the overlapping and the adhesion stress of the corrosion product film are enhanced continuously, leading to a higher resistance for the charge through the electric double layer; therefore, the corrosion course is restrained. When the H2S concentration grows further, some sections of the
corrosion product film become less dense and even decrease, and the protective effect of the corrosion product film is deteriorated. The Rt declines step by step, showing that the corrosion behavior occurs faster. These results are in accordance with data in connection with the corrosion rate.
Figure 6. Charge transfer resistance of the steel placed in different H2S concentrations under the
coexistence of H2S and CO2 (CCO2 = 10 mM).
4. CONCLUSIONS
Under an environment where H2S coexists with CO2 (CCO2 = 10 mM), a decline in the general
corrosion rate is observed with the rise in H2S concentration, and later, the rate shows an improvement
tendency. With further improvement of H2S concentration, the steel tends to exhibit localized
corrosion. Under the environment where H2S coexists with CO2 (CCO2 = 10 mM) and the concentration
of H2S is within the scope of 0–0.2 mM, more FeS deposition is generated or more FeHS+ ions adsorb
and disintegrate continuously on the electrode surface with the rise of H2S concentration; as a result,
the inhibition of the corrosion process is accomplished. Under the environment where H2S coexists
with CO2 (CCO2 = 10 mM) and the concentration range of H2S is within 0.8–4 mM, some sections of
the corrosion product film tend to be less dense and even removed, and the protective effect of the corrosion product film is deteriorated; as a result, the corrosion process is accelerated.
References
[image:8.596.153.445.225.423.2]
(1980)1007.
2. D. Shoesmith, T. Rummery, M. Bailey and D. Owen, Journal of the Electrochemical Society, 127 (1980)27.
3. T. Kudo, H. Tsuge and T. Moroishi, Corrosion, 45 (1989)831.
4. S. Al-Hassan, B. Mishra, D. Olson and M. Salama, Corrosion, 54 (1998)480. 5. J. Al-Hajji and M. Reda, Corrosion, 49 (1993)363.
6. Y. Zheng, J. Ning, B. Brown and S. Nešić, Corrosion, 72 (2016)679. 7. G. Schmitt, Corrosion, 47 (1991)285.
8. J. Crolet, Matériaux & Techniques, 104 (2016)206. 9. K. Videm and J. Kvarekvål, Corrosion, 51 (1995)260.
10. O. Conlette, N. Emmanuel and O. Chijoke, Microbial Ecology, 72 (2016)175. 11. A. Ikeda, S. Mukai and M. Ueda, Corrosion, 41 (1985)185.
12. D. Jingen, Y. Wei, L. Xiaorong and D. Xiaoqin, Petroleum Science and Technology, 29 (2011) 1387.
13. S. Collins, K. Davey, J. Chu and B. O'Neill, Chemeca 2016: Chemical Engineering-Regeneration, Recovery and Reinvention, (2016)209.
14. H. Ma, X. Cheng, G. Li, S. Chen, Z. Quan, S. Zhao and L. Niu, Corrosion science, 42 (2000) 1669.
15. E. Abelev, T. Ramanarayanan and S. Bernasek, Journal of The Electrochemical Society, 156 (2009)C331.
16. S. Nešić, Corrosion Science, 49 (2007)4308.
17. Z. Yin, W. Zhao, Z. Bai, Y. Feng and W. Zhou, Electrochimica Acta, 53 (2008)3690. 18. A. Davoodi, M. Pakshir, M. Babaiee and G.R. Ebrahimi, Corrosion Science, 53 (2011)399. 19. J. Tang, Y. Shao, J. Guo, T. Zhang, G. Meng and F. Wang, Corrosion Science, 52 (2010)2050. 20. Y. Qi, J. Yang, C. Zhang and Z. Zhang, Corrosion Engineering, Science and Technology, 51 (2016)
507.
21. C. Man, C. Dong, H. Xue, K. Xiao, X. Li and H. Qi, International Journal of Minerals, Metallurgy, and Materials, 23 (2016)769.
22. Z. Wang and J. Zhang, Corrosion Reviews, 34 (2016)17.
23. X. Huang, Y. Qi, C. Chen, H. Yu and G. Lu, Corrosion Engineering Science & Technology, 50 (2015)169.
24. R. Elgaddafi, R. Ahmed and S. Shah, Research Journal of Applied Sciences Engineering & Technology, 13 (2016)510.
25. L. Zhang, R. Ding, J.W. Yang and M. Lu, Journal of University of Science & Technology Beijing, 31 (2009)563.
26. Z. Yin, W. Zhao, Z.Q. Bai, Y. Feng and W. Zhou, Electrochimica Acta, 53 (2008)3690. 27. C. Wang, Materials Science Forum, 852 (2016)90.
28. L. Xu and Y. Cheng, Corrosion Science, 51 (2009)2330. 29. D. Rickard, Chemical Geology, 78 (1989)315.
30. D. Rickard, Geochimica et Cosmochimica Acta, 59 (1995)4367.