Working Paper Research
Understanding sectoral differences in downward
real wage rigidity : workforce composition,
institutions, technology and competition
by Philip Du Caju, Catherine Fuss and Ladislav Wintr
NBB WORKING PAPER No.156 - FEBRUARY 2009
Editorial Director
Jan Smets, Member of the Board of Directors of the National Bank of Belgium
Statement of purpose:
The purpose of these working papers is to promote the circulation of research results (Research Series) and analytical studies (Documents Series) made within the National Bank of Belgium or presented by external economists in seminars, conferences and conventions organised by the Bank. The aim is therefore to provide a platform for discussion. The opinions expressed are strictly those of the authors and do not necessarily reflect the views of the National Bank of Belgium.
Orders
For orders and information on subscriptions and reductions: National Bank of Belgium, Documentation - Publications service, boulevard de Berlaimont 14, 1000 Brussels Tel +32 2 221 20 33 - Fax +32 2 21 30 42
The Working Papers are available on the website of the Bank: http://www.nbb.be
© National Bank of Belgium, Brussels All rights reserved.
Reproduction for educational and non-commercial purposes is permitted provided that the source is acknowledged. ISSN: 1375-680X (print)
Abstract
This paper examines whether differences in wage rigidity across sectors can be explained by differences in workforce composition, competition, technology and wage-bargaining institutions. We adopt the measure of downward real wage rigidity (DRWR) developed by Dickens and Goette (2006) and rely on a large administrative matched employer-employee dataset for Belgium over the period 1990-2002. Firstly, our results indicate that DRWR is significantly higher for white-collar workers and lower for older workers and for workers with higher earnings and bonuses. Secondly, beyond labour force composition effects, sectoral differences in DRWR are related to competition, firm size, technology and wage-bargaining institutions. We find that wages are more rigid in more competitive sectors, in labour-intensive sectors, and in sectors with predominant centralised wage-setting at the sector level as opposed to firm-level wage agreements.
Key-words: wage rigidity, matched employer-employee data, wage-bargaining institutions. JEL-code: J31.
Corresponding authors:
Philip Du Caju, NBB, Research Department, e-mail: [email protected].
Catherine Fuss, NBB, Research Department and Université Libre de Bruxelles, e-mail: [email protected].
Ladislav Wintr, Central Bank of Luxembourg, Economics and Research Department,
e-mail: [email protected].
This paper contains research conducted within the Wage Dynamics Network (WDN). The WDN is a research network consisting of economists from the European Central Bank (ECB) and the national central banks (NCBs) of the EU countries.
Acknowledgments: Our thanks to W. Dickens for providing us with the International Wage Flexibility Project (IWFP) estimation programmes. We also thank CIMIRe, the Datawarehouse Labour Market of the Belgian Social Security System and Statistics Belgium for giving us access to the individual datasets. We are also grateful to participants of the WDN meetings and our colleagues for fruitful discussions. The paper was prepared while Ladislav Wintr was working at the National Bank of Belgium..
NBB WORKING PAPER - No. 156 - FEBRUARY 2009
TABLE OF CONTENTS
1. Introduction ... 1
2. Institutional background, data, and methodology ... 3
2.1 Institutional background ... 3
2.2 Data ... 5
2.3 Methodology ... 8
2.3.1. Measuring downward real wage rigidity ... 8
2.3.2. Explaining differences in DRWR across sectors ... 10
3. Results ... 12
3.1 Estimates of downward real wage rigidity ... 12
3.2 Workforce characteristics and composition effects ... 14
3.3 Sector-specific factors driving DRWR: technology, competition and institutions ... 15
4. Conclusion ... 21
References ... 23
Appendix A: Data ... 26
Appendix B: Robustness ... 30
1. Introduction
Over the last few decades, substantial effort has been devoted to measuring wage rigidity and understanding its macroeconomic implications. Macroeconomic theories have singled it out as a source of resistance to wage moderation and therefore as a cause of high and persistent unemployment (see e.g. Jackman et al., 1991). Moreover, it was suggested that rigid wages can be a cause of less frequent changes in prices of products with a high labour share (see Altissimo et al., 2006, Alvarez et al., 2006, Dhyne et al., 2006, Vermeulen et al., 2007). In turn, price stickiness leads to higher output volatility in response to shocks, which requires larger interest rate changes to affect inflation (see e.g. Altissimo et al., 2006). For example, the New-Keynesian model of Blanchard and Gali (2007) shows that, under real wage rigidity and price rigidity, the optimal monetary policy is no longer focused on inflation targeting, and should instead aim to reduce, although not eliminate altogether, the volatility of both inflation and unemployment.
Although many papers provide estimates of wage rigidity, few examine the factors underlying wage rigidity. For this aim, a comparison between the extent of wage rigidity across well-defined samples, such as countries, individuals, or sectors, is needed. This paper investigates the sources of wage rigidity using a large matched employer-employee dataset of individual earnings backed up with additional firm-level and sector-level data. Labour market rigidities can differ substantially between groups of workers and between sectors of economic activity. Analysing differences across sectors is a natural approach to finding relevant factors of wage rigidity. In particular, it provides the appropriate aggregation level for product market competition and institutional arrangements on wage bargaining. In Belgium, wage bargaining takes place primarily at the sector level. The outcomes of these collective agreements have a strong influence on individual wages and wage changes. However, at the individual firm level, wages may be set above the sector minima, creating a wage cushion that enhances flexibility.
Differences in wage rigidity according to worker types were pointed out by Campbell (1997). He finds that wage flexibility, defined as the responsiveness of occupational wages to aggregate unemployment, is higher for blue-collar workers than for white-collar workers. Du Caju et al. (2007) provide estimates of downward wage rigidity using the same data and methodology as in this paper. They highlight differences across occupation, age, wage level, etc. but provide no formal statistical tests of these differences.
The literature on wage rigidity involving a sectoral dimension is rather limited. Asking professional wage-setters about the reasons for wage rigidity, Agell and Bennmarker (2007) find that the effects of firms' profits on wages are important in manufacturing and skilled service sectors, and less important in unskilled services and in the public sector. They interpret this as an indication of incumbent workers' bargaining power and therefore as a possible source of rigidity. Campbell (1989, 1991) provides measures of wage flexibility for the United States, Canada and France based on the response of level wages to the aggregate unemployment rate and to sector-specific product demand. Among others, he finds that sectors with a larger percentage of blue-collar workers are characterised by a higher degree of wage flexibility. His results for the United States also indicate that wage flexibility is lower in more capital-intensive sectors. Finally, he finds no robust evidence that unionisation reduces wage flexibility.
In sum, the existing literature identifies several variables driving wage rigidity, such as those related to workers (e.g. occupation), the firm's characteristics (size, sector), production technology (capital intensity), or labour market institutions (for example, unionisation and wage bargaining). However, none of the studies mentioned above provides statistical tests of differences between the categories after controlling for the impact of labour force composition. The composition effects might be especially relevant at the sector level, as some sectors demand very specific labour with respect to skills. For instance, the construction sector employs a disproportionate number of blue-collar workers. The aim of this paper is to determine the relevant factors explaining differences in wage rigidity across sectors. We evaluate the importance of labour force composition, sector-specific characteristics such as firm size, capital intensity and competition, and sector-sector-specific institutional features related to wage bargaining.We rely on a large microeconomic dataset on individual earnings from administrative sources for Belgium over the period 1990-2002. Du Caju et al. (2007) use the same dataset and show that there is virtually no downward nominal rigidity (DNWR) during this period in Belgium, a country with full automatic indexation of wages. For this reason, we focus on downward real wage rigidity (DRWR) which we estimate using the procedure described in Dickens and Goette (2006).
wage cuts and concentration of wage changes around some natural reference point such as zero or the inflation rate (see Kahn, 1997, Card and Hyslop, 1997, or more recently, Dickens et al., 2006, 2007).
Using a large microeconomic dataset provides enough freedom to evaluate DRWR for narrowly-defined samples. For example, we are able to estimate DRWR for young blue-collar workers in a given industry in a particular year. By doing so, we can better examine differences across workers and assess potential effects of workforce composition on sector-level DRWR. Although measures of wage flexibility can be obtained by regressing sector-level wage data (as in Campbell, 1989, 1991) on aggregate unemployment and sector-level growth, it is more difficult to derive such measures for occupational groups since there is no natural proxy for economic conditions. Using a measure of wage rigidity based on individual wage data allows us to examine in a consistent way differences across workers and differences across sectors. One characteristic of our measurement compared to aggregate methods is that we focus on wage changes of workers in a continuing employment relationship. Results from Fehr and Goette (2005) for Switzerland and Haefke et al. (2008) for the United States indicate that aggregate wage flexibility may be larger thanks to a stronger response of entrant wages to economic fluctuations. However, in Belgium the
existence of pay scales may limit the scope for differentiated pay policy.1
The paper is organised as follows. Section 2 describes the dataset, relevant institutional features of the Belgian labour market and sector-specific characteristics, as well as the methodology. Results are reported in Section 3. First, we provide some estimates of DRWR. These highlight substantial differences across workers and sectors. Second, we examine differences across worker types and shed light on the importance of labour force composition effects. Next, we investigate additional factors explaining differences in downward real wage rigidity between sectors. Section 4 concludes. Appendix A defines the variables used in the paper, while Appendix B provides robustness tests with respect to outliers and alternative definitions of variables.
2. Institutional background, data, and methodology
2.1 Institutional background
Some important institutional features of the labour market affect individual wages in Belgium, such as indexation and sector-level collective bargaining agreements, which can possibly be supplemented with agreements concluded at the firm level. These features explain why Belgium is characterised as a country with high real wage rigidity (see Dickens et al., 2006, or Du Caju et al., 2007). We briefly describe these characteristics of the Belgian labour market. Firstly, as in several countries, a minimum wage is legally binding. Also, practically all employees' gross wages are
linked to a consumer price index through an automatic indexation mechanism.2 This effectively
limits the scope for real wage cuts and explains why Belgium has been characterised as a country with high downward real wage rigidity and low nominal wage rigidity.
Secondly, as in many other countries, wages in Belgium are largely determined at the sector level. The level of gross wages is mainly determined through agreements concluded in joint
committees set up for each sector of economic activity.3 In many sectors, pay scales are set for
blue-collar and white-collar workers separately. This may contribute to observed differences in wage dynamics for blue- and white-collar workers. Indeed, in the joint committees for blue-collar workers, pay scales are primarily fixed in relation to the job description. Variations depending on age or length of service are not common. For white-collar workers, the pay scale usually varies not
only according to category, but also depending on age or tenure.4 The joint committees at the
sector level are also the main bargaining unit for the negotiations on collective wage increases. Quite often, these collective wage increases are defined as a rise in absolute terms of the (sometimes only minimum) pay scales, meaning that employees with wages above the scale can obtain a lower percentage collective wage increase. For the period under review, a lot of employees receive automatic wage increases, negotiated in sector-level collective agreements. These depend on age and, to a lesser extent, tenure.
In addition, firm-level agreements can complement sector-specific agreements. According to the favourability principle in hierarchical wage bargaining, the negotiated wages in these firm-level
agreements cannot be below the sectoral agreements.5 Decentralised wage setting through
single-employer (SE) wage agreements is very common in the chemicals and transport equipment industries, and very rare in the construction and business services sectors. Also firm-level agreements are more common in large firms with stronger union representation than in smaller firms. Note that union representation is compulsory in firms with 50 employees or more. SE collective wage agreements make it possible to take firm-specific features more closely into account in the wage-setting process. In Belgium, companies that do not have a firm-level agreement tend to stick to the sector agreement. Firms with an SE agreement generally pay more and have a more dispersed earnings structure. This provides them with a wage cushion above the sector minima, creating some margin of manoeuvre for wage adjustments. Individual data from the Belgian Structure of Earnings Survey (SES) show that firms with SE agreements for blue-collar and
2 Specifically, the index considered is the consumer price index excluding alcoholic beverages, tobacco and motor fuels. In some segments of the labour market, wages are indexed at fixed points in time (e.g. every one to twelve months), while in others, wages are index-linked each time the index exceeds a certain threshold (the threshold value is defined as the previous value plus two percent).
3 They are called joint committees ('commissions paritaires'), because employers and employees share an equal representation in them. As the notion of economic sector is sometimes very narrowly defined, the number of joint committees exceeds 100. The outcome of these sector-specific negotiations cannot undercut the legally determined guaranteed minimum wage. The actual minimum pay by sector, occupation and sometimes age or tenure, defined within joint committees, exceeds the legally guaranteed minimum. There are some exceptions for workers less than 21 years old.
4 During the period under review, age-related pay scales were not against European anti-discrimination rules and were applicable to the majority of Belgian white-collar workers.
white-collar workers pay 12% higher earnings and bonuses are 53% higher. Furthermore, the standard deviation of earnings is 2% larger, and that of bonuses is 16% larger in firms with SE agreements compared to firms with no SE agreements. In view of these gaps, one may expect to find less DRWR in sectors where SE agreements are more common, as is the case when firms are larger.
2.2 Data
To measure downward real wage rigidity, we rely on an administrative employer-employee database on individual labour earnings for Belgium, collected by the social security system. The data contain information on annual gross earnings (including bonuses and compensation for overtime hours), annual working days, age, sex and occupation category (blue-collar or white-collar). The dataset contains a sample of around one-third of workers in the private sector and
covers the period 1990-2002. It includes all persons that were born between the 5th and the 15th
day of any month, except those employed by firms with less than 5 employees or by independent workers. The dataset covers all sectors of activity including services. We focus on in firms active in branches with NACE codes from D to K, i.e. we exclude agriculture, extraction industries and non-commercial services.
We restrict the sample to workers above the legal minimum age of compulsory schooling and below the retirement age, i.e. men between 18 and 64 and women between 18 and 59. We also exclude earnings below the legal minimum wage and we drop the same number of observations from the upper tail of the distribution. In this way, we attempt to exclude outliers and possibly extreme variations in individual annual earnings. Finally, we restrict the sample to full-time permanent job stayers. Since the dataset does not report the type of contract (fixed-term or indeterminate length), we define these permanent job stayers as working at least 11 months for the same employer over two consecutive years. In this way, we allow permanent workers to have at most one month of sick leave (or other "abnormal" days off) per year, in order to distinguish them from temporary workers. We refer to Du Caju et al. (2007) for more details on the data.
It is important to note that annual earnings include variable compensation components, such as bonuses, premia, and overtime hours. Not all of these are subject to automatic increases such as indexation and collectively bargained increases. Therefore, annual earnings may be more flexible than the base wage. Further, because the importance of extra wage components varies across workers, firms and sectors, these may explain differences of wage rigidity across sectors. For example, bonuses and premia may be higher for white-collar workers, older and higher-earnings employees, while compensation for overtime hours may be more common for blue-collar workers.
The individual earnings data are complemented with information from firms' balance sheets.6
Also, we use individual data from the Belgian Structure of Earnings Survey (SES), for the 1999, 2000, 2001 and 2002 waves.
Individual annual earnings data are used to estimate downward real wage rigidity by occupation, age category and sector. These rigidity measures are then related to three types of variables, namely worker characteristics, sector characteristics and decentralisation of wage bargaining. The first set consists of variables related to worker type. This is the case of the occupation dummy that equals unity for blue-collar workers, and of age dummies that identify workers aged between 18 and 24 years, those between 25 and 44 years old, and those older than
45.7 We also consider the median level of earnings, computed from the individual earnings dataset,
and the median level of bonuses, as reported in the four SES waves between 1999 and 2002. Note that this variable includes compensation for overtime hours.
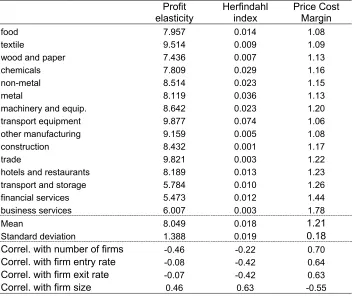
The second set of variables describes sectoral characteristics. From firms' balance sheets, we define the median firm size as the median within the sector of the number of employees, and the capital-labour ratio as the median within the sector of firm-specific capital-labour ratios. Moreover, we estimate a measure of competition recently proposed by Boone et al. (2007), i.e. the elasticity of a firm's profits with respect to its marginal costs (profit elasticity). The intuition behind profit elasticity is that firms in less competitive sectors are not pure price takers, hence a given percentage increase in costs can be accommodated by a price rise, in turn leading to a smaller fall in profits. The profit elasticity is thus larger for more competitive firms. Using firm-level data for each branch, we regress log profits on log variable costs (for more details on theoretical derivation as well as its relation to other measures of competition, see Appendix A). As a robustness test, we also consider two alternative measures of competition: the Herfindahl index which measures concentration within the sector, and sector-specific estimates of the price cost margin given by Christopoulou and Vermeulen (2007). As argued in Boone et al. (2007), the three measures would correctly capture strengthened competition resulting from a fall in entry costs and a consequent increase in the number of firms. However, the Herfindahl index fails to capture any increase in competition that might cause inefficient firms to close down, because in such a case, concentration in the industry increases. It would nevertheless be misleading to interpret this as a fall in competition. Further, these authors argue that empirical measures of the price-cost margin, such as the ratio of profits to sales, may be less suited in highly concentrated markets. The estimates of Christopoulou and Vermeulen (2007) rely on the estimation of structural equation, but they are time-invariant. Because the profit elasticity overcomes the drawback of the other measures and is time-varying, it is our preferred measure of competition.
Finally, the third type of variable refers to sectoral wage bargaining practices, i.e. the coverage by collective wage agreements at the sector or firm level. For Europe in general and Belgium in particular, this provides a much better indicator of union bargaining power than union membership, for example. The reason is that, unlike in the US, wage agreements are negotiated between employers' representatives and workers' representatives, but apply to all workers, regardless of whether they are unionised or not. As explained above, sector-level multi-employer agreements apply generally in Belgium. As an indicator of decentralised wage setting, we calculate the average
proportion over time (1999-2002) of workers covered by a single-employer (SE) wage agreement, from the SES dataset. Such agreements are expected to provide the firm with more flexibility as compared to the multi-employer (ME) agreements. Moreover, firms applying SE agreements are more likely to negotiate individually wage conditions that are more favourable than those of the collective agreement for part of their workforce, as indicated by a larger wage dispersion in firms that have their own wage agreement. Appendix A gives more information on data sources and definitions.
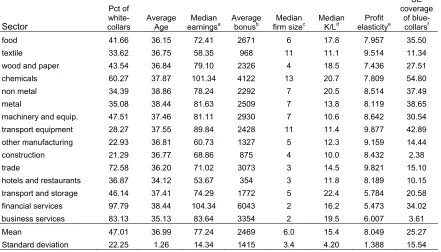
[image:11.595.79.520.362.614.2]Table 1 provides information on sectoral differences in the variables of interest. For example, the proportion of blue-collar workers is very large in the construction and other manufacturing sectors, and very low in financial and business services. Earnings and bonuses are particularly high in the chemical industry and in financial services. At the other extreme, earnings and bonuses are the lowest in the construction, and hotels and restaurants sectors. Turning to production characteristics, chemicals, non-metal manufacturing, transport storage and business services are capital-intensive sectors, while construction is the most labourintensive industry. Firms are larger in chemicals, textiles and transport equipment industries, and smaller in services.
Table 1 - Labour force composition, wages and sector characteristics - averages over time
Sector
Pct of white- collars
Average Age
Median
earningsa Average bonusb firm sizeMedian c Median K/Ld elasticityProfit e
SE coverage
of blue-collarsf
food 41.66 36.15 72.41 2671 6 17.8 7.957 35.50
textile 33.62 36.75 58.35 968 11 11.1 9.514 11.34
wood and paper 43.54 36.84 79.10 2326 4 18.5 7.436 27.51
chemicals 60.27 37.87 101.34 4122 13 20.7 7.809 54.80
non metal 34.39 38.86 78.24 2292 7 20.5 8.514 37.49
metal 35.08 38.44 81.63 2509 7 13.8 8.119 38.65
machinery and equip. 47.51 37.46 81.11 2930 7 10.6 8.642 30.54
transport equipment 28.27 37.55 89.84 2428 11 11.4 9.877 42.89
other manufacturing 22.93 36.81 60.73 1327 5 12.3 9.159 14.44
construction 21.29 36.77 68.86 875 4 10.0 8.432 2.38
trade 72.58 36.20 71.02 3073 3 14.5 9.821 15.10
hotels and restaurants 36.87 34.12 53.67 354 3 11.8 8.189 10.15
transport and storage 46.14 37.41 74.29 1772 5 22.4 5.784 20.58
financial services 97.79 38.44 104.34 6043 2 16.2 5.473 34.02
business services 83.13 35.13 83.64 3354 2 19.5 6.007 3.61
Mean 47.01 36.99 77.24 2469 6.0 15.4 8.049 25.27
Standard deviation 22.25 1.26 14.34 1415 3.4 4.20 1.388 15.54
Notes: a Gross total daily earnings in euro.
b Annual bonuses in euro. c Number of employees.
d Median capital-labour ratio measured in thousands of euro.
e Values calculated for each branch and year. The table reports median over years. f Percentage of blue-collar workers employed in firms with single-employer agreement.
appendix. Finally, it should be noted that decentralised bargaining through SE agreements is much more widespread in the chemical industry and is essentially absent in the construction and business services, i.e. in sectors with centralised bargaining.
2.3 Methodology
This paper investigates the determinants of the differences in DRWR across workers and sectors. We focus on DRWR because previous results characterise Belgium as a country with one of the highest levels of DRWR and one of the lowest levels of DNWR (Dickens et al., 2007, Du Caju et al., 2007), consistent with the system of automatic wage indexation. For this purpose, we proceed in two steps. First, we estimate DRWR year by year for each group, defined either by occupation, age and sector, or simply by sector of economic activity. Second, we regress our measure of DRWR on a set of potential explanatory variables.
2.3.1 Measuring downward real wage rigidity
Our measure of DRWR is based on the methodology described in Dickens and Goette (2006).8
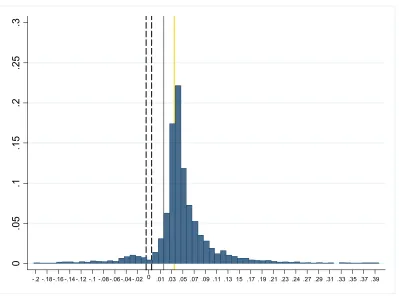
This measure attempts to capture the fraction of workers who would not receive a real wage cut when they were due for one, no matter what the reason for the wage cut. Briefly, the method is based on the comparison of the observed distribution of individual nominal wage changes with the notional distribution, i.e. the one that would prevail under perfect wage flexibility. The latter is assumed to be symmetric. On the contrary, downward wage rigidity typically generates asymmetry and spikes around the reference point. The reference point for real wage rigidity is expected inflation, and that for nominal wage rigidity is zero. Indeed, wage changes that would have fallen below the reference point under perfect flexibility will appear at or above the reference point in the observed distribution. Therefore, the observed distribution of individual wage changes will be characterised by fewer observations below the median than above it, i.e. it will be asymmetric. Moreover, wage changes that would have been below the reference point under perfect flexibility may be concentrated at the reference point, generating a spike in the observed distribution of wage changes. As an illustration, figure 1 below shows the histogram of earnings changes for textiles in 2002. The asymmetry of the distribution is quite clear, as is the spike around the collective wage increase level.
8 We make the following choice of the parameters., We allow the mean of πe to be unrestricted in the 0-4
0
.0
5
.1
.1
5
.2
.2
5
.3
0
[image:13.595.82.481.54.352.2]-.2 -.18 -.16 -.14 -.12 -.1 -.08 -.06 -.04 -.02 .01 .03 .05 .07 .09 .11 .13 15 .17 .19 .21 .23 .24 .27 .29 .31 .33 .35 .37 .39
Figure 1 - Distribution of earnings changes for the textile industry in year 2002
Note: grey solid line shows the economy-wide CPI inflation while the yellow line is the economy-wide total collective wage increase.
Dickens and Goette (2006) propose a Mixed Method of Moments estimator to evaluate the extent of DNWR, the level of DRWR as well as the reference point for real wage rigidity. This method has been applied within the International Wage Flexibility Project (Dickens et al., 2007), and more recently in the Wage Dynamics Network for Belgium (Du Caju et al., 2007), Messina et al., 2008). The method offers several advantages. First, the reference point for real wage rigidity, i.e. expected inflation, is directly estimated from the data rather than provided by the econometrician based on outside estimates. Second, the method takes into account measurement errors in the wage changes variable. Third, it requires only information on wage changes. However, because it is based on the estimated distribution of wage changes, it demands datasets with a large cross-section dimension. Among its drawbacks is the fact that identifying DRWR and DNWR becomes an issue in years with very low inflation, where the reference point for DRWR comes very close to zero, i.e. the reference point for DNWR.
Another strand of the literature proposes alternative measures of downward wage rigidity based on the idea that it implies a smaller response of wages to adverse shocks than to positive outcomes (see, for example, Altonji and Devereux, 1999, or Biscourp et al., 2005). The concept is appealing because it takes into account the motives to cut wages, but it is very demanding in terms of data as it requires information on relevant workers’ and firms’ characteristics.
hand, if one observes asymmetry in the distribution of wage changes, one should a fortiori find that wages do not respond to negative signals. Therefore the two approaches should lead to identical conclusions about the presence of downward of wage rigidity. A more important difference arises with respect to estimates of the sensitivity of wages to shocks at a more aggregated level. Consider, for example, an adverse shock. Firms may reduce their average wage bill by changing
the composition of their workforce, even if the wages of job stayers do not fall. In this case, the
distribution of individual earnings changes will exhibit no wage cuts, while the estimation of aggregate wage sensitivity will suggest that the average wage has fallen.
2.3.2 Explaining differences in DRWR across sectors
In order to test formally for differences across worker types and the importance of workforce composition in explaining differences in DRWR across sectors, we proceed in two steps. First, we estimate DRWR using the IWFP procedure described in the previous subsection. Second, the estimates of DRWR serve as dependent variables in regression equations with explanatory factors entering as independent variables. We disregard DNWR because our previous findings have shown it to be of little of importance for Belgium (Du Caju et al., 2007).
The dataset enables 90 categories to be considered for each year, defined as the combination of 15 branches, 2 occupation categories and 3 age groups. We consider two occupational categories (blue-collar and white-collar workers) and three age groups (18-24 years, 25-44 years, and 45 years or more). Branches have been defined as follows: (1) food (food products, beverages and tobacco), (2) textile (textiles, textile products, leather and footwear), (3) wood and paper (wood and products of wood and cork, and pulp, paper, paper products, printing and publishing), (4) chemicals (chemical, rubber, plastics and fuel products), (5) non-metal (other non-metallic mineral products), (6) metal (basic metals and fabricated metal products), (7) machinery and equipment, (8) transport equipment, (9) other manufacturing (manufacturing n.e.c., recycling), (10) construction, (11) trade (wholesale and retail trade, repair), (12) hotels and restaurants, (13) transport and storage, (14) financial services (financial intermediation), (15) business services (real estate, renting and business activities). In order to keep enough observations in each category to estimate DRWR, we exclude categories with less than 2,000 observations of earnings changes. Also, we do not consider energy (electricity, gas and water supply) and transport and
communication (post and telecommunications) because either the estimates of DRWR are not
reliable or the observations appear to be outliers in the regressions estimated below. We also rule out estimates of DRWR that hit the boundary of zero or one as being unreliable (142 cases).
We perform two types of analysis. First of all, we test for significant differences in DRWR across workers. Secondly, we examine factors that explain differences in DRWR across sectors. In the first case, we estimate DRWR for each year, occupational group, age group and sector.
Formally, we denote the estimates of downward real wage rigidity as DRWRkajt, where k stands for
represented by the subscript j and the year by t. The regression equations that we estimate take the following form:
DRWRkajt = αt + β1 D white-collarkajt + β2 D age:25-44kajt + β3 D age:45+kajt + β4 Xkajt + εkajt, (1)
where αt is a time-varying constant, D indicates that the variable is a dummy and Xkajt stands for a
continuous explanatory variable, like earnings or bonuses.
In the second case, in order to analyse the impact of workforce composition, technology, competition and bargaining institutions on differences in DRWR across sectors, we follow the same idea as above, except that we now only estimate DRWR across 15 sectors and over several years. In the following regression, our explanatory variables are defined only over sectors and years. We control for workforce composition by adding the average age of workers and the percentage of blue-collar workers, both defined by sector and year. We consider the effect of each explanatory variable on its own after controlling for workforce composition. In a later stage, we combine the explanatory variables into a single model along the following lines:
DRWRjt = αt + β1 agejt + β2 blue-collarjt + β3 sizejt + β4 K/Lj + β5 profit elasticityjt +
+ β6 SE coveragejt + εjt, (2)
where K/L is the capital-labour ratio, profit elasticity is our preferred measure of competition and SE coverage stands for the percentage of blue-collar workers covered by single-employer collective agreements.
and the decentralisation of wage bargaining.9 However, given the small number of time periods
(12) and sectors (15), our view is that using sophisticated econometric corrections (such as bootstrap methods or clustered robust standard errors) is beyond the scope of what can be learned from our data. It should be noted that the above-mentioned issues do not affect the point estimates of the coefficients.
3. Results
In Section 3.1, we introduce the values of DRWR that were estimated by the IWFP procedure and compare the average levels across age and occupation categories and across sectors. We discuss possible explanations for the differences and compare the results with other findings in the literature. Section 3.2 tests the importance of workforce composition effects for DRWR in a model varying over sectors, age and occupation categories and time. At the same time, we consider the effect of earnings level and bonuses on DRWR. Section 3.3 focuses solely on differences across sectors and analyses DRWR varying only across sectors and years. We investigate the role of firm size, capital to labour ratio, profit elasticity and decentralisation of wage bargaining. We examine the effect of each explanatory variable on its own after controlling for workforce composition. Finally, the explanatory variables are combined into a single model which is then used to decompose the contribution of each variable to sector-specific DRWR. Robustness tests with respect to the estimation issues discussed in the preceding section are reported in Appendix B.
3.1 Estimates of downward real wage rigidity
Table 2 presents the average values of DRWR for the sectors and worker categories considered in this paper. The average DRWR across sectors, equal to 0.58, is in line with our previous findings (see Du Caju et al., 2007) and points towards strong downward real wage rigidity in Belgium. Such a high value ranks Belgium as the country with the highest DRWR among the 16 countries participating in the Inflation Wage Flexibility Project (cf. Figure 4 in Dickens et al., 2006).
Table 2 documents that white-collar workers have more rigid earnings than blue-collar workers. The numbers reported in Table 2 imply that the estimated fraction of white-collar workers subject to DRWR is 10 percentage points higher than that of blue-collar workers. The same conclusion was reported by Campbell (1997) for the US, based on the observation that wages of white-collar workers are much less responsive to the aggregate unemployment rate than blue-collar workers' wages. This result is consistent with the shirking model of Shapiro and Stiglitz (1984) and with the turnover model of Stiglitz (1974). These models are based on the idea that firms may be less inclined to cut wages of white-collar workers because they are more difficult (costly) to replace and
to monitor, and therefore are more likely to shirk their jobs. Franz and Pfeiffer (2006) report survey evidence for Germany indicating that the main reasons for wage rigidity of high-skilled workers are the existence of specific skills and the negative signal a wage cut may represent for newly-hired staff. On the contrary, wage rigidity of less-skilled workers is mainly attributable to labour union contracts and implicit contracts. In Belgium, in addition, white-collar workers obtain automatic wage increases with age or tenure, while this is rarely the case for blue-collar workers. This makes white-collar workers less likely to experience real wage cuts.
Table 2 - Estimates of DRWR
Category average DRWR st. dev. Blue-collar workers 0.580 0.261 White-collar workers 0.641 0.213 Workers aged 18-24 years 0.630 0.217 Workers aged 25-44 years 0.593 0.230 Workers older than 44 years 0.612 0.265
food 0.526 0.126
textile 0.600 0.178
wood and paper 0.648 0.108
chemicals 0.467 0.173
non-metal 0.483 0.101
metal 0.553 0.142
machinery and equip. 0.618 0.081 transport equipment 0.517 0.115 other manufacturing 0.681 0.277
construction 0.801 0.239
trade 0.648 0.188 hotels and restaurants 0.590 0.214 transport and storage 0.354 0.145 financial services 0.627 0.195 business services 0.668 0.114 Entire sample (av. over sectors) 0.581 0.193
Notes: DRWR estimated by the IWFP procedure, see Section 2. Results for sectors are averaged over years and the entire sample is the average over sectors and years. Results for occupational categories and age categories were obtained as averages from estimates of DRWR varying across occupation, age, sectors and years.
Young workers (aged between 18 and 24 years) have more rigid earnings than older workers, consistent with previous findings in Du Caju et al. (2007). The result may be explained by the shirking model and the adverse selection model of Weiss (1980) applied to job quits. It predicts that younger workers are more likely to quit when their earnings increases are below their expected bargaining reference point because the cost of job loss is smaller for them than for older workers, i.e. finding a job is more difficult for older workers and, in addition, they might lose their tenure-related component of compensation. Furthermore, automatic tenure and age-tenure-related wage increases are more prominent for younger workers, while extra wage components are smaller, leading to less flexible earnings.
and chemicals. Below, we consider a range of factors that can explain these differences in DRWR across workers and sectors.
3.2 Workforce characteristics and composition effects
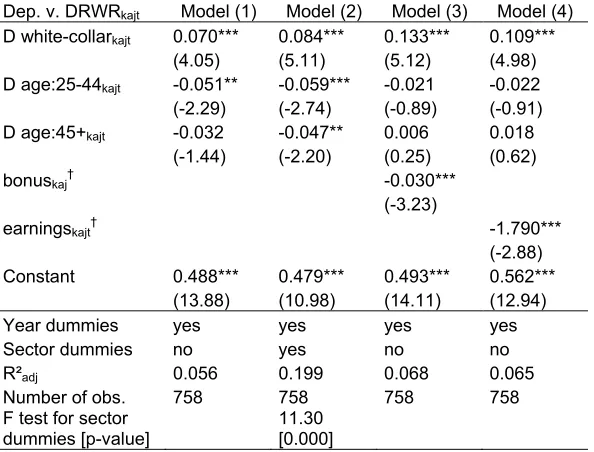
[image:18.595.80.377.286.512.2]In Table 2, we first test formally whether there are differences in DRWR across workers, then consider the impact of payroll policies on the level of DRWR. More specifically, we regress our measure of DRWR estimated for each year, occupation, age group and sector, on dummies for occupation and age category. We then expand the equation with the median earnings and median bonus per category. Table 2 presents the results estimated by least squares, Appendix B shows that the results are robust to accounting for a dependent variable bounded between zero and one.
Table 3 - OLS estimates of eq. (1), DRWR per year, occupation, age category and sector
Dep. v. DRWRkajt Model (1) Model (2) Model (3) Model (4)
D white-collarkajt 0.070*** 0.084*** 0.133*** 0.109***
(4.05) (5.11) (5.12) (4.98) D age:25-44kajt -0.051** -0.059*** -0.021 -0.022
(-2.29) (-2.74) (-0.89) (-0.91) D age:45+kajt -0.032 -0.047** 0.006 0.018
(-1.44) (-2.20) (0.25) (0.62) bonuskaj† -0.030***
(-3.23)
earningskajt† -1.790***
(-2.88)
Constant 0.488*** 0.479*** 0.493*** 0.562*** (13.88) (10.98) (14.11) (12.94) Year dummies yes yes yes yes Sector dummies no yes no no R²adj 0.056 0.199 0.068 0.065
Number of obs. 758 758 758 758 F test for sector
dummies [p-value] 11.30 [0.000] Notes: † measured in thousands of euro.
*/**/*** indicate significance at the 0.10, 0.05 and 0.01 level, respectively. t-statistics in brackets.
As discussed in Section 2.1, one of the reasons why younger workers may have more rigid wages is that the fraction of labour compensation due to flexible components such as bonuses and premia is typically smaller for younger people. Because these can be easily cut, earnings should be less rigid the larger the bonuses. Indeed, models (3) and (4) show that DRWR is lower for worker
categories and sectors with a higher bonuses and earnings.10 Further, when bonuses are included
in equation (1), age dummies are no longer significant. In the same vein, DRWR is lower for higher-earning categories. Besides the argument related to bonuses and premia, another explanation is that low wages are close to the institutional minimum wage or to sectoral pay scales and therefore cannot be reduced freely. Lastly, wage levels are typically higher and more dispersed in firms with
SE wage agreements as opposed to sector-level or multi-employer (ME) agreements.11 As argued
by Cardoso and Portugal (2005), higher and more dispersed wages in firms with SE agreements provide employers with a flexible wage cushion over and above the sectoral minima. This yields more flexibility in wage adjustment. We examine this issue in more detail in the next section.
In sum, we have shown that earnings of white-collar workers and workers between 18 and 24 years are significantly more rigid than those of blue-collar workers and older workers. Further, age-related aspects may explain inter-sectoral differences across workers rather than inter-sectoral differences in DRWR. The results also suggest that sector-specific factors should contribute to explaining DRWR beyond the effects of occupation and age. Finally, as expected, bonuses and higher earnings generally tend to lower downward real wage rigidity.
3.3 Sector-specific factors driving DRWR: technology, competition and institutions
In order to analyse additional factors that drive differences in DRWR across sectors, like technology, competition and wage-bargaining institutions, we consider a dataset that varies only across sectors and over time. We estimate similar equations to those used in the previous section, except that we replace age and occupation dummies by average age and the percentage of blue-collar workers per sector and year to control for workforce composition.
We disregard the earnings level and bonuses because these variables are the outcome of the firm’s compensation policy, as is DRWR, and are therefore potentially endogenous. We prefer to keep variables that are independent of the firm's pay policy, such as competition indicators, capital intensity or SE agreement coverage.
Table 4 reveals that, with the exception of two models, average age and the percentage of blue-collar workers are not statistically significant. Combined with our previous results presented in Table 3, we can conclude that earnings of older workers and blue-collar workers are less rigid,
10 These results are robust to considering the average earnings and the average bonus instead of the medians. For space considerations, the results are not reported but are available on request.
whatever the sector of economic activity. However, differences across sectors in the average age do not explain differences in DRWR across sectors.
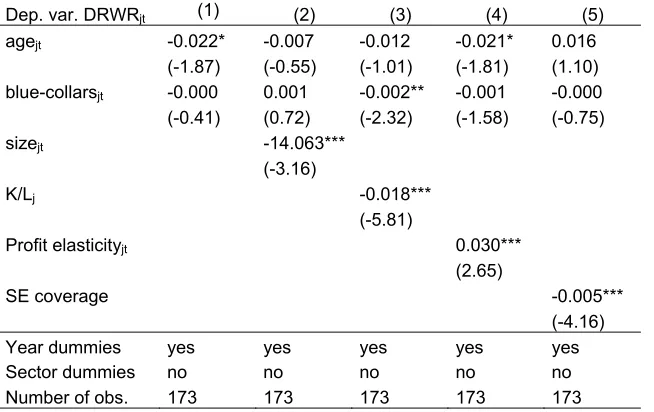
Least squares estimates of equation (2) are shown in Tables 4 and 5. Robustness with respect to Papke and Wooldridge's (1996) estimation that takes into account the bounded nature of DRWR (between zero and one) are reported in Appendix B. The size of the coefficients and the significance is similar.
Table 4 - Sector-specific factors affecting DRWR, OLS estimates
Dep. var. DRWRjt (1) (2) (3) (4) (5)
agejt -0.021* -0.006 -0.012 -0.020* 0.016
(-1.91) (-0.52) (-1.11) (-1.84) (1.14) blue-collarsjt -0.000 0.001 -0.002** -0.001* -0.000
(-0.42) (0.79) (-2.32) (-1.71) (-0.74) sizejt -13.90***
(-2.91)
K/Lj -0.017***
(-4.91)
Profit elasticityjt 0.029**
(2.42) SE coveragej -0.005***
(-4.17) Constant 1.264*** 0.762* 1.252*** 1.080*** 0.055
(3.11) (1.76) (3.29) (2.65) (0.11) Year dummies yes yes yes yes yes Sector dummies no no no no no R²adj 0.085 0.126 0.201 0.112 0.171
Number of obs. 173 173 173 173 173 Notes:
agejt is the average age of workers;
blue-collarsjt is the percentage of blue-collar workers;
sizejt is the average size of firms, measured in thousands of employees;
K/Lj is the capital-labour ratio, measured in thousands of euro;
Profit elasticityjt is our preferred measure of competition
SE coveragej is the percentage of blue-collar workers covered by single-employer collective agreements
*/**/*** indicate significance at the 0.10, 0.05 and 0.01 level, respectively. t-statistics in brackets.
Next, we examine whether the median firm size within the sector affects wage rigidity. There are several reasons why firm size might affect DRWR. Union representation is compulsory in firms with more than 50 employees in Belgium, which may ease the negotiation of wage concessions in adverse times. Also, larger firms typically have more complex compensation structures, offer higher
but also more dispersed wages12, and possibly a larger amount of extra wage components. Also
they are more likely to sign SE agreements, which allow for a more flexible wage policy than the sectoral agreements. Earnings decreases in smaller firms are more likely to be bounded by minima collectively agreed outside the firm. On the contrary, in larger firms, the wage cushion (above the
sector-level agreement) provides some margin for earnings cuts. Model (2) in Table 4 confirms these arguments. DRWR is significantly lower in sectors with larger firms, all else equal.
We also study whether production technology and market competition are related to DRWR. First, we introduce the median capital-labour ratio for each sector in Model (3). Our estimates indicate that labour-intensive sectors have higher DRWR. Note that labour-intensive sectors such as construction, textiles and transport equipment, for example, also have a larger proportion of blue-collar workers (see Table 1), whose wages are less rigid. Table 4 shows that capital intensity is negatively related to DRWR after controlling for labour force composition. Our results contrast with the findings of Campbell (1991), who reports a negative correlation between sector-level wage flexibility and the capital-labour ratio in the US. But they are consistent with the finding in Fuss (2008) that wage cuts in adverse times are largely non-existent in the construction sector (the most labour-intensive) contrary to the manufacturing and services sectors. Also, our finding that wage rigidity is stronger in labour-intensive sectors complements the view expressed by the Eurosystem Inflation Persistence Network (IPN) that the higher degree of price stickiness observed in more labour-intensive sectors might result from wage rigidity, see Altissimo et al. (2006), Álvarez et al.
(2006), Dhyne et al. (2006) and Vermeulen et al. (2006).13
In Model (4), we report results for competition measured through the profit elasticity proposed by Boone et al. (2007) and estimated at the sector level. Controlling for age and occupation, our estimates indicate that sectors with stronger competition experience higher DRWR. One potential explanation is related to wage-bargaining practices. SE wage agreements are more common in sectors where firms are large and have higher market power and where company unions try to appropriate the rents. SE wage agreements are far less common in sectors with small competitive firms. In this case, the main objective of unions is rather egalitarian as they are trying to avoid a wage race to the bottom; they are mainly organised at sectoral level in order to negotiate equal pay within the sector. Note that our finding of a positive relationship between product market competition and DRWR should be treated with some caution. Appendix B provides results based on two additional measures of competition: the Herfindahl index and the price-cost margin. Even though the estimates based on these alternative measures predict the same direction of the impact of competition on DRWR, the coefficients are not statistically significant (see Table B2).
Finally, we examine whether differences in decentralisation of wage bargaining across sectors influence DRWR. In the literature, wage-bargaining institutions have been cited as a cause of differences in downward wage rigidity across countries. Dickens et al. (2006) and Holden and Wulfsberg (2008) relate higher wage rigidity to higher union density and/or bargaining coverage. In the context of our paper, we examine whether sectoral differences in the wage-bargaining mechanism are related to sectoral differences in wage rigidity. As mentioned above, inter-sectoral coordination practices and indexation mechanisms are largely determined at the national level.
These are common to all sectors and may explain the high level of DRWR in Belgium compared to other countries. Beyond this, sector-level collective wage bargaining plays a dominant role in wage-setting practices. On top of these, other bargaining characteristics, such as the proportion of firms with SE agreements, vary across sectors. As mentioned above, firm-level or single-employer (SE) agreements lead to higher wages on average, as well as wider wage dispersion across firms because such agreements can better take into account firm-specific characteristics in the
determination of wages.14 In addition, according to Cardoso and Portugal (2005), a higher average
wage and wider wage dispersion within firms provide employers with a flexible wage cushion above the sectoral minima, leaving these firms with a wider range of options in their wage-setting policy, i.e. allowing a greater role for workers' and firms’ characteristics in remuneration. This, in turn, is expected to reduce downward real wage rigidity. This prediction is confirmed in Model (5) in Table 4. Downward real wage rigidity is lower in sectors with a higher proportion of workers covered by an additional firm-level wage agreement.
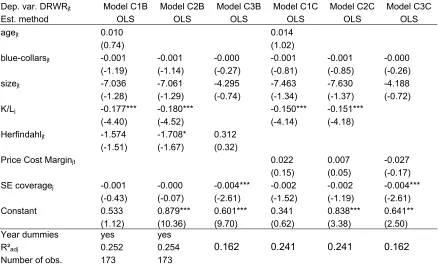
In Table 5, we combine the explanatory variables discussed so far into a single model. It has already been suggested that the variables might be collinear which would, in turn, give rise to imprecise estimates of the coefficients in the combined model. For example, larger firms typically offer higher and more dispersed wages. And companies with firm-level agreements are generally larger, and pay higher wages. As before, we omit from the model the earnings level and
bonuses.15 One may argue that these variables are the outcome of the firm’s compensation policy,
as is DRWR, and are therefore potentially endogenous. We prefer to use variables that are independent of the firm's pay policy, such as competition indicators, capital intensity or SE agreement coverage.
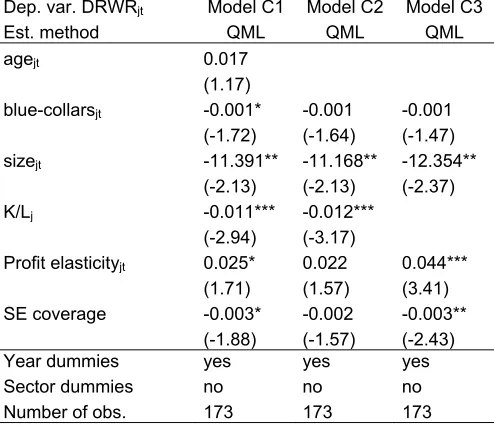
In Model C1 in Table 5, there are two variables that are insignificant at the 10 percent level. One of them is age. Since we concluded that age does not explain the variation in DRWR across sectors, we exclude it from the remaining models. The other insignificant variable is profit elasticity, but it is only marginally insignificant (with p-value of 0.12). Model C3 suggests that this may be due to its correlation with the capital-labour ratio. Indeed, as shown in Table 1, the profit elasticity is higher, i.e. competition is stronger, in less capital-intensive sectors. The significant variables in Model C1 have the predicted sign and the values of the coefficients are of the same order of magnitude as in Table 4.
Model C1 may also be affected by endogeneity of profit elasticity. In Appendix A in the section that discusses the estimation of profit elasticity, we show that profit elasticity might depend on marginal costs (our example is based on a simple Cournot model). Since DRWR may influence wage dynamics, it also affects costs and thereby the profit elasticity and causes simultaneity in our regression model. We account for the potential simultaneity bias by estimating Model C2 with
14 See Card and de la Rica (2006), Cardoso and Portugal (2005), Dell'Aringa and Lucifora (1994), Gerlach and Stephan (2006), Hibbs and Lock (1996), Palenzuela and Jimeno (1996) and Rycx (2003) for Belgium. 15 The wage level and bonuses are highly collinear with the other variables included in the equation.
instrumental variables for profit elasticity. We use the following instruments for profit elasticity: the Herfindahl index, number of firms per branch (and year) and the relative net increase in the number
of firms in each branch and year. The model is estimated by two-stage least squares.16 In Model
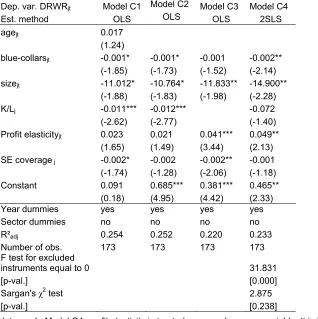
[image:23.595.80.398.196.515.2]C4, the coefficient on profit elasticity increases and becomes significant when compared to Models C1 and C2. On the other hand, the capital-labour ratio loses its significance. The estimates of the remaining coefficients are broadly in line with the previous estimates.
Table 5 - Explaining differences in DRWR across sectors, composite models
Dep. var. DRWRjt Model C1 Model C2 Model C3 Model C4
Est. method OLS OLS OLS 2SLS
agejt 0.017
(1.24)
blue-collarsjt -0.001* -0.001* -0.001 -0.002**
(-1.85) (-1.73) (-1.52) (-2.14) sizejt -11.012* -10.764* -11.833** -14.900**
(-1.88) (-1.83) (-1.98) (-2.28)
K/Lj -0.011*** -0.012*** -0.072
(-2.62) (-2.77) (-1.40)
Profit elasticityjt 0.023 0.021 0.041*** 0.049**
(1.65) (1.49) (3.44) (2.13)
SE coverage j -0.002* -0.002 -0.002** -0.001
(-1.74) (-1.28) (-2.06) (-1.18) Constant 0.091 0.685*** 0.381*** 0.465**
(0.18) (4.95) (4.42) (2.33) Year dummies yes yes yes yes
Sector dummies no no no no
R²adj 0.254 0.252 0.220 0.233
Number of obs. 173 173 173 173 F test for excluded
instruments equal to 0 31.831
[p-val.] [0.000]
Sargan's χ2 test 2.875
[p-val.] [0.238]
Notes: In Model C4, profit elasticity is treated as an endogenous variable. It is instrumented with the following excluded exogenous variables: Herfindahl index, number of firms per branch (and year) and the relative net increase in the number of firms in each branch and year.
agejt is the average age of workers;
blue-collarsjt is the percentage of blue-collar workers;
sizejt is the average size of firms, measured in thousands of employees;
K/Lj is the capital-labour ratio, measured in thousands of euro;
SE coveragej is the percentage of blue-collar workers covered by single-employer collective agreements
*/**/*** indicate significance at the 0.10, 0.05 and 0.01 level, respectively. t-statistics in brackets.
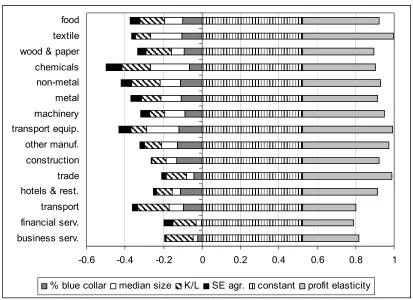
In order to highlight the importance of each variable for the variation of DRWR across sectors, Figure 2 reports the contribution of each variable to sector-specific DRWR (averaged over all years) based on Model C4.
-0.6 -0.4 -0.2 0 0.2 0.4 0.6 0.8 1 business serv.
financial serv. transport hotels & rest. trade construction other manuf. transport equip. machinery metal non-metal chemicals wood & paper textile food
[image:24.595.79.492.55.355.2]% blue collar median size K/L SE agr. constant profit elasticity
Figure 2 - Decomposition of DRWR based on Model C4 in Table 5 (average across years)
Figure 2 shows that the constant picks up a large part of the DRWR in all sectors. This is consistent with the view that national institutions drive most of the observed wage rigidity. In particular, full automatic indexation and collectively agreed real wage increases are natural
potential factors of real wage rigidity.17 The value of the constant is in line with the observations
made in Section 3.1. The standard deviation of DRWR across sectors is 0.19, around the mean of 0.58 (see Table 2).
Leaving the constant aside, Figure 2 highlights the role of the different variables in explaining variation in DRWR across sectors. Let us first compare construction and chemicals, sectors that show the highest and one of the lowest values of DRWR in Table 2 (0.80 and 0.47, respectively). This gap may be attributed essentially to a big difference in capital intensity, firm size and SE agreement coverage. As shown in Table 1, the chemical industry has one of the highest capital-labour ratios, the highest median firm size and the highest SE agreement coverage, while the opposite holds true for construction. As suggested by our estimates in Table 5, the higher the values of these variables, the lower the DRWR. These factors explain why DRWR is much higher in construction than in chemicals, despite the fact that construction has a disproportionately high percentage of blue-collar workers, while chemicals has an average proportion of blue-collar workers in its workforce.
In the services sector, financial and business services have similar degrees of DRWR (0.63 and 0.67, respectively) and both sectors employ a very high proportion of white-collar workers. In spite of these similarities, they differ in that business services are characterised by higher capital intensity and financial services by higher SE agreement coverage.
Figure 1 shows that most DRWR is common to all sectors, and that variations across sectors are largely due to factors such as workforce composition, production technology (capital intensity) and the degree of competition on the product market. Our results also indicate that labour-intensive sectors have more rigid wages, which backs up the argument that price stickiness observed in labour-intensive sectors is due to wage rigidity. Importantly, our results point up the role of firm-level wage bargaining in dampening wage rigidity, although Figure2 reveals that this accounts for only a small fraction of DRWR.
4. Conclusion
Wage rigidity has important consequences at both the microeconomic and macroeconomic level. When wages are rigid, they no longer evolve hand in hand with productivity developments and interfere with efficient allocation of resources. Downward wage rigidity is considered as one of the causes of unemployment and price stickiness in Europe. It also bears implications for the design and effectiveness of monetary policy. These findings have led to wide empirical literature on the evaluation of wage rigidity, based on macroeconomic, sector-level or, more recently, microeconomic data. The driving factors behind wage rigidity have seldom been investigated, but a better understanding of them can be gained simply by comparing the situation in different countries or sectors, for example.
This paper examines whether differences in wage rigidity across sectors can be explained by differences in workforce composition, competition, technology and wage-bargaining institutions. Given the institutional features of the Belgian labour market, and particularly its system of full automatic indexation, and considering previous findings by Du Caju et al. (2007), nominal wage rigidity seems to be of little relevance. We have therefore focused on downward rigidity of real wages, adopting the measure of downward real wage rigidity developed by Dickens and Goette (2006). The estimates are based on a large administrative matched employer-employee dataset for Belgium over the period 1990-2002. We have also used sector-level information derived from firms' annual accounts over the same period and the 1999, 2000, 2001 and 2002 waves of the Belgian Structure of Earnings Survey (SES).
workers and younger workers. Further worker categories with higher earnings and bonuses are characterised by lower DRWR, conditional on their occupation and age category.
References
Agell, J. and H. Benmarker (2007), "Wage incentives and wage rigidity: a representative view from within", Labour Economics, 14(3), 347-369.
Altissimo F., L. Bilke, A. Levin, T. Mathä and B. Mojon (2006), "Sectoral and aggregate inflation
dynamics in the euro area", Journal of the European Economic Association, 4(2-3), 585-593.
Altonji J.G. and P.J. Devereux (1999), Extent and Consequences of Downward Nominal Wage
Rigidity, in S.W. Polachek, Worker Well Being, Research in Labor Economics, 19, Elsevier.
Álvarez L., E. Dhyne, M. Hoeberichts, C. Kwapil, H. Le Bihan, P. Lünnemann, F. Martins, R. Sabbatini, H. Stahl, P. Vermeulen and J. Vilmunen (2006), "Sticky prices in the euro area: a
summary of new micro-evidence", Journal of the European Economic Association, 4(2-3),
575-584.
Biscourp, P. O. Dessy, and N. Fourcade (2005), “Les salaires sont-ils rigides? Le cas de la France à la fin des années 90”, Economie et Statistique, 386, 59-79.
Blanchard, O. and J. Galí (2007), "Real wage rigidities and the New Keynesian model", Journal of Money, Credit and Banking, 39(s1), 35-66.
Boone, J. (2000), "Competitive pressure: the effects on investments in product and process innovation ", Rand Journal of Economics, 31(3), 549-569.
Boone, J., J.C. van Ours and H. van der Wiel (2007), "How (not) to measure competition", CEPR Discussion Papers n° 6275.
Campbell, C. (1989), "Sectoral wage rigidity in the Canadian and French economies", European Economic Review, 33(9), 1727-1749.
Campbell, C. (1991), "Tests of efficiency wage theory and contract theory with disaggregated data from the US", Weltwirtschaftliches Archiv, 127(1), 98-118.
Campbell, C. (1997), "The variation in wage rigidity by occupation and union status in the US", Oxford Bulletin of Economics and Statistics, 59 (1), 133-147.
Card D. and D. and Hyslop (1997), "Does inflation grease the wheels of the labor market?", in
Reducing Inflation: Motivation and Strategy, C. D. Romer and D. H. Romer (eds), NBER Studies in Business Cycles, v30.
Card, D. and S. de la Rica (2006), "Firm-level contracting and the structure of wages", Industrial and Labour Relations Review, 59(4), 573-592.
Cardoso, A and P. Portugal (2005), "Contractual wages and the wage cushion under different bargaining settings", Journal of Labor Economics, 23(4), 875-902.
Clar, M., C. Dreger and R. Ramos (2007), "Wage flexibility and labour market institutions: a meta-analysis", Kyklos, 60(2), 145-163.
Cornille, D. and M. Dossche, (2008), "Some evidence on the adjustment of producer prices",
Scandinavian Journal of Economics, 110(3),489-518.
Dhyne E., L. J. Ãlvarez, H. Le Bihan, G. Veronese, D. Dias, J. Hoffmann, N. Jonker, P. Lünnemann, F. Rumler, J. Vilmunen (2006), "Price Changes in the Euro Area and the United
States: Some facts from Individual Consumer Price Data", Journal of Economic
Perspectives, 20(2), 171-192.
Dickens W.T., L. Goette, E.L. Groshen, S. Holden, J. Messina, M.E. Schweitzer, J. Turunen, and M.E. Ward (2007), "How wages change: micro evidence from the International Wage Flexibility Project", Journal of Economic Perspectives, 21(2), 195-214.
Dickens W.T., L. Goette, E.L. Groshen, S. Holden, J. Messina, M.E. Schweitzer, J. Turunen, and M.E. Ward (2006), "The Interaction of Labor Markets and Inflation: Analysis of Micro Data from the International Wage Flexibility Project", mimeo, Brookings Institution.
Dickens, W.T., L. Goette (2006), "Estimating Wage Rigidity for the International Wage Flexibility Project". mimeo, Brookings Institution, October.
Du Caju, Ph., C. Fuss and L. Wintr (2007), "Downward wage rigidity for different workers and firms: an evaluation for Belgium using the IWFP procedure", ECB Working Paper n° 840.
Fehr E and Goette L. (2005), “The robustness and real consequences of nominal wage rigidity”, Journal of Monetary Economics, 52(4), 779-804.
Franz, W. and F. Pfeiffer (2006), "Reasons for wage rigidity in Germany", Labour, 20(2), 255-284. Fuss, C. (2008), "How do firms adjust their wage bill in Belgium? A decomposition along the
intensive and extensive margins", ECB Working Paper n° 854.
Gerlach, K. and G. Stephan (2005), "Wage distribution by wage-setting regime", IAB Discussion Paper n° 9/2005.
Kahn S. (1997), "Evidence of Nominal Wage Stickiness From Micro Data", American Economic
Review, 87(5), 993-1008.
Haefke, C. Sonntag, M. and van Rens, T. (2008), "Wage rigidity and job creation", IZA Discussion Paper n° 3714
Hibbs, H.A. and H. Locking (1996), "Wage compression, wage drift and wage inflation in Sweden", Labour Economics, 3(2), 109-141.
Holden, S. and F. Wulfsberg (2008), "Downward Nominal Wage Rigidity in the OECD,"The B.E.
Journal of Macroeconomics: 8 (1 Advances), Article 15, available at:
http://www.bepress.com/bejm/vol8/iss1/art15
Layard R., S. Nickell and R. Jackman (1991), Unemployment, macroeconomic performance and
the labour market, Oxford University Press.
Li, G. (1985), "Robust Regression", In Exploring Data, Tables, Trends, and Shapes, ed. D. C. Hoaglin, F. Mosteller, and J. W. Tukey, 281-340. New York: Wiley.
Messina, J., C.F. Duarte, Ph. Du Caju, M. Izquierdo and N Lynggard Hansen (2008), "The Causes and Consequences of Nominal and Real Wage Rigidity: A Sectoral Approach, mimeo, presented at Wage Dynamics Network Confernce,the WDN conference in Frankfurt, on 24-25 June 2008.
Papke, L. E. and J. M. Wooldridge (1996), "Econometric Methods for Fractional Response Variables with an Application to 401(k) Plan Participation Rates", Journal of Applied Econometrics, 11(6), 619-632.
Ramsey, J.B. (1969), "Tests for Specification Errors in Classical Linear Least Squares Regression Analysis", Journal of the Royal Statistical Society. Series B, 31(2), 350-371.
Rycx, F. (2003), "Industry wage differentials and the bargaining regime in a corporatist country", International Journal of Manpower, 24(4), 347-366.
Shapiro, C. and J. E. Stiglitz (1984), “Equilibrium Unemployment as a Worker Discipline Device”, American Economic Review, 74(3), 433–44.
Stiglitz, J. E. (1974), “Alternative Theories of Wage Determination and Unemployment in L.D.C.’s: The Labor Turnover Model”, Quarterly Journal of Economics, 88(2), 194–227.
Vermeulen P., and R. Christopoulou (2007), "Markups in the Euro Area and the US over the period 1981-2004: a comparison of 50 sectors", ECB Working Paper n° 856.
Vermeulen P., M. Dias, M. Dossche, E. Gautier, I. Hernando, R. Sabbatini and H. Stahl (2007), "Price setting in the euro area: some stylised facts from individual producer price data and producer surveys", ECB Working Paper n° 727.
Appendix A: Data
This appendix discusses the definitions of variables employed in the paper. The subscripts used refer to the particular group of observations over which the variable varies. The shortcuts for branch, occupation, age category and year are j, k, a and t, respectively. Unless explicitly stated, the variables come from the same administrative database on individual labour earnings for Belgium collected by the social security system used in Du Caju et al. (2007). Our trimming procedure for annual gross earnings is explained in Section 2 of the paper. In addition, we use information from firms' balance sheets. Finally, we also rely on individual data from the Belgian Structure of Earnings Survey (SES), for the 1999, 2000, 2001 and 2002 waves.
Wage rigidity measure
The administrative employer-employee dataset provides individual information on annual gross earnings (including bonuses) and annual working days. We evaluate DRWR from the distribution of the changes in the log of annual earnings divided by the number of work days of full-time job stayers.
Variables related to compensation
Variables related to firms' pay policy are the level of earnings and the level of bonuses. Earnings refers to daily gross earnings of an employee and are defined as annual gross earnings in euro divided by the annual number of work days. Bonuses are obtained from the SES and refer to annual bonuses of an employee expressed in euro. We do not make use of the variation of bonuses over years in order to retain as many observations as possible (our main dataset covers the period 1991-2002, and the SES 1999-2002 only).
Firm size
We measure firm size by the number of employees. The definition of the number of employees in the balance sheet has changed over the period under examination. Since 1996 (and in some cases 1997), firms have reported the total number of employees at the end of the year. Before 1996, only information on the average number of employees per year is available. Variables denoted as "Employees < 25jt" and "Employees > 499jt" refer to the percentage of firms in each branch and
year that employ less than 25 and more than 499 employees, respectively.
Capital-labour ratio
Firm-level capital-labour ratios are computed for all firms, both public companies and non-profit associations, which publish annual accounts for a full year from January to December. The capital stock is computed on the basis of the perpetual inventory method:
PIstKit = (1-δi)PIst-1Kit-1(PIst/PIst-1) + PIstIit
with Kit representing the real capital stock, PIst the sector-specific gross capital formation deflator