Int. J. Electrochem. Sci., 12 (2017) 11833 – 11854, doi: 10.20964/2017.12.78
International Journal of
ELECTROCHEMICAL
SCIENCE
www.electrochemsci.orgEffect of gravity and gas flow direction on the operation of
Polymer Electrolyte Membrane Fuel Cells
Vinh Nguyen Duy, Hyung-Man Kim*
Department of Mechanical Engineering & High Safety Vehicle Core Technology Research Center, INJE University, 607 Eobang-dong, Gimhae-si, Gyongsangnam-do 621-749, Republic of Korea
E-mail: [email protected]
Received: 26 July 2017 / Accepted: 20 September 2017 / Published: 12 November 2017
The flow-field designs of bipolar plates (BPs) contribute to improving the fuel cell performance. However, the acceleration due to gravity and the direction of supplied gas flows also directly affects fuel cell operation, because they result in transportation phenomena, the uniform distribution of reacting gases, and water management. This research focused on analyzing the effects of gravity and gas flow direction on fuel cell operation. In addition, the constant stoichiometry and constant mass flow rate boundary condition applied for fuel cell operation, were also analyzed to determine the best conditions for fuel cell performance enhancement. The results showed that proton exchange membrane fuel cells (PEMFCs) performance can be dramatically improved by optimizing the gravitational angle and the supplied gas flow direction. Consequently, when the air and hydrogen gas inlets are both placed at the upper side, the fuel cell performance can be enhanced up to 5% in comparison with those placed at the lower side. Furthermore, when the gas direction between adjacent channels is alternatively changed in the interleaved flow configuration, the fuel cell performance is dramatically enhanced compared to other flow types. The counter-flow type configuration exhibited the worst ability to improve fuel cell performance because it plays a vague role in distributing gases and liquid water over the fuel cell. The maximum difference in power density among various flow types at the same current density ranges up to approximately 17%.
Keywords: Proton exchange membrane fuel cell; Gravitational force; Convection and Diffusion, gas flow direction; Polarization performance
1. INTRODUCTION
low exhaust emission. These advantages are attributable to the fact that the only byproduct of PEMFCs is water [1-5].
Generally, PEMFCs convert the chemical energy of hydrogen into electrical energy [6-9]. Consequently, the only by-products are pure water and heat when the fuel is hydrogen. The membrane electrode assembly (MEA) is the most important fuel cell component and includes a proton conductive membrane, which plays the role of an electrolyte, two catalyst layers (CLs), and two gas diffusion layers (GDLs). Typical catalyst layers consist of nanometer-sized particles of platinum scattered on a high-surface-area carbon support. These particles are responsible for improving the reactions that enable hydrogen molecules to be split into protons and electrons on the cathode side. Moreover, the particles allow oxygen reduction by reacting with the protons generated by the anode, which produces water on the cathode side. The GDLs in PEMFCs provide a pathway for reactant gases to travel from the channels to the CLs, granting them access to the entire active area. Bipolar plates (BPs) are also an important component of PEMFCs with multifunctional character. BPs directly affect the uniform distribution of fuel gases and water, conduct electrical current from cell to cell, discharge heat and water, and prevent leakage of gases and coolant [10]. In addition, BPs also provide structural support for the thin and mechanically weak MEA. Therefore, there are many studies have been performed worldwide to find suitable materials to optimize the design of BPs to enhance fuel cell performance [1, 11-20].
Low power density is the most significant issue facing fuel cell technology today, and it must be solved in order to apply the technology to a wider range of applications. For a given MEA, the fuel cell power density can be dramatically increased by enhancing the mass transfer phenomenon, which is directly affected by the flow-field design of the BPs. As described in many studies [21-26], researchers have conducted to find the optimal flow-field patterns in order to improve the fuel cell operation characteristics. However, the flow field design is very complicated because of the complex nature of mass transport phenomena, which significantly affect to fuel cell operation.
In addition, the acceleration due to gravity and the direction of supplied gas flows also directly affects fuel cell operation because they result in transportation phenomena, a uniform distribution of reacting gases, and water management. Tu Zheng-kai et al. conducted an experimental investigation on the effect of gravity on fuel cell performance [27]. The results indicated that the performance of the output fuel cell can be significantly improved at an optimized gravitational angle. Furthermore, when the gas inlet flows from the upper side to the lower side, the performance can be enhanced, and the output power can reach a maximum corresponding to the gravitational angle of 90°. In addition, Arnaud Morin et al. [28] presented evidence of the influence of gravity on PEMFC performance. They showed that there was significant liquid water accumulation in the vertical sections of the gas channel. This resulted in an increase in membrane water content, particularly at the cathode inlet. In addition, the effect of gravity is much less apparent at the anode side due to the higher water content at the cathode side.
humidified, allowing for high performance to be maintained in a counter-flow mode without external humidification. Conversely, it is not obviously for humidified or saturated inlet gases. PEMFC performance depends on the design and the direction of the flow of reactant gases [30]. The PEMFC performances of 4-Serpentine and parallel flow channels are superior those of counter- and cross-flow channels at low voltage. In addition, in cells with 1-Serpentine and parallel flow, the performance is higher than those of counter- and cross-flow channels at high voltage.
As described in a variety of studies, the effect of flow field pattern on the strength of convection is an important factor that can affect the enhancement of PEMFC performance. This affects bot the reactant transport efficiency and the water discharge. In our previous research, we simulated the effects of various BPs (single serpentine, single parallel, interdigitated) and a pin flow field on fuel cell operation to obtain a more desirable flow field pattern. These results showed that when the active area and operating conditions are identical, the serpentine flow field pattern demonstrates the best characteristics, or similar characteristics, to the interdigitated flow field pattern. In addition, the pin and the single parallel flow field patterns demonstrate the worst mass transfer characteristics. This is due to membrane flooding and drying, which is the result of uneven flow circulation [19].
To improve the performance of fuel cell that relied on the designs of BPs described in our previous research [1, 12-19], this research performed the numerical and experimental effects of gravity, gas flow directions, and boundary conditions of inlet gases based on the 4-Serpentine flow channel configuration of the BP. The effects of gravity and gas flow direction were applied by changing the inlet and outlet flow combining the BP positions. Meanwhile, the mass flow gas controls were performed to determine their effect on fuel cell operation.
2. DESIGN AND FABRICATION OF BIPOLAR PLATES AND EXPERIMENTAL SETUP
2.1. Design, fabrication of bipolar plates
The configuration of the BP used in this research is a serpentine channel flow field that includes five-passes and four turns on a 25 cm2 surface area with a rib fabricated with graphite material. The 3D drawing was built using Catia software. All of the BPs used in the experiment were fabricated using highly accurate computer numerical control (CNC) machines to ensure high precision. The parameters of the designed flow field are shown in Fig. 1, and their corresponding dimensions are listed in Table 1.
[image:4.596.55.546.72.316.2]
Figure 1. Schematics and CAD designs and dimensions of designed graphite bipolar including 5 passes and 4 turns on a 25 cm2 active area.
Table 1. Geometric details of the cell components used in this research [1,3].
Fuel cell components Dimension Unit
Bipolar plates (Length x Width x Thickness) 64 x 64 x 20 mm x mm x mm
Surrounded surface area 25 cm2
Number of channels 5 -
Main channel width (mm) 1.0 mm
Main channel rib width (mm) 1.0 mm
Main channel turn rib width (mm) 1.25 mm
Main channel height (mm) 0.5 mm
Cross-sectional area (cm2) 0.025 cm2
GDL (Length x Width x Thickness) 50 x 50 x 0.25 mm x mm x mm
Catalyst Layer (Length x Width x Thickness) 50 x 50 x 0.125 mm x mm x mm
Membrane (Length x Width x Thickness) 50 x 50 x 0.035 mm x mm x mm
After manufacturing, the BPs were assembled with the membrane electrode assembly and GDLs for the experiment. All of the fuel cell assemblies were maintained the same compression to ensure the same contact resistance. As a result, a torque wrench was used to precisely apply the same torque on the bolts when assembling the fuel cells.
2.2. Experimental setup
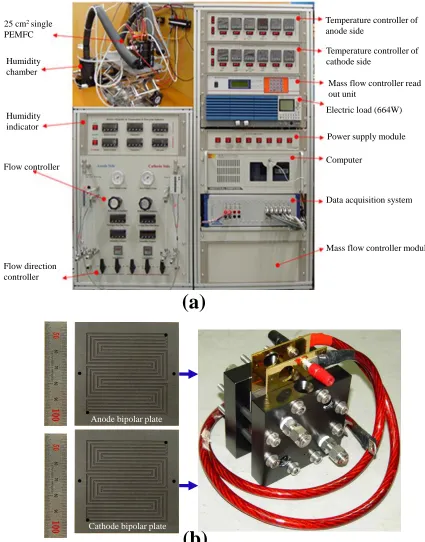
[image:4.596.57.559.391.609.2]
shown in Fig. 2.
25 cm2 single
PEMFC
Flow controller
Flow direction controller
Humidity chamber
Humidity indicator
Temperature controller of anode side
Power supply module Electric load (664W)
Computer
Data acquisition system Mass flow controller read out unit
Temperature controller of cathode side
Mass flow controller module
Anode bipolar plate
Cathode bipolar plate
(a)
(b)
[image:5.596.79.504.112.654.2]Figure 2. Experimental test setup: (a) fuel cell test station, (b) Fuel cell assembly in the experiment.
quantitatively, an activation test must be conducted to reduce MEA damage and maintain an electrical load stability. Prior to the performance test, a humidification process was conducted for approximately 30 minutes, which was sufficient to hydrate the dried MEA. To define the activation cycle using the reference cell, 180 activation test cycles were processed. The performance of the fuel cell gradually improves from the first cycle to the last cycle, and it is observed that the performance change stabilizes after 50 cycles. Based on the FCTESTNET procedure test developed by EU FP5 project [31-32], we constructed a maximum performance test procedure using a potentiostatic technique (CV mode).
[image:6.596.62.531.283.637.2]3. SIMULATION PROCEDURE
Table 2. Details of the parameters and properties used in this simulation [1,3].
Parameters Value Unit
Current collector
Material Graphite -
Thermal conductivity 5.7 W/m.K
Electric conductivity 20000 Ω/m
GDL
Thickness after compressed 250 μm
Permeability of GDL 1.0e-12 m2
Porosity after compressed (% 70 %
Diffusion adjustment (% 50 %
Thermal conductivity of GDL 0.21 W/m.K
Membrane electrode assembly
Thickness including catalyst layer 50 μm
Thermal conductivity of membrane 0.15 W/m.K
Reference diffusivity of H2 8e-5 m2/s
Reference diffusivity of O2 2e-5 m2/s
Reference diffusivity of H2O 5e-5 m2/s
Dry membrane density 2.0 g/cm3
Equivalent weight of dry membrane 1100 g/mol
3.1. Geometric models
physical parameters of the fuel cell used in this simulation are obtained from our previous research, and are listed in Tables 1–2 [1, 12-19].
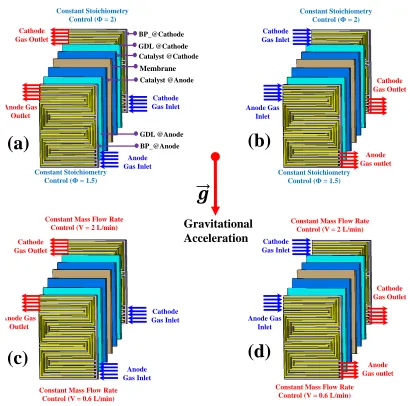
(a)
BP_@AnodeGDL @Anode
Constant Stoichiometry Control (Φ = 2)
Membrane Catalyst @Anode Catalyst @Cathode GDL @Cathode BP_@Cathode Anode Gas Inlet Anode Gas Outlet Constant Stoichiometry Control (Φ = 1.5)
Cathode Gas Inlet
Cathode Gas Outlet
Constant Mass Flow Rate Control (V = 2 L/min)
Anode Gas Inlet Anode Gas Outlet Cathode Gas Inlet Cathode Gas Outlet
(b)
(c)
(d)
Constant Mass Flow Rate Control (V = 0.6 L/min)
Constant Stoichiometry Control (Φ = 2)
Anode Gas outlet
Anode Gas Inlet
Constant Stoichiometry Control (Φ = 1.5) Cathode
Gas Inlet
Cathode Gas Outlet
Constant Mass Flow Rate Control (V = 2 L/min)
Anode Gas outlet
Anode Gas Inlet
Constant Mass Flow Rate Control (V = 0.6 L/min)
[image:7.596.92.502.142.548.2]Cathode Gas Outlet Cathode Gas Inlet Gravitational Acceleration
Figure 3. Schematics of a computational domains for PEMFC system experiments: (a) case 1 in which the control of constant gas stoichiometry ratio is applied and supplied gas direction is from the lower side to upper side; (b) case 2 in which the control of constant gas stoichiometry ratio is applied and supplied gas direction is from the upper side to the lower side; (c) case 3 in which mass flow rates of inlet gases are applied and supplied gas direction is from the lower side to the upper side; and (d) case 4 in which mass flow rates of inlet gases are controlled and supplied gas direction is from the upper side to the lower side.
3.2. Physical models
condensation within the PEMFC. Consequently, the electrochemistry, current, mass conservation, heat source, liquid water formation, and transport model are modeled and solved in this research.
3.3. Description of studied configurations
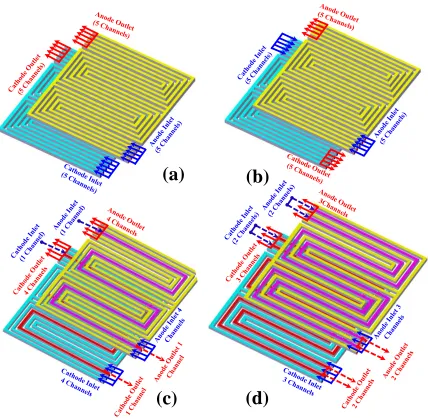
(a)
(d)
(c)
[image:8.596.81.509.164.582.2](b)
Figure 4. Schematics of a computational domains for PEMFC system simulation: (a) case 5 in which the direction of the inlet and outlet gas are the same direction in all of five channels; case 6 in which the outlet gas flows in the opposite direction to the inlet gas; (c) case 7 in which the direction of inlet gas in the center channel is opposite with 4 other remaining channels at both the anode and cathode side; (c) case 8 in which the inlet gas directions in channel 2 and channel 4 are opposite with 3 other remaining channels.
air were changed as described in Fig. 3. In addition, the supplied gases boundary condition was applied either by constant mass flow rate control or constant stoichiometry ratio control that corresponds to the direction of each of the supplied gases. When controlling the constant mass flow rate, the flow rates of air and hydrogen were adjusted at 0.6 L/min and 2 L/min, respectively. On the other hand, mass flow rates are adjusted according to the current densities to ensure a constant stoichiometry ratio of 1.5 at the anode side, and a constant stoichiometry ratio of 2 at the cathode side, in the case where constant mass flow rates are controlled.
To evaluate the effect of gas flow direction on fuel cell performance, four simulation cases corresponding to various supplied gas directions were numerically conducted. In addition, the experiment was also performed to evaluate the simulation model. Fig. 4 describes in detail four experimental cases that correspond to the combination of the supplied gas flow direction. Accordingly, the directions of fuel and air were supplied with co-flow, counter-flow, and interleaved flow mode behavior for quantitative comparison.
[image:9.596.63.528.371.764.2]3.4. Boundary Equations
Table 3. The boundary and operation conditions performed in this research [1,3].
Inlet conditions Value Unit
Anode side
Mass flow Hydrogen control
Constant mass flow rate inlet 0.6 L/min
Constant stoichiometry inlet 1.5 -
Controlled temperature 75 oC
Anode Inlet Humidity 100 %
Anode reference current density 10000 A/cm2
Cathode side
Mass flow Air control
Constant mass flow rate inlet 2 L/min Constant stoichiometry inlet 2 -
Controlled temperature 75 oC
Cathode Inlet Humidity RH 100 %
Cathode reference current density 50 A/cm2
Operating conditions
Exit pressure 101 kPa
Gravitational acceleration 9.8 m/s
In this research, the operating pressure and temperature were maintained at 101 kPa and 343 K, respectively. For the anode and cathode inlet, the mass flow rate, temperature, mass fraction of gases, and direction specification method were also controlled with the same conditions for the comparison. In addition, the temperature and pressure were controlled in the anode and cathode outlet. On the other hand, the temperature and electric potential were controlled in the anode and cathode bipolar plate. Table 3 shows the boundary conditions used for both the experiment and simulation in this research.
4. RESULTS AND DISCUSSION
4.1. Effect of gravity caused by gas flow direction on fuel cell performance
0.1 0.2 0.3 0.4 0.5 0.6 0.7 0.8 0.9 1
0.3 0.4 0.5 0.6 0.7 0.8 0.9 1
0.1 0.4 0.7 1 1.3 1.6 1.9 2.2
Power
density
(W
/c
m
2
)
Cell
v
olta
ge
(V
)
Current density (A/cm
2)
Case 2 Case 4
Case 1 Case 3
[image:10.596.67.539.262.604.2]Cell voltage Power density
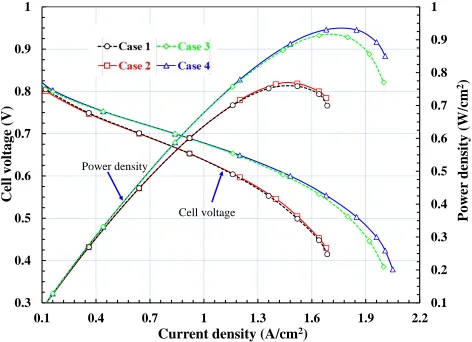
Figure 5. Comparison of the fuel cell performance among 4 experimental cases
The effect of gravity on fuel cell performance was experimentally analyzed in this research. Fig. 5 shows a comparison between voltage and performance corresponding to a variety of experimental cases. We can clearly observe that the voltage and power density of the PEMFC at different gravitational angles are different. When the positions of inlet gases are placed at the upper side, as described in cases 2 and 4, the fuel cell performance is enhanced. This enhancement is not achieved in cases 1 and 3, where the reaction gas inlet positions are both placed at the lower side.
respectively, whereas the values are 0.9307 and 0.9135 W/m2 in cases 4 and 3, respectively. The different power density among simulation cases is more obvious at high current densities when water molecules formed by the electrode reaction improve with the increase in current density. As described in many studies, the water discharge rate is an important parameter for water management. Consequently, water flooding in a PEMFC may occur when liquid water accumulates in the gas flow channel, especially when that accumulation occurs on the cathode side. When liquid water is not discharged from the fuel cell, excess water can happen and causes flooding. As a result, discharging water from the cathode is important for enhancing fuel cell performance. As described in [27, 33-34], liquid drop detachment from a solid surface is due to the effect of gravity or shearing forces overcoming obstacles of the viscous forces. The surface tensions between the liquid water drops and the GDL or BP surfaces have been considered to be the main force, meanwhile, the gravity of a water drop plays an important role on the water discharge [35].
During fuel cell operation, liquid water is formed by the reactions occurring in the cathode catalyst layer. The water then flows from the upper side to the bottom side of the flow field due to the gravity effect. When the direction of the gas is from the upper side to lower side, they will support for the water discharge because the gas direction is in the same direction as gravitational acceleration. Inversely, when they will hinder the water discharge, cathode flooding may occur at high current densities. As a result, when fuel cells are operated at high current densities, the power densities of cases 2 and 4 are dramatically higher than those of cases 1 and 3, respectively, as shown in Fig. 5. At low current densities, the differences are inappreciable because the amount of liquid water formed is usually small and there are only a few reactions occurring in the catalyst layers. In this case, the over water discharge causes evenly the membrane dehydration phenomena, which dramatically reduces the proton conductivity in order of magnitude. Consequently, in the low current density range, it can be clearly observed that the power densities of cases 2 and 4 are only slightly higher than those of cases 1 and 3, respectively. In addition, the large and different values of power density corresponding to the same current densities between two types of inlet gases boundary conditions control are also clearly observed, as shown in Fig. 5.
When applying constant stoichiometry control to cases 1 and 2, the constant stoichiometry ratios of the supply gases were respectively controlled by the values of 1.5 and 2 at the anode and cathode side. The experimental results showed that the maximum power densities are significantly high because the flooding of the membrane at the cathode side hinders the oxygen reactant gas for the electrochemical reaction, which significantly reduces the performance of the fuel cell. Many studies suggested that a higher pressure should be applied at the cathode side to solve the water flooding problem. Indeed, Fig. 5 shows that the power densities of cases 3 and are 4 are dramatically higher than those of cases 1 and 2 because of the higher mass inlet flow rates of cases 3 and 4.
4.2. Effects of relative gas flow direction of the anode and cathode on PEMFC characteristics
Corresponding to each type of flow direction, the distributions of pressure, temperature, water content, and current density at the membrane/catalyst interface were numerically examined. Fig. 4 illustrates the four simulation configurations related to various flow types. For the co-flow configuration (case 5), the direction of the inlet and outlet gas are the same direction in all five of the channels, as shown in Fig. 5a. The outlet gas flows in the direction opposite to the inlet gas, as the configuration in case 6 shows in Fig. 5b. For the interleaved flow configurations, the inlet and outlet gas in each channel of the BP are alternately flowed, corresponding to each direction. In case 7, the direction of the inlet gas in the center channel is opposite that of the four other remaining channels at both the anode and cathode side, as shown in Fig. 5c. Meanwhile, in case 8, the inlet gas directions in channels 2 and 4 are in opposition with the remaining three channels, as can be clearly observed in Fig. 5d.
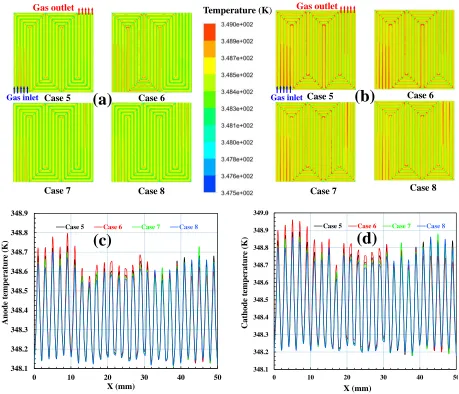
4.2.1. Effect of gas flow direction on the distribution of temperature and pressure
Temperature (K)
Case 5 Case 6
Case 7 Case 8
Gas inlet
Gas outlet
(a)
Case 5 Case 6Case 7 Case 8
(b)
Gas inlet Gas outlet 348.1 348.2 348.3 348.4 348.5 348.6 348.7 348.8 348.90 10 20 30 40 50
An od e temperat ur e (K) X (mm)
Case 5 Case 6 Case 7 Case 8
(c)
348.1 348.2 348.3 348.4 348.5 348.6 348.7 348.8 348.9 349.00 10 20 30 40 50
Ca th od e temperat ur e (K) X (mm)
Case 5 Case 6 Case 7 Case 8
(d)
[image:12.596.69.528.294.688.2]0 500 1000 1500 2000 2500 3000 3500
0 10 20 30 40 50
Ca th od e pr essur e (Pa ) X (mm)
Case 5 Case 6 Case 7 Case 8 0 50 100 150 200 250 300 350
0 10 20 30 40 50
An od e pr essur e (Pa ) X (mm)
Case 5 Case 6 Case 7 Case 8
Case 5 Case 6
Case 7 Case 8
Case 5 Case 6
Case 7 Case 8
(b)
Inlet Outlet Inlet Outlet(a)
(c)
(d)
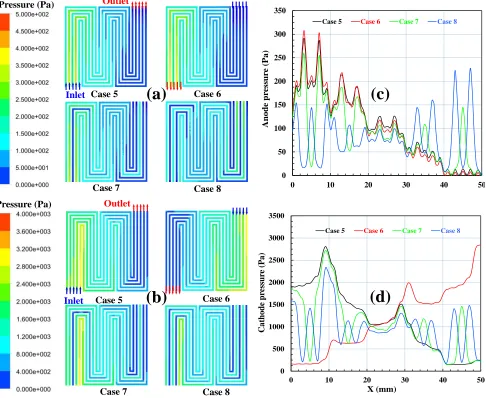
Pressure (Pa) Pressure (Pa)Figure 7. The pressure distributions of four simulation cases at the averaged current density of 1 A/cm2: (a) the total pressure distributions at the anode channel; (b) the total pressure distributions at the cathode channel; (c) the total pressures at the anode reference location; (d) the total pressures at the cathode reference location.
[image:13.596.61.547.75.473.2]
position channels in four simulation flow types.
The average temperatures arranged in ascending order are case 8, case 7, case 5, and case 6 for both the anode and cathode side. In every simulation, there are some local areas in the channels such as inlet areas and corners areas that have higher temperatures than other adjacent areas. Furthermore, the distribution of temperature in cases 7 and 8 are more uniform than that of cases 5 and 6. Consequently, interleaved flow enhances the heat release processes performed in the channels, which results in the more temperature uniformity in the fuel cells.
When comparing the co-flow and counter-flow type channels, the simulation results showed that the co-flow type has a lower pressure difference and a more uniform temperature distribution than the counter-flow type.
As can be seen in Fig. 7, the pressure is higher at the channel and is lower in under-rib areas. In addition, the pressure also gradually decreased from the inlet to the outlet due to the pressure drop and the effect of under-rib convection on the gas mass transfer through the serpentine flow field and the neighboring porous transport layer. Under-rib convection is intensified when the pressure difference between different areas in the fuel cell is large. Consequently, the greater the uniformity of pressure and reactant gases between the channels and rib areas can be reached in case 7 and especially case 8 because the interleaved flows results in increasing the different pressures between adjacent channels. In fact, this design induces a strong convection in the fuel cell, which uniformly distributes the reactant gases to the catalyst layer and spreads the product water over the fuel cell. This flow contributes to the performance improvement. In addition, the pressure is also different along the reference location for all simulation cases, it changes between the trough under the ribs and the peak under the channels, as clearly observed in Fig. 7c and d.
4.2.2. Effect of gas flow direction on water formation and distribution
Case 5 Case 6
Case 7 Case 8
Inlet
Outlet
(a)
Saturation
Case 5 Case 6
Case 7 Case 8
(b)
Inlet
Outlet Saturation
Anode gas inlet Case 5
Cathode gas inlet
Anode gas outlet
Cathode gas outlet
Anode gas outlet
Cathode gas inlet Cathode gas inlet
Anode gas inlet Anode gas outlet
Anode gas outlet
Anode gas inlet
Cathode gas inlet
Cathode gas outlet Cathode gas inlet
Cathode gas outlet
Anode gas outlet Anode gas inlet
Anode gas outlet
Cathode gas inlet
Cathode gas outlet Cathode gas inlet
Cathode gas outlet Anode gas inlet
Anode gas inlet
Case 6
Case 7
Case 8
[image:15.596.58.549.75.592.2](c)
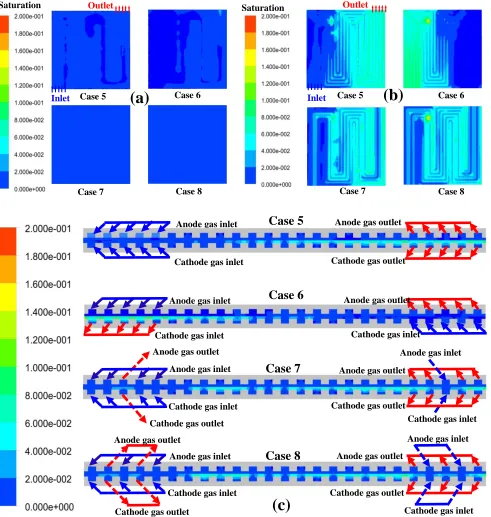
Figure 8. Simulation water distributions of four cases: (a) at the anode membrane side; (b) the at the cathode membrane side; (c) at the reference location.
left-hand side and higher on the right-hand side because the inlet gases flow from left to right along the channels. The rule is reversed when the gas flow is blown from the right side to the left side in case 6. Meanwhile, the water distribution is more uniform in case 7, especially in case 8 when the gas flow directions of adjacent channels are opposite. Generally, water saturation fluctuates along with the temperature; their average values arranged in ascending order are case 8, case 7, case 5, and case 6. In addition, the temperature is significantly high at the cathode side, especially in the outlet area. These phenomena can be explained by the effects of gas flow direction and the characteristics of PEMFC operation. Accordingly, water on the cathode side is produced by the oxidation reactions at the cathode catalyst and the water transformation from the anode side because of the electro-osmotic drag caused by the proton transport. Also, water is transferred from the cathode to the anode by back diffusion flux. However, at high current densities, the electro-osmotic drag normally prevails over back diffusion at high current densities; as a result, the anode will tend to dry out, which could raise the ohmic resistance and lead to a reduction in cell voltage [22, 36]. On the other hand, excess water at the cathode side is responsible for cathode flooding and will prevent the oxygen from being transported to the catalyst layer. This can lead to a reduction in fuel cell performance.
In this research, all of the boundary conditions were controlled in the same way for all simulation cases; therefore, the gas flow direction plays the main role for the different water distributions among them. Because the reactant flow contributes to flushing water out of the fuel cell through evaporation and convection, as shown in [37-39], these processes will be increased when there is a different pressure among adjacent channels. Consequently, the interleaved flows in cases 7 and 8 help to achieve uniform water distribution and reduced cathode flooding.
The water formation and discharge have a direct effect on the membrane water content, which relates to the membrane resistance, diffusion coefficient, electro-osmotic drag, and water flooding in fuel cell operation. The membrane water content relates to water activity and total pressure as shown in Eqs. 1-2 [1, 40].
(1)
(2)
where is the water content of membrane, is the water activity, is the water vapor in stream k, the water mole fraction in stream k, and are the pressure and diffusion temperature, respectively.
In addition, the ionic conductivity relates to the membrane water content, as shown in Eq. 3, and plays an important role in fuel cell operation because it directly affects fuel cell performance [1].
Water activity depends on the total water or super-saturated water vapor and is related to proton conductivity. Proton conductivity is proportional to the water activity and reaches a maximum value when equilibrated with the liquid water. This means that when operating at a high value of water activity, the membrane proton conductivity is optimized. However, this results in water condensation that hinders gas transfers in the fuel cell. Fig. 9 shows the membrane water content and water activity along a reference location. The membrane water content and water activity reaches peak value under the channels and under the rib areas. The membrane water content and water activities of case 5, case 7, and case 8 are not different and have a high value. However, they dramatically fluctuate in case 6; they exhibit high values at the inlet areas and significantly lower values at the outlet areas.
Case 5 Case 6
Case 7 Case 8
Inlet
Outlet
(a)
Case 5 Case 6Case 7 Case 8
Outlet
(b)
Water content 0.7 0.8 0.9 1.0 1.1 1.20 10 20 30 40 50
Li quid wat er act ivity X (mm)
Case 5 Case 6 Case 7 Case 8
(d)
Inlet 5.00 6.25 7.50 8.75 10.00 11.25 12.50 13.75 15.000 10 20 30 40 50
Membra ne w at er cont ent ( λ) X (mm)
Case I Case II Case III Case IV
(c)
0.7 0.8 0.9 1.0 1.1 1.20 10 20 30 40 50
Li quid wat er act ivity X (mm)
[image:17.596.57.544.245.697.2]Case 5 Case 6 Case 7 Case 8
Many previous studies have demonstrated that an appropriate value for membrane water content is approximately 14. This means that the membrane proton conductivity is optimized; however, water flooding can occur at a higher value of membrane water content [1, 41]. Fig. 9 shows the comparisons of the membrane water contents at the anode and cathode membrane surface of all simulation cases. Consequently, gas flow direction has a direct effect on the membrane water content, which results in different distributions in four simulation cases. At the anode side, the membrane water content is normally small in almost areas of case 5, case 7 and case 8; however, there are some areas of case 6 near the anode inlet area that have a higher value than 14. The different value between the anode and cathode inlet area is particularly significant in case 6. This means that anode flooding can occur in case 6 in some local areas, although its anode membrane section is almost completely dry. In addition, the anode membrane water content distribution in case 8 is the most uniform, and that of case 7 is also more uniform than that of cases 5 and 6. On the cathode side of the membrane, the water content clearly increases from the inlet to the outlet in cases 5 and 6. This is because the total pressure drop affects the water discharge performed by the inlet flow of the cathode side. The role of flow gases on the membrane water content is also obvious which results in a more uniform distribution in cases 7 and 8 compared to cases 5 and 6. The cathode membrane water content over the membrane areas is quite similar and corresponds to values ranging from 12–14, except for the cathode inlet areas in the channels. In addition, there are only some small areas that have extraordinary values of membrane water content (higher than 14 or less than 12); meanwhile, these areas are large in case 5, especially in case 6.
4.2.3. Effect of gas flow direction on fuel cell performance
0 0.12 0.24 0.36 0.48 0.6 0.72 0.84 0.96
0.3 0.4 0.5 0.6 0.7 0.8 0.9 1
0 0.2 0.4 0.6 0.8 1 1.2 1.4 1.6 1.8
Power
density
(W/cm
2)
Cell
v
olta
ge
(V
)
Current density (A/cm2)
Case 5_Simulation Case 5_Experiment
Cell voltage Power density
[image:18.596.140.457.468.713.2]
Case 5 Case 6
Case 7 Case 8
Inlet
Outlet
(a)
Current density (A/cm2)
0 0.12 0.24 0.36 0.48 0.6 0.72 0.84 0.96
0.3 0.4 0.5 0.6 0.7 0.8 0.9 1
0 0.2 0.4 0.6 0.8 1 1.2 1.4 1.6 1.8 2 2.2
Power
density
(W/cm
2)
Cell
v
olta
ge
(V
)
Current density (A/cm2)
Case 5 Case 6 Case 7 Case 8
(b)
[image:19.596.142.460.76.610.2]Cell voltage Power density
Figure 11. Comparisons of four simulation cases: (a) current density distributions, (b) the performance curves
process are not verified with the experimental values. However, with small variations, the simulation results are still meaningful and necessary for performing physical transport phenomenon of the fuel cell operation.
Fig. 11 shows the current density distributions on the MEA surface and fuel cell performance of four simulated at the averaged current density of 1 A/cm2. Consequently, the current density of case 5 decreases according to the direction of the anode and cathode gas from the inlet to the outlet due to the reduction in reacting gases. In case 6, when the direction of the inlet and outlet gas is opposite, high current density can be observed in the middle area of the fuel cell. However, in cases 7 and 8, when the directions of the inlet gases are arranged alternatively, the high current density areas appear at both sides of the fuel cell. In addition, their current density distributions are also more uniform than those of cases 5 and 6 because these flow types contribute to enhancing the gas distribution from the channels to the adjacent areas. This occurs because of the under-rib convection phenomenon.
As a result, the current density distributions of four simulation cases are different because the different flow types result in uneven electrochemical reactions. At a constant current density of 1 A/cm2, the cell voltages of cases 5–8 are 0.629 V, 0.604 V, 0.668 V, and 0.692 V, respectively. The maximum difference in the power density of the four simulation cases at the same current density occurs in cases 6 and 8 and corresponds to approximately 17%. When the current density was constantly controlled in this simulation, the differences in cell voltages between these cases were affected by the flow types, which contributed to the different distributions of pressure drops, water saturation, membrane water content, and membrane conductivity, as clearly mentioned above. This means that in comparison to the other flow types, the configuration of the gas direction in case 6 is the least effective at improving the fuel cell performance. This is because the counter-flow plays the vague role in distributing gases and liquid water over the fuel cell. Otherwise, utilizing the flow types featured in case 8, when the gas direction between adjacent channels is alternatively changed, the performance of the fuel cell is dramatically improved.
5. CONCLUSIONS
This study focused on evaluating the effects of flow field designs and boundary operating conditions on fuel cell operation by investigating the physical transport phenomena occurring within the fuel cell. The configuration of BPs used for the numerical analysis is a conventional serpentine flow-field with five passes and four turns. Its drawing was built-in CAD design software to support the simulation effort and the experiment process. In addition, all the BPs used in the experiment were fabricated using highly accurate CNC machines to ensure high precision. To study the gravity effect, the experiment process was conducted by changing the inlet and outlet flow by combining the bipolar plate positions. In addition, the supplied flows boundary conditions were investigated to determine their effect on fuel cell operation. A three-dimensional numerical simulation of the effects of relative gas flow directions on PEMFC characteristics was also conducted to compare the performance characteristics among co-flow, counter-flow, and interleaved flow types of supplied gas direction.
Consequently, when the reaction gas inlet positions are placed at the upper side, the fuel cell performance is enhanced compared to cases where the reaction gas inlet positions are placed at the lower side. The largest difference can exceed 5%, and this phenomenon is more obvious at the high current densities of fuel cell operation. In addition, when increasing the mass flow rate of the supplied gases, the fuel cell performance is also enhanced and the effect of gravity is less noticeable. In addition to gravity, the direction of the gas flow also affects fuel cell operation. Indeed, when the gas direction between adjacent channels is alternatively changed in the interleaved flow configuration, the fuel cell performance is dramatically enhanced compared to other flow types. The configuration counter-flow type demonstrated the worst ability to improve the fuel cell performance because the counter-flow plays a vague role in distributing gases and liquid water over the fuel cell. The maximum difference in power density among flow types at the same current density is up to approximately 17%. Future research will focus on optimizing the configuration of flow types by increasing the channels of BPs and evaluating their effect on fuel cell operation. In addition, the various boundary conditions applied for fuel cell operation will also be conducted to fully determine the effect of gravity and gas flow type on the fuel cell performance.
ACKNOWLEDGMENTS
This work was supported by the 2016 Post-doctoral Research Program of Inje University.
References
1. D. V. Nguyen, J. K. Lee, K. C. Kim, J. W. Ahn, S. H. Park, T. U. Kim, and H. M. Kim, J Power Sources, 293 (2015) 447.
2. Z. Wan, H. Chang, S. Shu, Y. Wang, and H. Tang, Energies, 7 (2014) 3179. 3. D. V. Nguyen and H. M. Kim, Energies, 9 (2016) 844.
4. S. Asghari, A. Mokmeli, and M. Samavati, Int J Hydrogen Energy, 35 (2010) 9283. 5. F. Barbir, Pem Fuel Cells Theory and Practice, New York (2013).
6. C. Cadet, S. Jemeï, F. Druart, and D. Hissel, Int J Hydrogen Energy, 39 (2014) 10613. 7. R. Petrone, Z. Zheng, D. Hissel, M. C. Péra, C. Pianese, and M. Sorrentino, Int J Hydrogen
Energy, 38 (2013) 7077.
8. Z. Li, R. Outbib, D. Hissel, and S. Giurgea, Control Eng Pract, 28 (2014) 1. 9. G. S. Avcioglu, B. Ficicilar, and I. Eroglu, Int J Hydrogen Energy, 42 (2017) 496. 10.A. Hermann, T. Chaudhuri, and P. Spagnol, Int J Hydrogen Energy, 30 (2005) 1297. 11.M. Bilgili, M. Bosomoiu, and G. Tsotridis, Int J Hydrogen Energy, 40 (2015) 2303. 12.K. S. Choi, B. G. Kim, K. Park, and H. M. Kim, Fuel Cells, 12 (2012) 908.
13.K. S. Choi, I.J. Choi, S.J. Hwang, H.M. Kim, J.L. Dorr, and P.A. Erickson, Renew Energy, 35 14.K. S. Choi, J. W. Ahn, J. K. Lee, D. V. Nguyen, H. M. Kim, K.W. Park, and G. Y. Hwang 29,
(2014) 727, IEEE Trans. Energy Convers, 29 (2014) 727.
15.K. S. Choi, B.G. Kim, K. Park, and H. M. Kim, Comput Fluids, 69 (2012) 81.
16.K. S. Choi, H. M. Kim, H. C. Yoon, M. E. Forrest, and P.A. Erickson, Energy Convers Manag, 49 (2008) 3505.
17.D. V. Nguyen, J. K. Lee, K. W. Park, and H. M. Kim, Mater Sci Forum, 804 (2015) 75. 18.D. V. Nguyen, J. K. Lee, K. C. Kim, J. W. Ahn, S. H. Park, T. U. Kim, and H. M. Kim, Int J
Electrochem Sci., 10 (2015) 5842.
20.T. Monsaf, B. M. Hocine, and S. Youcef, Int J Hydrogen Energy, 42 (2017) 1237. 21.F. C. Chen, Z. Gao, R. O. Loutfy, and M. Hecht, Fuel Cells, 3 (2003) 181.
22. -Ybarra, and L. Daza, J Power Sources, 86 (2000) 363.
23.H. Liu, P. Li, D. Juarez-robles, K. Wang, and A. Hernandez-guerrero, Front. Energy Res., 2 (2014) 1.
24.J. H. Nam, K. J. Lee, S. Sohn, and C. J. Kim, J Power Sources, 188 (2009) 14.
25.X. D. Wang, Y. Y. Duan, W. M. Yan, D. J. Lee, A. Su, and P. H. Chi, J Power Sources, 193 (2009) 684.
26.C. Xu and T. S. Zhao, Electrochem Commun, 9 (2007) 497.
27.Y. Yu, Z. K. Tu, Z. G. Zhan, and M. Pan, Int. J. Energy Res., 36 (2012) 845. 28.A. Morin, F. Xu, G. Gebel, and O. Diat, Int J Hydrogen Energy, 36 (2011) 3096. 29.L. K. Kwac and H. G. Kim, J Mech Sci Technol, 22 (2009) 1561.
30.I. Khazaee and H. Sabadbafan, Energy, 101 (2016) 252.
31.R. Bove, T. Malkow, A. Saturnio, and G. Tsotridis, J Power Sources, 180 (2008) 452. 32.A. Iranzo, M. Muñoz, F. Rosa, and J. Pino, Int J Hydrogen Energy, 35 (2010) 11533. 33.Y. Zhao, Theor Appl Mech Lett, 4 (2014) 34002.
34.F. Y. Zhang, X. G. Yang, and C. Y. Wang, J Electrochem Soc, 153 (2006) 225.
35.P. Sridhar, R. Perumal, N. Rajalakshmi, M. Raja, and K. S. Dhathathreyan, J Power Sources, 101 (2001) 72.
36.M. Ji, and Z. Wei, Energies, 2 (2009) 1057.
37.M. W. Knobbe, W. He, P. Y. Chong, and T. V. Nguyen, J Power Sources, 138 (2004) 94. 38.A. Theodorakakos, T. Ous, M. Gavaises, J. M. Nouri, N. Nikolopoulos, and H. Yanagihara, J
Colloid Interface Sci, 300 (2006) 673.
39.T. V. Nguyen and M. W. Knobbe, J Power Sources, 114 (2003) 70.
40.K. S. Choi, H. M. Kim and S. M. Moon, Int J Hydrogen Energy, 36 (2011) 1613. 41.K. S. Choi, H. M. Kim, and S. M. Moon, Electrochem Commun, 13 (2011) 1387.
![Table 1. Geometric details of the cell components used in this research [1,3].](https://thumb-us.123doks.com/thumbv2/123dok_us/1828056.138680/4.596.55.546.72.316/table-geometric-details-cell-components-used-research.webp)
![Table 2. Details of the parameters and properties used in this simulation [1,3].](https://thumb-us.123doks.com/thumbv2/123dok_us/1828056.138680/6.596.62.531.283.637/table-details-parameters-properties-used-simulation.webp)
![Table 3. The boundary and operation conditions performed in this research [1,3].](https://thumb-us.123doks.com/thumbv2/123dok_us/1828056.138680/9.596.63.528.371.764/table-boundary-operation-conditions-performed-research.webp)