TOWARDS AN ADAPTIVE OS NOISE MITIGATION TECHNIQUE FOR
MICROBENCHMARKING ON APPLE IPAD DEVICES
Adam Rehn, James Cook University, Cairns, Australia, [email protected]
John Hamilton, James Cook University, Cairns, Australia, [email protected]
Jason Holdsworth, James Cook University, Cairns, Australia, [email protected]
ABSTRACT
This study investigates levels of Operating System (OS) noise on Apple iPad mobile devices. OS noise causes variations in application performance that interfere with microbenchmark results. OS noise manifests in collected data through extreme outliers and variations in skewness. Using our collected data, we develop an iterative, semi-automated outlier removal process for Apple iPad OS noise profiles. The profiles generated by outlier removal represent the first step toward an adaptive noise mitigation technique, which presents opportunities for use in microbenchmarking across other mobile platforms.
Keywords: Benchmark, outlier removal, operating system noise, jitter, mobile microbenchmark
INTRODUCTION
Microbenchmarking is a subset of benchmarking that examines the performance characteristics of individual components of a software application, as opposed to the application as a whole [22]. Microbenchmarking is an effective tool in the analysis of key application components, such as user interface responsiveness [7]. In a mobile context, responsiveness of interactive applications has been demonstrated to significantly influence user perception [24]. Microbenchmarking represents an important potential tool in optimising mobile device platforms and applications. However, existing microbenchmarking approaches suffer from inherent limitations.
On any platform, microbenchmarking suffers from the significant limitation that it is susceptible to interference from the underlying operating system and hardware [28]. Interference from underlying system activities is referred to as Operating System (OS) noise [1]. OS noise causes performance variations in user-level applications. These variations then manifest in microbenchmark results [28]. Existing microbenchmarking techniques do not provide a comprehensive approach to address the effects of OS noise on microbenchmark results.
Existing literature on microbenchmarking typically attributes noise to measurement inaccuracies caused by instability of the underlying system clock [22] [23]. These inaccuracies were particularly prevalent on older hardware and could result in an effective clock resolution on the order of milliseconds on some systems [22]. However, the system clock utilised under iOS is built on the CPU cycle counter, and is completely stable with nanosecond accuracy [2]. The performance variations observed by our user-level microbenchmark demonstrate the influence of OS noise in an environment where clock instability is not an issue.
Literature on OS noise in the parallel computing context utilises microbenchmarks for measuring OS noise levels [4][19][21]. The use of microbenchmarking as a tool to measure OS noise is itself a statement that microbenchmark results are influenced by OS noise. However, researchers in the parallel computing context appear to consider microbenchmarking as simply a means to an end. To date, we have sourced no research contributions made by the OS noise research community to the knowledge base of performance microbenchmarking.
In the embedded systems context, Wang et al. [28] consider the influence of underlying system perturbations to application performance. Microbenchmarks are used to measure system performance. However, their research focuses primarily on the implications of noise for embedded real-time applications. The only contribution to the knowledge base of microbenchmarking is to pair microbenchmarks with workloads representative of actual application behaviour, in order to make the measured results more meaningful [28].
Although the existing literature utilises microbenchmarking to make contributions to OS noise research, we believe our work is the first that utilises OS noise research to make a contribution to the knowledge base of performance microbenchmarking. In this paper we perform a preliminary exploratory study into the levels of OS noise on 20 identical Apple iPad Air devices. We examine the characteristics of the collected data and compare it to previous observations of OS noise data. We then develop an outlier removal technique to generate OS noise profiles from the collected data. The generated profiles present potential for use as the basis of an adaptive noise mitigation technique.
The contributions of our research are as follows:
We perform a study to examine OS noise on Apple iPad devices. We are aware of no previous studies that examine OS noise in a mobile context.
The OS noise profile generated by outlier removal represents the first step towards an adaptive noise mitigation technique for use in microbenchmarking.
The rest of this paper is structured as follows. First, we explore the existing literature on OS noise in a number of contexts, and motivate our work by highlighting the existing knowledge gaps. We then describe our Apple iPad OS noise study. Finally, we present our semi-automated outlier removal process, developed using our collected data.
BACKGROUND
Operating System (OS) noise is the interference to application performance caused by the underlying operating system and hardware [20]. Application performance variations arise when background system activities occupy processor time [19]. Little existing work examines OS noise in a mobile context. OS noise is inconsequential to most mobile applications, and impacts only specialised software such as microbenchmarks and applications with real-time requirements [28]. However, OS noise has been studied extensively in the context of parallel computing, where its impact is significant [1]. We examine OS noise the contexts of parallel computing and microbenchmark accuracy.
Impact of OS noise within parallel computing
The impacts of OS noise have been extensively explored within the field of parallel computing [1]. Parallel computing applications commonly utilise a bulk-synchronous computation model. In this model, all nodes perform processing concurrently and synchronise with one another at the completion of each step. All nodes must complete each step before synchronisation can occur and the next step can begin [20]. Due to the lockstep nature of this process, delays on any given node postpone the completion of the entire step [20]. Small delays caused by OS noise, accumulate over the course of a parallel application’s execution. The accumulated delay can result in severe performance degradation and reduced scalability [9]. Next, we examine the underlying sources of OS noise, approaches to measuring OS noise, and approaches to OS noise research.
Sources of OS noise
Operating system clock ticks are frequently identified as a source of OS noise [17] [18] [26]. Clock ticks are interrupts generated by the operating system at a regular fixed interval so that the operating system can perform runtime tasks and provide timing services to applications [1] [26]. In order to reduce levels of OS noise generated by clock ticks, Tsafrir et al. [26] propose a dynamic timer system to replace the use of fixed interval timers, which Akkan et al. [1] refer to as a “tickless” kernel.
Daemons are another commonly identified source of OS noise [6] [17] [19] [25]. Daemons are background processes, and can include both generic system tasks as well as specialist services, such as cluster management software [19].
Numerous memory access-related events are identified as noise sources, including cache misses [6] [25] [26], page faults [6] [17], and translation lookaside buffer (TLB) misses [6] [17]. These events can be caused by memory access in both application code and kernel code [25].
A number of other sources of OS noise are also commonly identified, including interrupts generated by timers and other hardware events [1] [8] [19] [26], and the context switching mechanism utilised by pre-emptive process scheduling [6] [18].
OS noise is the result of complex interactions between numerous system components and events. Removal of these underlying sources is complicated [1], and is beyond the scope of this study. In order to mitigate the effects of OS noise on microbenchmark results, noise levels must first be measured.
Measuring OS noise
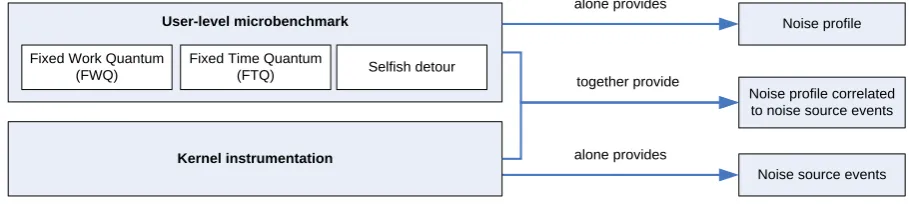
[image:2.595.68.523.615.717.2]Techniques for measuring OS noise commonly utilise two main approaches. These approaches are illustrated in Figure 1.
Figure 1: Common approaches to measuring OS noise.
The first approach utilises a user-level microbenchmark to measure performance variations and build a profile of OS noise.
alone provides
User-level microbenchmark
Fixed Work Quantum (FWQ)
Kernel instrumentation
Fixed Time Quantum
(FTQ) Selfish detour together provide
Noise source events Noise profile
User-level microbenchmark implementations include Fixed Work Quantum (FWQ) [19], Fixed Time Quantum (FTQ) [21], and selfish detour [4]. These implementations all utilise a loop to measure performance perturbations. Fixed Time Quantum measures work performed per unit of time [21], whilst Fixed Work Quantum and selfish detour measure the time taken to perform a unit of work [1] [4].
The second approach utilises kernel instrumentation to measure underlying events that represent sources of OS noise [6]. Although Morari et al. [17] generate noise profiles using kernel instrumentation alone, kernel instrumentation and user-level microbenchmarks are often utilised in combination. This hybrid approach correlates noise profiles generated by a user-level microbenchmark with the underlying OS events captured by kernel instrumentation [6] [18].
The use of kernel instrumentation provides more detailed information than user-level benchmarks alone, but requires modification of the operating system kernel [6]. Such modifications are possible on desktop operating systems, but are prevented by security restrictions on some mobile device platforms. User-level microbenchmarks provide only a profile of OS noise with no information about the underlying sources [18], but can be easily utilised under any platform. In a mobile context, user-level microbenchmarks are ideal because they can be utilised across all mobile device platforms.
The data generated by OS noise measurement techniques is typically used as the basis for further analysis. The measurement technique, analysis, and any further action taken based on the analysis results, form the high-level approach taken by most existing OS noise studies.
OS noise research approach
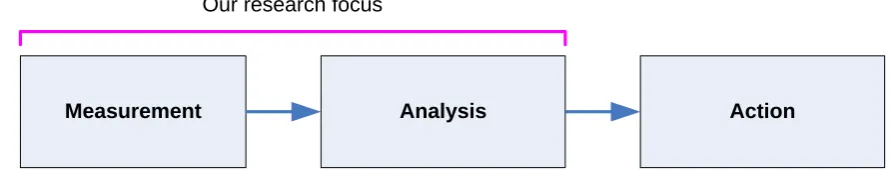
[image:3.595.70.516.340.425.2]Existing research on OS noise follows a common approach. This approach is depicted in Figure 2, and consists of three components: measurement, analysis, and action.
Figure 2: Common approach embodied by existing OS noise research.
OS noise studies typically begin by performing a measurement, either of OS noise levels [1] [4] [21], noise sources [6][18], or the performance impact of noise [8] [9]. The data generated by the selected measurement technique is then analysed.
Techniques used for analysis of collected data vary among existing OS noise studies. The technique selected depends upon the nature of the information collected, and the goal of the study. Analysis goals of existing studies include comparison between OS noise measurement techniques [17] [21], correlation of OS noise events to underlying noise sources [18] [26], and examining the performance impacts of OS noise at varying levels of frequency and granularity [4] [8]. Discussion of analysis results can motivate proposals or recommendations [26], or may be used as the basis for further action.
The insights gained from the results of analysis can be utilised to perform actions to address any identified issues. These actions may be taken as part of the same study or a subsequent study. Actions taken by existing OS noise studies include modification of operating systems to reduce noise [1] [19] and implementation of distributed schedulers to mitigate the effects of OS noise on parallel applications [14].
Our preliminary study into OS noise levels on identical Apple iPad Air devices embodies the first two components of this approach. We first measure OS noise levels, and then analyse the collected data to remove outliers. The OS noise profile generated by outlier removal represents the first step toward an OS noise mitigation technique for microbenchmarking. The development of such a technique represents the third and final component, action, and is the focus of our future work.
Microbenchmark accuracy
Very little existing work explores the effects of OS noise in the context of microbenchmark accuracy [22] [23].
Staelin and McVoy [23] present mhz, a microbenchmark program that determines processor clock speed by utilising system-independent techniques. The program is known to be susceptible to noise. An extremely naive noise mitigation approach is utilised, which simply reports the median of recorded observations in place of the mean [23]. No further processing is performed to detect or mitigate either data skewness or the presence of outliers.
Measurement Analysis Action
Staelin [22] describes lmbench, a microbenchmark suite that encompasses a number of components, including mhz. Measurement results are noted to be heavily skewed and contain extreme outliers. The author also states that the majority of values cluster heavily around the median [22]. In spite of these observations, enhancements to lmbench to mitigate the effects of noise are left as future work.
Existing work on OS noise in the context of microbenchmark accuracy describes a number of common characteristics in collected measurement results. These characteristics are presumed to be the result of noise. However, current implementations utilise only simple approaches to mitigate the effects of noise. Hence, we measure the levels of OS noise on Apple iPad devices and examine the characteristics of the collected data. Our analysis builds the first steps toward a more comprehensive approach for mitigating the effects of OS noise on microbenchmark accuracy.
PLATFORM CHARACTERISTICS OF APPLE IOS
The Apple iOS platform is selected for our study because the platform features a number of characteristics that are interesting when examining OS noise.
The iOS platform comprises a fixed set of hardware and software configurations manufactured by Apple. The use of a homogeneous, well-defined hardware and software configuration improves the reproducibility of our study.
The XNU kernel utilised by the iOS operating system is a “tickless” kernel [15]. Tickless kernels are designed to reduce OS noise due through the use of fewer OS clock ticks [1] [26]. The operating system also handles memory allocation differently depending on the requested block size. Block sizes are rounded up to either the nearest multiple of 16 or 4096. This can result in increased memory use if inefficient block sizes are utilised [3]. Memory state influences a number of underlying events that have been identified as sources of OS noise, including cache misses, page faults, and TLB misses [6] [17] [26].
The majority of iOS applications are compiled and run as native machine code. Other mobile platforms such as Android and Windows Phone [16] commonly utilise languages that run in an application-layer Virtual Machine (VM). Application-layer VMs introduce a significant layer of complexity that makes microbenchmarking extremely difficult [10]. Microbenchmarking with native code facilitates easy collection of OS noise data.
After collecting data on OS noise levels for iPad devices, we examine the characteristics of the collected data. The methodology and results of our experiment are described in the sections that follow.
EXPERIMENTAL METHODOLOGY
We measure the level of OS noise present 20 Apple iPad Air devices. All devices are identical hardware models, running identical software initialised to the same default state. All network connections are disabled on all devices. All devices’ clocks are synchronised, and the experiment code is scheduled to execute simultaneously across all devices.
We measure OS noise using a variation of the Fixed Work Quantum (FWQ) technique, minimising the amount of processing performed by recording timestamps in a tight loop [4]. We minimise processing further than previous approaches by manually unrolling the loop, removing the overhead of the loop header itself. Minimising the processing performed maximises the sampling rate, and ensures accuracy is as high as possible [11].
Unrolling the timestamp recording loop requires a fixed number of loop iterations. This precludes use of a filtering mechanism. As a result, we store all timestamp deltas generated. Due to the limitations of running FWQ for extended periods of time [21], we select a fixed iteration count of 10000, as a compromise between sample size and memory access. Accordingly, each trace represents the level of OS noise present on a device at a single point in time, as opposed to across an extended period.
To examine the characteristics of OS noise levels across different device states, we perform several different processing variations in the experiment code. The processing variations represent different memory access patterns, designed to result in a variety of device memory states. Processing involves allocating different sized blocks of memory. A number of block sizes are selected that are aligned to multiples of 16 or 4096, to represent efficient memory usage. Remaining block sizes are selected using prime numbers, to represent inefficient memory usage [3].
EXPERIMENTAL RESULTS Data characteristics
Table 1: Mean skewness and kurtosis of the collected data, before and after the removal of outliers.
Raw data Outliers Removed
Mean skewness 25.35 0.34
Mean kurtosis 989.32 6.05
In order to create a profile of OS noise levels, extreme outliers must first be removed from the data. We describe our outlier removal technique in the following section.
Outlier removal
We build our outlier removal technique on the Interquartile range Rule (IQR) presented by Tukey [27]. IQR defines the interquartile range as the 75th percentile minus the 25th percentile [27]. Cutoff points on either side of the interquartile range are calculated for use in identifying potential outliers. The cutoff points are defined as follows:
Lower cutoff = Q1 – 1.5(Q3 – Q1) (1)
Upper cutoff = Q3 + 1.5(Q3 – Q1) (2)
IQR is designed for identifying potential outliers on both the left and right sides of normally distributed data [12]. Our collected data has a hard lower bound, defined by the case that the level of OS noise is zero. Accordingly, we treat all values to the left of the median as inliers. This approach is utilised in other fields when data has a hard lower bound, such as salary data in economics [13]. As we eliminate the lower cutoff, we can modify the upper cutoff to utilise the increased range of guaranteed inliers, as such:
Upper cutoff = Q3 + 1.5(Q3 – Q0) (3)
Where Q0 is the 0th percentile, i.e. the minimum value in the dataset. This allows us to exclusively target outliers to the right of the data.
In addition to being characterised by a hard lower bound, our data is also skewed. The skewness of our data varies greatly. We use the medcouple robust measure of skewness [5] to determine the skew of our data without the influence of outliers. Possible values for the medcouple range from -1 to 1. Negative values represent left skewness, whilst positive values represent right skewness. A value of zero indicates a symmetrical distribution [5]. We observe medcouple values for our collected data ranging between -1 and 0.98, spanning almost the entire range of skewness from one extreme to the other.
As noted by Hubert and Vandervieren [12], the interquartile range rule is unsuitable for skewed data. A modification to the original formula is proposed for use with skewed data, referred to as an adjusted boxplot. However, the models utilised by the adjusted boxplot are unsuitable for extremely skewed data, which the authors specify as having a medcouple value less than -0.6 or greater than 0.6 [12]. Applying the adjusted boxplot to our collected data produces unsuitable cutoff values in cases where skewness falls at the extreme ends of the scale.
After testing current outlier detection techniques, we find that no automated method provides consistently acceptable results across our entire dataset. We therefore develop a semi-automated process to perform outlier detection for our dataset. We utilise a systematic trial-and-error process, whereby outlier cutoff points are automatically generated for our entire dataset over varying percentiles and distance ratios. The results of the automated process are then verified using visual inspection over a set of exemplar datasets that represent varying values for skewness. The process repeats until the most consistently acceptable outlier cutoff value is determined. This process resulted in the following formula:
Upper cutoff = 95th percentile + 3.0(95th percentile – Q0) (4)
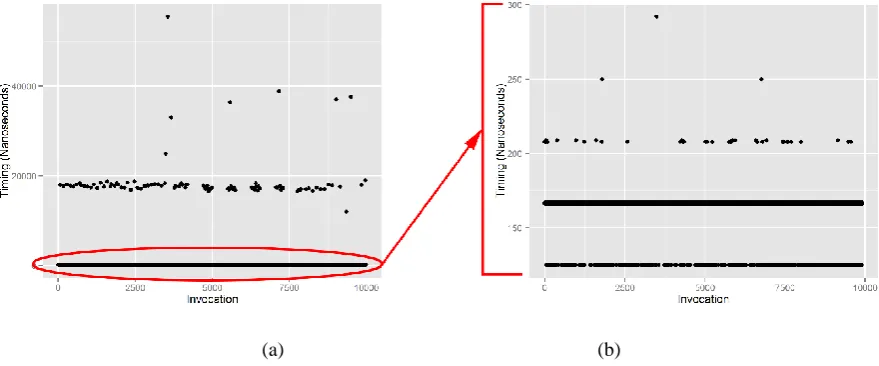
produces acceptable results for our collected data, the produced formula is heavily parameterised based on the unique characteristics of our collected data and thus unlikely to be suitable for other datasets. Scatterplots of an example dataset before (a) and after (b) outlier removal are depicted in Figure 3.
[image:6.595.76.516.104.287.2](a) (b)
Figure 3: Example scatterplots of our collected data, before outlier removal (a), and after outlier removal (b). Note the difference in scale: 0 - 55,000 for the raw data, 0 - 300 for the data after outlier removal.
IMPLICATIONS AND FUTURE WORK
Microbenchmarking potentially represents an important tool for analysis and optimisation of interactive mobile applications. Improvements to microbenchmarking are required to address the limitations of existing techniques with respect to the effects of OS noise. Improved analysis and optimisation tools can assist application developers in delivering more responsive interactive applications.
In spite of the extensive use of microbenchmarks as a tool for measuring OS noise, existing microbenchmarking techniques do not utilise a comprehensive approach for addressing the influence of OS noise on microbenchmark results. Our study represents the first step towards the development of a comprehensive OS noise mitigation technique. To our knowledge, this research also represents the first attempt to contribute to the context of performance microbenchmarking by drawing on OS noise research.
This work is a preliminary exploratory study into OS noise on identical iPad Air devices. Due to the similarities in hardware and software configurations, the experimental methodology utilised in our study can likely be applied to other Apple iOS devices, such as iPhone and iPod models. Further development of a fully automated outlier removal process presents opportunities for generalisability to other mobile device platforms as well. We are currently working toward the development of both fully automated outlier removal, and an OS noise mitigation technique that utilises the noise profiles generated by outlier removal.
CONCLUSION
OS noise interferes with the accuracy of microbenchmarking results. This study examines levels of OS noise present on identical Apple iPad Air devices. Our collected data demonstrates characteristics consistent with previous observations. The data is characterised by large variations in distribution, is clustered heavily around the median, and contains extreme outliers. We develop an iterative, semi-automated approach for removing outliers. Outlier removal results in a profile of OS noise levels. Generation of this OS noise profile represents the first step toward an adaptive noise mitigation technique, which presents potential for use in microbenchmarking on other mobile platforms.
REFERENCES
[1] Akkan, H., Lang, M. & Liebrock, L. M. (2012) ‘Stepping towards noiseless linux environment’, In Proceedings of the 2nd international workshop on runtime and operating systems for supercomputers, pp. 7:1–7:7, New York, NY, USA: ACM.
[2] Apple Inc. (2005) Technical Q&A QA1398, ‘Mach Absolute Time Units’, available at https://developer.apple.com/library/mac/qa/qa1398/_index.html
[3] Apple Inc. (2013) Memory Usage Performance Guidelines, ‘Tips for Allocating Memory’, available at
https://developer.apple.com/library/ios/documentation/Performance/Conceptual/ManagingMemory/Articles/MemoryAll oc.html
collective operations at extreme scale’, In 2006 IEEE international conference on cluster computing, p. 1-12.
[5] Brys, G., Hubert, M. & Struyf, A. (2004) ‘A robust measure of skewness’, Journal of Computational and Graphical Statistics, 13(4).
[6] De, P., Kothari, R. & Mann, V. (2007) ‘Identifying sources of operating system jitter through fine-grained kernel instrumentation’, In Proceedings of the 2007 IEEE international conference on cluster computing, pp. 331–340, Washington, DC, USA: IEEE Computer Society.
[7] Endo, Y., Wang, Z., Chen, J. B. & Seltzer, M. (1996) ‘Using latency to evaluate interactive system performance’, In Proceedings of the second USENIX symposium on operating systems design and implementation, pp. 185–199, New York, NY, USA: ACM.
[8] Ferreira, K. B., Bridges, P. & Brightwell, R. (2008) ‘Characterizing application sensitivity to os interference using kernel-level noise injection’, In Proceedings of the 2008 acm/ieee conference on supercomputing, pp. 19:1–19:12, Piscataway, NJ, USA: IEEE Press.
[9] Garg, R. & De, P. (2006) ‘Impact of noise on scaling of collectives: An empirical evaluation’, In Y. Robert, M. Parashar, R. Badrinath & V. Prasanna (Eds.), High performance computing - HiPC 2006, Vol. 4297, p. 460-471, Springer Berlin Heidelberg.
[10] Gil, J. Y., Lenz, K. & Shimron, Y. (2011) ‘A microbenchmark case study and lessons learned’, In Proceedings of the compilation of the co-located workshops on DSM’11, TMC’11, AGERE!’11, AOOPES’11, NEAT’11, & VMIL’11, pp. 297–308, New York, NY, USA: ACM.
[11] Hoefler, T., Schneider, T. & Lumsdaine, A. (2010) ‘Characterizing the influence of system noise on large-scale applications by simulation’, In Proceedings of the 2010 ACM/IEEE international conference for high performance computing, networking, storage and analysis, pp. 1–11, Washington, DC, USA: IEEE Computer Society.
[12] Hubert, M. & Vandervieren, E. (2008) ‘An adjusted boxplot for skewed distributions’, Computational Statistics & Data Analysis, 52(12), pp.5186–5201.
[13] Jenkins, S. P. & Van Kerm, P. (2006) ‘Trends in income inequality, pro-poor income growth, and income mobility’,
Oxford Economic Papers, 58(3), pp. 531-548, available at http://oep.oxfordjournals.org/content/58/3/531.abstract [14] Jones, T. (2011) ‘Linux kernel co-scheduling for bulk synchronous parallel applications’, In Proceedings of the 1st
international workshop on runtime and operating systems for supercomputers pp. 57–64, New York, NY, USA: ACM. [15] Levin, J. (2012) Mac OS X and iOS Internals: To the Apple’s Core, John Wiley & Sons.
[16] Microsoft Corporation. (2014) ‘Windows Phone API reference’, available at http://msdn.microsoft.com/en-us/library/windows/apps/ff626516%28v=vs.105%29.aspx
[17] Morari, A., Gioiosa, R., Wisniewski, R., Cazorla, F. & Valero, M. (2011) ‘A quantitative analysis of os noise’, In Parallel distributed processing symposium (IPDPS), 2011 IEEE international, pp. 852-863.
[18] Nataraj, A., Morris, A., Malony, A. D., Sottile, M. & Beckman, P. (2007) ‘The ghost in the machine: Observing the effects of kernel operation on parallel application performance’, In Proceedings of the 2007 ACM/IEEE conference on supercomputing pp. 29:1–29:12, New York, NY, USA: ACM.
[19] Petrini, F., Kerbyson, D. J. & Pakin, S. (2003) ‘The case of the missing supercomputer performance: Achieving optimal performance on the 8,192 processors of ASCI Q’, In Proceedings of the 2003 ACM/IEEE conference on supercomputing, pp. 55, New York, NY, USA: ACM.
[20] Seelam, S., Fong, L., Tantawi, A., Lewars, J., Divirgilio, J. & Gildea, K. (2013) ‘Extreme scale computing: Modeling the impact of system noise in multi-core clustered systems’, Journal of Parallel and Distributed Computing, 73(7), pp.898 - 910. (Best Papers: International Parallel and Distributed Processing Symposium (IPDPS) 2010, 2011 and 2012)
[21] Sottile, M. & Minnich, R. (2004) ‘Analysis of microbenchmarks for performance tuning of clusters’, In 2004 IEEE international conference on cluster computing, pp. 371-377.
[22] Staelin, C. (2005) ‘lmbench: an extensible micro-benchmark suite’, Software: Practice and Experience, 35(11), pp.1079–1105.
[23] Staelin, C. & McVoy, L. (1998) ‘Mhz: Anatomy of a micro-benchmark’, In Proceedings of the annual conference on USENIX annual technical conference, pp. 13–13, Berkeley, CA, USA: USENIX Association.
[24] Tolia, N., Andersen, D. G. & Satyanarayanan, M. (2006) ‘Quantifying interactive user experience on thin clients’,
Computer, 39(3), pp. 46–52.
[25] Tsafrir, D. (2007) ‘The context-switch overhead inflicted by hardware interrupts (and the enigma of do-nothing loops)’,
In Proceedings of the 2007 workshop on experimental computer science. New York, NY, USA: ACM.
[26] Tsafrir, D., Etsion, Y., Feitelson, D. G. & Kirkpatrick, S. (2005) ‘System noise, OS clock ticks, and fine-grained parallel applications’, In Proceedings of the 19th annual international conference on supercomputing, pp. 303–312, New York, NY, USA: ACM.
[27] Tukey, J. W. (1977) Exploratory data analysis, Boston, MA, USA: Addison-Wesley.