Settlement of shallow foundations due to rise of water table in granular soils
183
0
0
Full text
(2) Settlement of Shallow Foundations Due to Rise of Water Table in Granular Soils. Thesis submitted by Mohammad Abu Naser Shahriar BSc. (Hons) In November 2014. For the degree of Doctor of Philosophy In the College of Science, Technology and Engineering James Cook University.
(3) STATEMENT OF ACCESS I, the undersigned, the author of this thesis, understand that James Cook University will make it available for use within the University Library and, by microfilm or other means, allow access to users in other approved libraries. All users consulting this thesis will have to sign the following statement: In consulting this thesis, I agree not to copy or closely paraphrase it in whole or in part without the written consent of the author; and to make proper public written acknowledgement for any assistance which I have obtained from it.. Beyond this, I do not wish to place any restriction on access to this thesis.. 28/11/2014 Signature. Date. ii.
(4) STATEMENT OF SOURCES. DECLARATION I declare that this thesis is my own work and has not been submitted in any form of another degree or diploma at any university or other institution of tertiary education. Information derived from the published or unpublished work of others has been acknowledged in the text and a list of references is given.. 28/11/2014 Signature. Date. DECLARATION- ELECTRONIC COPY I, the undersigned, the author of this work, declare that to the best of my knowledge, the electronic copy of this thesis submitted to the library at James Cook University is an accurate copy of the printed thesis submitted.. 28/11/2014 Signature. Date. iii.
(5) ACKNOWLEDGEMENTS I would like to express my deepest appreciation to all the professors, supervisors, friends and my family members for their incredible support, sincere guidance and encouragement throughout the tenure of my post graduate research study. I would like to express my special appreciation and thanks to my principal supervisor A/Professor Dr. Nagaratnam Sivakugan, who has been a tremendous mentor for me. I would like to thank my associate supervisors Dr. Vincent Wang and Professor Braja M. Das for encouraging my research and providing me excellent research training. I want to thank Mr Warren O’Donnell for his valuable advice and guidance. I would also like to thank all my friends and colleagues, especially Hasan Mahmud, Shanka Widisinghe, Dhanya Ganesalingam for their ongoing support and valuable assistance. A special thanks to my family. I wish to express my sincere love and gratitude to my beloved wife Afrin Mehjabeen and my parents Abdul Latif Sarker and Nazma Ahmed for their understanding and endless love throughout the duration of my studies.. iv.
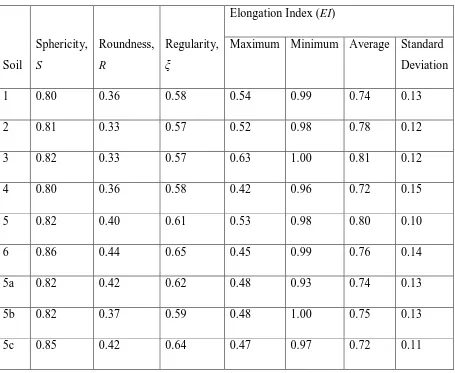
(6) ABSTRACT Shallow foundations are designed to limit settlements within tolerable limits. Rise of water level due to seasonal changes produce additional settlements of footings resting on granular soils and can threaten the integrity of the structure. Effect of water table rise on shallow foundation settlement was addressed by various researchers. Terzaghi’s intuitive suggestion was to double the predicted settlement in dry sand to get the settlement in submerged condition. Analytical, experimental and numerical works by others were aimed at developing a correction factor to account for the effect of water table rise on foundation settlement. The objective of this study is to investigate the effect of water level rise on shallow foundation settlement in granular soils through numerical, analytical and experimental studies. This study revisits Schmertmann’s (1970) strain influence factor diagrams and modified influence factor diagrams for footings of various shapes (strip, circular, square, rectangular) are proposed using linear elastic models in FLAC and FLAC3D. Then a rational method is proposed, based on proposed strain influence factors, to predict the additional settlement produced by the rise of water table on a footing resting on sands. The proposed method is validated by extensive laboratory test data where model footings of five different shapes were loaded in sand placed at two relative densities, where water level was raised from the bottom while the additional settlements were measured. This study also investigates how the additional settlement due to submergence is affected by various soil parameters. Nine different granular soils with wide range of variety in grain size distribution, uniformity and void ratio range were used for laboratory model study, and the results were analysed to determine the effect of different soil properties on settlement in submerged condition. Effect of fines content on settlement increment was investigated and additional settlements in loose and dense sands were compared. Particle shape parameters of the nine soils were determined by analysing microscopic images of soil grains and effect of particle shapes on additional settlement due to submergence was studied. The study undertaken has also used explicit finite difference code FLAC and FLAC3D to simulate the rise of ground water table in granular soil and the resulting additional settlement was studied. The numerical results were compared with the laboratory test data and the proposed rational method for water table correction factor prediction. Elastic, nonlinear elastic and elasto-plastic constitutive models were used to investigate the variation of water v.
(7) table correction factor with water table depth. Effect of various parameters (footing embedment depth, Poison’s ratio, finite layer thickness and layered soil system etc.) on additional settlement due to water level rise is also discussed in this study. The results obtained in this study will be valuable in understanding effect of different soil parameters and ground conditions on additional settlement that might occur as a result of water table rise. The rational method proposed herein will be useful for design engineers in predicting settlement correction factor for water table rise in granular soils. The findings from this dissertation have been disseminated through the following technical papers, technical notes, and conference papers.. 1. Shahriar, M. A., Sivakugan, N., Das, B.M. (2012a). “Strain Influence Factors for Footings on an Elastic Medium.”. Proceedings, 11th Australia New Zealand. conference on geomechanics, Melbourne, 131-136. 2. Shahriar, M.A., Sivakugan, N., and Das, B.M. (2012b). "Settlements of shallow foundations in granular soils due to rise of water table – A critical review." International Journal of Geotechnical Engineering, J Ross Publishing, 6(4), 515-524. 3. Shahriar, M.A., Sivakugan, N., Urquhart, A., Tapiolas, M., and Das, B.M. (2013a) “A study on the influence of ground water level on foundation settlement in cohesionless soil”. Proceedings of the 18th International Conference on Soil Mechanics and Geotechnical Engineering: challenges and innovations in geotechnics, Paris, 953956 4. Shahriar, M. A., Sivakugan, N., and Das, B.M. (2013b). "Settlement correction for future water table rise in granuular soils: a numerical modelling approach." International Journal of Geotechnical Engineering, Maney Publishing, 7 (2), 214217. 5. Shahriar, M. A., Sivakugan, N., Das, B.M., Urquhart, A., Tapiolas, M. (2014). “Water Table Correction Factors for Settlements of Shallow Foundations in Granular Soils.” International Journal of Geomechanics, ASCE (published online ahead of print).. vi.
(8) Contents STATEMENT OF ACCESS ........................................................................................................... ii STATEMENT OF SOURCES ....................................................................................................... iii ACKNOWLEDGEMENTS ..................................................................................................................... iv ABSTRACT...................................................................................................................................... v List of figures .....................................................................................................................................xi List of Tables .................................................................................................................................... xv List of Symbols ................................................................................................................................ xvi Chapter 1 Introduction .................................................................................................................... 1 1.1 General .................................................................................................................................. 1 1.2 Effect of Water Table Rise on Settlement .......................................................................... 2 1.3 Current State-of-the-Art ....................................................................................................... 3 1.4 Objectives and Scope of the Research .............................................................................. 6 1.5 Relevance of the research ................................................................................................... 7 Chapter 2. Literature Review ..................................................................................................... 9. 2.1 General .................................................................................................................................. 9 2.2 Settlement prediction methods for shallow footings on granular soils ........................... 10 2.3 Rise of water table and its effect on shallow foundation settlement .............................. 11 2.4 Effect of watertable on N value ......................................................................................... 14 2.5 Further Developments........................................................................................................ 17 2.5.1 Theoretical Analysis .................................................................................................... 17 2.5.2 Field Investigations...................................................................................................... 20 2.5.3 Laboratory Model Tests .............................................................................................. 22 2.6 Conclusion .......................................................................................................................... 27 Chapter 3. Strain Influence Factor Diagrams for Footings on an Elastic Medium .............. 28. 3.1 General ................................................................................................................................ 28 3.2 Strain Influence Factor Diagrams...................................................................................... 28 3.3 Derivation of Strain Influence Factor Diagrams using FLAC and FLAC3D..................... 32 3.3.1 Linear elastic analysis ................................................................................................. 32 3.3.2 Effect of Poisson’s ratio .............................................................................................. 33 3.3.3 Non-linear elastic analysis .......................................................................................... 34 3.4 Equation for Modified Strain Influence Factor Diagrams ................................................ 35 vii.
(9) 3.7 Conclusion .......................................................................................................................... 38 Chapter 4 Laboratory Modelling of Shallow Footings and the Effects of Water Level Rise on Granular Soils on Settlements................................................................................................ 40 4.1 General ................................................................................................................................ 40 4.2 Properties of granular soils used in the test ..................................................................... 40 4.2.1 Properties of soil used in settlement tank test .......................................................... 42 4.2.1 Properties of soil used in small mould test ................................................................ 42 4.3 Settlement tank test............................................................................................................ 47 4.3.1 Experimental Program ................................................................................................ 47 4.3.2 Apparatus ..................................................................................................................... 47 4.3.2 Testing Procedure ....................................................................................................... 49 4.4 Small Mould Test ................................................................................................................ 51 4.4.1 Experimental Program ................................................................................................ 51 4.4.2 Apparatus ..................................................................................................................... 52 4.4.3 Testing Procedure ....................................................................................................... 53 4.5 Scale effect ......................................................................................................................... 55 4.6 Capillary Rise ...................................................................................................................... 58 4.7 Conclusion .......................................................................................................................... 63 Chapter 5. Interpretation of Laboratory Test Results ............................................................ 65. 5.1 General ................................................................................................................................ 65 5.2 Settlement tank test............................................................................................................ 66 5.2.1 Settlement Tank Test Results .................................................................................... 66 5.2.2 Water table rise in granular soils ................................................................................ 71 5.2.3 Proposed model for determining Cw .......................................................................... 73 5.2.4 Interpretation of settlement tank test data ................................................................. 76 5.2.5 Model validation ........................................................................................................... 77 5.2.6 Additional settlement due to change in water level within the influence zone ....... 79 5.3 Cylindrical Mould Test ........................................................................................................ 80 5.3.1 Interpretation of small mould test data ...................................................................... 81 5.3.2 Relationship between Standard Penetration Number (N) and Cw,max ..................... 83 5.3.3 Effect of fines content on Cw,max ................................................................................. 84 5.3.4 Effect of void ratio range on Cw,max ............................................................................. 86 5.3.5 Effect of Volumetric Strain Potential on Cw,max .......................................................... 87 5.3.6 Soil Gradation and Water Table Correction Factor .................................................. 88 viii.
(10) 5.4 Effect of particle shape on water table correction factor ................................................. 89 5.5 Summary and Conclusion.................................................................................................. 96 Chapter 6 Numerical Modelling of Water Table Rise in Granular Soil ..................................... 98 6.1 General ................................................................................................................................ 98 6.2 Review of FLAC and FLAC3D ............................................................................................ 99 6.3 Numerical Modelling of water table rise in settlement tank in the laboratory .............. 100 6.3.1 Sensitivity Analysis .................................................................................................... 101 6.4 Comparison of Numerical and Experimental Results.................................................... 108 6.5 Comparison of the numerical and experimental results with Cw prediction method proposed in Chapter 5 ............................................................................................................ 110 6.6 Use of various constitutive models in determining Cw ................................................... 112 6.6.1 Linear Elastic Model .................................................................................................. 113 6.6.2 Hyperbolic Non-linear Elastic Model ........................................................................ 113 6.6.3 Mohr-Coulomb Elasto-plastic Model ........................................................................ 115 6.6.4 Comparison of different constitutive models ........................................................... 116 6.7 Effect of various parameters on water table correction factor ...................................... 118 6.7.1 Effect of embedment depth ...................................................................................... 118 6.7.2 Effect of Poisson’s ratio ............................................................................................ 120 6.7.3 Effect of finite layer thickness ................................................................................... 122 6.7.4 Effect of layered soil profile ...................................................................................... 126 Effect of Gibson Soil Profile ............................................................................................... 129 6.8 Summary and Conclusion................................................................................................ 131 Chapter 7 Summary, Conclusions and Recommendations .................................................... 134 7.1 Summary ........................................................................................................................... 134 7.2 Conclusions....................................................................................................................... 138 7.3 Recommendations for Future Research ........................................................................ 140 Reference ...................................................................................................................................... 142 APPENDIX A................................................................................................................................... 149 APPENDIX B ................................................................................................................................... 150 Settlement tank test result on loose dry sand ............................................................................ 150 Settlement tank test result on dense dry sand ........................................................................... 153 Settlement tank test result on loose saturated sand .................................................................. 154 Settlement tank test result on dense saturated sand ................................................................. 155 Appendix C .................................................................................................................................... 156 ix.
(11) Double tangent method applied in settlement tank tests........................................................... 156 Appendix D1 .................................................................................................................................. 159 Appendix D2 .................................................................................................................................. 162. x.
(12) List of figures Figure. Description. Page No.. Figure 1. 1 : Schematic diagram of foundation Figure 1. 2 : Water table correction factors proposed by various researchers, when Df =0 (adapted after US Army Corps of Engineers,1991). 3 5. Figure 2. 1 : Schematic diagram of foundation 13 Figure 2. 2 : Water table correction factors proposed by various researchers, (a) when Df=0, (b) when Df=0.5B, (c) when Df=B (adapted after US Army Corps of Engineers, 1991) 16 Figure 2. 3 : Water table correction factors obtained by analytical methods (adapted after Bazaraa, 1967) 18 Figure 2. 4 : Load-settlement curve obtained from field investigation by Ferreira and Da Silva (1961) 21 Figure 2. 5 : Load-settlement curve for circular plates on clayey sandy gravel in dry (solid line) and submerged (dotted line) condition (adapted after Dvorák, 1963) 21 Figure 2. 6 : Correction factor for varying water table depth from laboratory model tests of Agarwal and Rana (1987) 24 Figure 2. 7 : Settlement of 6 cm x 6 cm model footing in dry and submerged condition (adapted after Murtaza et al, 1995) 24 Figure 2. 8 : Additional settlement due to water table rise obtained from laboratory experiments by Morgan et al. (2010) 25. Figure 3. 1 : Strain influence factor diagrams- a) Schmertmann (1970), b) Schmertmann et at. (1978), c) Terzaghi et al. (1996) (adapted after Sivakugan and Das 2010) Figure 3. 2 : Strain influence factor diagrams obtained from linear elastic analysis Figure 3. 3 : Effect of Poisson’s ratio on strain influence factor diagrams- a) circular footing, b) strip footing Figure 3. 4 : Vertical strain at different loading conditions in nonlinear elastic analysis Figure 3. 5 : Comparison of derived influence factor diagrams and diagrams based on Eq. 3.11 for, a) circular footing, b) square footing (B/L = 1.0), c) Rectangular Footing (B/L = 0.75), d) Rectangular Footing (B/L = 0.50), e) Rectangular Footing (B/L = 0.25), f) strip footing. 37. Figure 4. 1 : Photographs of the granular soils used in the test with mm scale, (a)soil 1, (b)soil 2,(c) soil 3, (d) soil 4,(e) soil 5,(f) soil 6,(g) soil 5a,(h) soil 5b, (i) soil 5c Figure 4. 2 : Grain size distribution curves for the nine soils used in the model tests Figure 4. 3 : The Perspex tank used in the settlement tank test. 46 46 48. 31 33 34 35. xi.
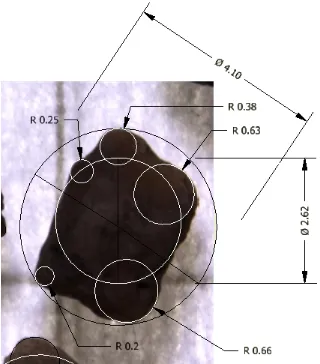
(13) Figure 4. 4 : Model footings used in the settlement tank test 49 Figure 4. 5 : Experimental setup for for settlement test in the laboratory: (a) filling the settlement tank in layers, (b) details of load and settlement measurement system, (c) experimental setup, (d) schematic diagram of the test setup. 50 Figure 4. 6 : Simulation of water level rise during the settlement tank test 52 Figure 4. 7 : Experimental setup for settlement test in the laboratory, (a) schematic diagram, (b) photograph. 54 Figure 4. 8 : Experimental setup for soil in (a) dry condition, (b) wet condition 56 Figure 4. 9 : Results of footing tests on Fuji river sand relating critical state line (adapted after Fellenius and Altaee(1994) 58 Figure 4. 10 : Grain size distribution of the soil used in settlement tank before and after sieving 59 Figure 4. 11 : Capillary test of sieved soil using Perspex tubes protruding from water 60 Figure 4. 12 : Capillary rise comparison of the sieved soil and original soil at a) 10% relative density b) 80% relative density 61 Figure 4. 13 : Variation of capillary rise of the sieved sand with time 62 Figure 4. 14 : Degree of saturation and additional effective stress with elevation above water table in unsaturated zone in dense sand after five minutes 63. Figure 5. 1 : Applied pressure vs. settlement curve for model footings resting on dry loose sand 67 Figure 5. 2 : Bearing capacity determination using double tangent method for rectangular footing (B/L=0.25) resting on dry loose sand. 68 Figure 5. 3 : Pressure-settlement plot for model footings resting on dense sand (77% relative density) in dry condition 68 Figure 5. 4 : Cw-z/B variation for dense and loose sands: from the model tests on (a) dense sand, (b) loose sand 69 Figure 5. 5 : Applied pressure-settlement test in wet tests for footings resting on a) loose sands, b) dense sands 70 Figure 5. 7 : Comparison of strain influence factor diagrams proposed in Chapter 3 to those proposed by Schmertmann et al. (1978) 72 Figure 5. 6 : (a) Schematic diagram, (b) Strain influence factor, and(c) Water table correction factor Cw 72 Figure 5. 8 : Effects of n on Cw – z variation based on proposed strain influence factors for square footings (Cw,max = 2). 74 Figure 5. 9 : Cw – z variation for different strain influence factors for square footings (Cw,max = 2, n = 1) 74 Figure 5. 10 : Variation of Aw//At of various footings with water table depth 75 Figure 5. 11 : Water table correction factor diagrams based on proposed semi-empirical equation for (a) dense sand, and (b) loose sand 77 Figure 5. 12 : Cw-z/B variation from the model tests: (a) circular footing in dense sand, (b) rectangular (B/L = 0.5) footing in dense sand, (c) circular footing in loose sand, and (d) rectangular (B/L = 0.5) footing in loose sand. 78 xii.
(14) Figure 5. 13 : Change in water level within the depth of influence 79 Figure 5. 14 : Applied pressure-settlement diagram and the application of double tangent method for Soil 3 in dense and dry state 81 Figure 5. 15 : Variation of Cw,max of soil 1 with relative density obtained from settlement tank test and small mould test 83 Figure 5. 16 : Variation of Cw,max with normalized standard penetration number (N1)60 obtained from Eq. 5.12 84 Figure 5. 17 : Effect of fine contents on Cw,max of soil 5 in loose and dense state. Inset: Cw,max vs. fines content for dense state. 85 Figure 5. 18 : Variation of Cw,max with fine contents for all soils in loose and dense state. Inset: Cw,max vs. fines content for dense state. (Soil number given alongside corresponding data point) 86 Figure 5. 19 : Variation of Cw,max ratio in loose sand to dense sand with fine contents 86 Figure 5. 20 : Change in Cw,max ratio with void ratio range 87 Figure 5. 21 : Variation of Cw,max in dense sands with void ratio range. Inset: Cw,max vs. void ratio range for emax-emin>0.2 87 Figure 5. 22 : Change in Cw,max ratio on loose sand to dense sand with volumetric strain potential. 88 Figure 5. 23 : Change in Cw,max ratio with coefficient of uniformity in uniform and well graded soils 89 Figure 5. 24 : Particle shape determination. 90 Figure 5. 25 : Optical micro-photograph of soil 2 91 Figure 5. 26 : Particle shape parameter determination method using Autodesk Inventor 2012 92 Figure 5. 27 : Effect of sphericity on a) Cw,max in loose and dense state, b) Cw,max ratio in loose state to dense state 94 Figure 5. 28 : Effect of roundness on a) Cw,max in loose and dense state, b) Cw,max ratio in loose state to dense state 95 Figure 5. 29 : Effect of regularity on a) Cw,max in loose and dense state, b) Cw,max ratio in loose state to dense state 96. Figure 6. 1 : Schematic diagram of the settlement tank used in laboratory test and in numerical modelling 100 Figure 6. 2 : Distribution of mesh density zones in FLAC 102 Figure 6. 3 : Distribution of elements in 100x25x1mesh density combination 103 Figure 6. 4 : Settlement at various mesh combinations 104 Figure 6. 5 : Variation of vertical stress at a depth 0.5B below the centreline of the footing at various mesh densities. 104 Figure 6. 6 : Radially graded mesh around brick shape used in modelling square and rectangular footings on FLAC3D 106 Figure 6. 7 : Settlement at various mesh combinations 106 Figure 6. 8 : Stress distribution below the footing due an applied load of 10 kPa for a) circular footing and b) rectangular footing, obtained from FLAC and FLAC3D, xiii.
(15) respectively. 107 Figure 6. 9 : : Comparison of percentage of additional settlement of circular footing at various water table depths obtained from numerical and experimental results on, a) dense sand, b) loose sand 109 Figure 6. 10 : Comparison of percentage of additional settlement of rectangular footing resting on dense sand at various water table depths obtained from numerical and experimental results 110 Figure 6. 11 : Comparison of proposed method and experimental results with numerical results using FLAC and FLAC3D for a) circular footing, b) rectangular footing (B/L=0.5) 112 Figure 6. 12 : Additional Settlements due to rise in water table, based on linear elastic constitutive model 113 Figure 6. 13 : Cw versus Dw /B for a circular footing on a hyperbolic non-linear elastic medium: (a) For ᶲ = 40◦and different stress levels, and (b) At same applied load (150 kPa) and different friction angles 115 Figure 6. 14 : Settlement corrections in circular footings for water table rise based on the three different soil models under working loads. 116 Figure 6. 15 : Settlement in dry and submerged soil in (a) elastic medium, and (b) hyperbolic soil model (Young’s modulus of the dry sand E = 20 MPa, Poisson’s ratio = 0.2, dry unit weight of the sand = 17.2 kN/m3, saturated unit weight = 20.1 kN/m3, and submerged unit weight of the sand = 10.3 kN/m3) 117 Figure 6. 16 : Applied pressure vs. settlement curve for different models in dry and submerged condition based on three different constitutive models 118 Figure 6. 17 : Variation of water table correction factor with normalized water table depth at different embedment depths 120 Figure 6. 18 : Variation of Cw with normalized water table depth at Df =B, based on numerical results and works by other researchers. 120 Figure 6. 19 : Variation of Aw/At with water table depth at various Poisson’s ratio 122 Figure 6. 20 : Schematic diagram of Influence factor diagram and Aw/At diagram for a footing resting on a soil underlain by an incompressible stratum. 123 Figure 6. 21 : Variation of Aw/At plot against the normalized water table depth at various values of hf 124 Figure 6. 22 : Variation of C1 and C2 with hf 125 Figure 6. 23 : Validation of Eq. 6.4 with numerical modelling results at, a) hf = 2B and b) hf = 10B 125 Figure 6. 24 : Schematic diagram of a two layered soil profile 126 Figure 6. 25 : Comparison of numerical results and proposed method of water table correction factor determination in a two layer system 129 Figure 6. 26 : Percentage of total additional settlement due to water level rise at various water level depths for different values of β 130. xiv.
(16) List of Tables Table. Description. 2.1. Equations for water table correction factors. 3.1. Values of strain influence factors at various depths for different footing shapes. 4.1. Laboratory test program for granular soils used in the tests. 4.2. Properties of sand used in settlement tank test. 4.3. Basic Soil Properties of the nine soils used in the model tests. 5.1. Aw/At values at different depths for various footing shapes. 5.2. Cw,max and Dr of the sands tested.. 5.3. Particle shape parameters of the nine soils used in the test. 6.1. Grid size, number of elements, vertical displacements and vertical stresses at 0.5B below the centre of footing in FLAC. 6.2. Grid size, number of elements and vertical displacements of the centre of footing. xv.
(17) List of Symbols β. =. Gibson modulus ratio. γ. =. Unit weight of sand. γw. =. Unit weight of water. ε. =. Axial strain. εz. =. Vertical normal strain at depth z. єv. =. Volumetric strain potential. ν. =. Poisson’s ratio. ξ. =. Regularity. σ′. =. Effective stress. σ. =. Total stress. σ 0/. =. Effective overburden pressure at footing level. σr. =. Radial stress increase due to applied load. σ 1 ,σ 2 ,σ 3 =. Principal stresses in x, y and z direction. (σ 1 − σ 3 ) max = Asymptotic value of stress difference. σz. =. Vertical stress increase due to applied load. σ v/ 0. =. Overburden pressure at the depth where peak occurs. φ. =. Friction angle. φc. =. Friction angle at zero dilation. Ψ. =. Distance from critical state line. At. =. Total area of the influence factor diagram. Aw. =. Area of the influence factor diagram that is submerged. B. =. Foundation width. C. =. Footing shape factor. C1. =. Embedment depth correction factor. C2. =. Time correction factor. Cc. =. Coefficient of curvature. Cu. =. Coefficient of uniformity. Cw. =. Water table correction factor. Cw,max =. Maximum value of water table correction factor. d50. Median grain size. =. xvi.
(18) d max −in =. Maximum/largest inscribed circle within a sand particle. d max −in =. Minimum/smallest circumscribed circle of a sand particle. d10. =. Effective grain size. Df. =. Footing depth of embedment. Dw. =. Water table depth. Dr. =. Soil relative density. emax-emin =. Void ratio range. E. =. Young’s modulus of the dry sand. E0. =. Young’s modulus of soil at the base of the footing. Ei. =. Initial tangent modulus. Ez. =. Elastic modulus of soil at depth z. EI. =. Elongation index. Fc. =. Percentage of fines content in soils. hf. =. Depth of thickness of the soil mass. IZ. =. Influence factor at depth z. K0. =. Coefficient of earth pressure at rest. l1. =. Length of major axis. l2. =. Length of intermediate axis. n. =. Curve-fitting parameter. (N1)60 =. Standard Penetration Test (SPT) number, corrected for overburden pressure. and hammer efficiency N60. =. SPT number, corrected for hammer efficiency. N. =. Field Standard Penetration Number. Nγ. =. Bearing capacity factor. q. =. Applied pressure. qc. =. Cone resistance obtained from cone penetration test (CPT). qnet. =. Net applied pressure. ri. =. Radius of curvature of the of the particle corners. R. =. Roundness. s. =. Settlement of footing. S. =. Sphericity xvii.
(19) Sr. =. Degree of saturation (%). t. =. Time (in years). za. =. Elevation above the water table in the unsaturated zone. ZI. =. Depth of influence zone.
(20) Chapter 1. Chapter 1 Introduction 1.1 General Foundations are the lowest part of a structure which transmit the load from the structure to the underlying soil or rock. They have two major classes - shallow foundations and deep foundations. Foundations having the embedment depth lesser than the breadth are called shallow foundations. When the structural load is transferred deeper into the ground by piles or drilled shafts, they are called deep foundations. Shallow foundations are usually of three types - pad, strip and raft foundations. Pad footings spread the column load uniformly into the ground, whereas strip footings carry the line load from the wall. Mat or raft foundations carry the loads from multiple columns and/or walls. Shallow foundations are the most economical, conventional foundations and are usually preferred by geotechnical engineers, when the soil conditions are suitable. There are two main considerations in the design of shallow foundations - settlement and bearing capacity. The designers have to ensure that the foundation is safe with respect to bearing capacity failure into the underlying soil, and also the expected settlements are within tolerable limits. Shallow foundations are designed for specific column or wall loads and ideally they are designed such that their expected settlement is limited to 25 mm and there is safety factor of three against possible bearing capacity failure. It is believed that settlements are more critical than the bearing capacity for most foundations in granular soils, especially when the foundation width exceeds1.5 meters (this is often the case). Settlement pattern in cohesive and cohesionless soil varies significantly. In granular soil, the settlement is almost instantaneous and there might be some long-term creep. In case of fine grained soil, settlement occurs in three stages - immediate settlement, primary and secondary consolidation settlement. Unlike cohesive soils, it is very hard to get undisturbed soil samples for granular soils, which makes the laboratory determination of soil stiffness extremely difficult. This is why in situ test results are used to get the soil stiffness in many settlement prediction methods. There are more than 40 different settlement prediction techniques available to estimate settlements of shallow foundations in granular soils, many more than for cohesive soils. These can be divided into two major categories- 1) empirical or semi-empirical methods that 1.
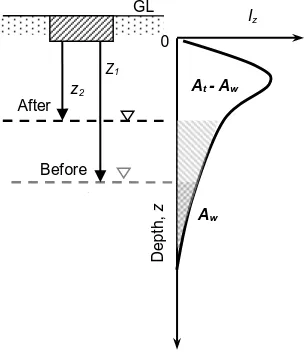
(21) Chapter 1. correlate settlements with in situ test results and 2) analytical methods based on elastic theory. In spite of all these different techniques and advancement in the computing power, the current state-of-the-art in the design of shallow foundations in granular soils remains very poor (Sivakugan and Johnson 2004). The most important factors for shallow foundation design are applied pressure, soil stiffness, and width, depth and shape of the footing. Variation in the water table depth also plays an important role. When the water table is shallow, appropriate design parameters are used to account for the lower stiffness of the soil beneath the water table. When future rise in water table is expected, due to rain, floods or seasonal changes, the foundation settlements can increase substantially and jeopardize the integrity of the structure. Terzaghi (1943) suggested that the soil stiffness (Young’s modulus) of saturated granular soil is approximately 50% of that of the dry soil, without any strong experimental evidence. Usually a correction factor for the presence of water table is used in the design of shallow foundations. Various researchers proposed various correction factors to account for water table fluctuation below the footing. A few field investigations and some small scale laboratory experiments have been conducted so far to quantify the additional settlement due to submergence in granular soils. Predicting shallow foundation settlements on granular soils involve significant uncertainties, which can further increase if the ground water level rises below the footing level. Therefore, it is important to have a rational method to predict additional settlement due to water level rise, which should be verified by comprehensive experimental results and numerical analysis.. 1.2 Effect of Water Table Rise on Settlement Shallow foundations are designed such that their expected settlements are limited to 25 mm, and the safety factor against possible bearing capacity failure is three. When the water table is close to the footing, appropriate design parameters are used to reflect the less stiff soil beneath the water table. Owing to floods, heavy rainfall or seasonal fluctuations, the water table can rise below the footing and induce additional settlements that may not have been accounted for. There are various reasons for this additional settlement. Some soils contain soluble salts that can create strong bonding with soil grains in dry state. The salt gets dissolved when submerged and this can create significant additional settlement in cohesionless soils (US Army Corps of engineers, 1990). Fine grains presented in granular soil 2.
(22) Chapter 1. create bonding with coarse grains in dry condition, which is lost when the soil is saturated. This results in additional settlement. Also, the lubrication mechanism of soil particle due to presence of water causes additional settlement (US Army Corps of engineers, 1990). However, the controlling factor for the settlement increment is the loss of soil stiffness due to saturation. Terzaghi (1943) suggested intuitively that the soil stiffness (i.e. Young’s modulus) of a saturated soil is 50% of that of the dry soil. He noted that the effective stresses within the soil, and hence the confining stresses, are reduced by 50% when the granular soil gets submerged. As a result, when water rises from very deep, and reaches the footing level, the settlement gets doubled. Fig. 1.1 shows the schematic diagram of a shallow foundation in granular soil. Throughout this thesis, the correction factor for water table, foundation width, depth of water table below the foundation and the depth of embedment of the footing are denoted by Cw, B, Dw and Df, respectively, as illustrated in Fig. 1.1.. Footing. Figure 1. 1 : Schematic diagram of foundation Very limited work has been conducted so far to study the effect of water table rise on shallow foundation settlement in granular soils. Some researchers accounted for the additional settlement due to fluctuating water table by using a correction factor, Cw, which varies with the water table height, reaching the maximum value when the water level reaches the base of the footing. The settlement calculated for dry sand is multiplied by this correction factor Cw, to get the settlement in submerged soil.. 1.3 Current State-of-the-Art The traditional approach to account for the additional settlement caused by rise in water level is to use a correction factor Cw. This is used as a multiplier to settlement in dry condition, to. 3.
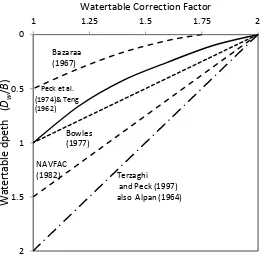
(23) Chapter 1. get the settlement in submerged condition. The value of correction factor is greater than or equal to 1 and it increases with water table rise. It is defined as: Cw =. settlement with water table below the footing level settlement in dry sand. (1.1). Various researchers used the correction factor Cw to account for the effect of rising ground water level on shallow foundation settlement (Terzaghi and Peck 1948; Teng 1962; Alpan 1964; Bazaraa 1967; Peck 1974; Bowles 1977; Department of the Navy 1982). The depth below the footing where the water table fluctuation will not have any effect is not unanimously agreed upon. The depth of embedment of the footing also affects the influence of water table on settlement, as the surcharge due to embedment increases the settlement in raised groundwater level. The different C w factors proposed by various researchers as function of the water table depth are summarised in Fig. 1.2. In all these cases, it is assumed that initially the water table is well below a depth where it can cause any effect on the settlement. Bazaraa (1967) suggested that the settlement increases by 75% when the water table rises to the footing level, and that there is no effect of the water table rise when it is at a depth greater than 0.5B below the footing. All others, in agreement with Terzaghi’s (1943) recommendation, suggested that the settlement increase would be 100%, when the water table rises from very deep to the footing level. In other words, C w becomes 2.0 when the water table reaches the footing level. The depth at which the water table rise starts influencing the settlement varies from 1B (Teng 1962; Peck et al. 1974; Bowles 1977) to 2B (Terzaghi & Peck 1967; Alpan 1964). It can be seen from Fig. 1.2 that there is considerable variation in the suggested values for C w . For example, when the water table rises to a depth of 0.5B below the footing, the suggested factors range from 1.00 to 1.75.. 4.
(24) Chapter 1. Watertable Correction Factor 1. 1.25. 1.5. 1.75. 2. 0. Watertable dpeth (Dw/B). Bazaraa (1967). 0.5. 1. Peck et al. (1974)& Teng (1962). Bowles (1977) NAVFAC (1982). 1.5. Terzaghi and Peck (1997) also Alpan (1964). 2. Figure 1. 2 : Water table correction factors proposed by various researchers, when Df =0 (adapted after US Army Corps of Engineers,1991) Various researchers have investigated the effect of submergence on settlement of shallow foundations by analytical studies, field tests and laboratory model tests. Bazaraa (1967) used settlement prediction methods proposed by Vargas (1961) and Brinch Hansen (1966) to quantify the effect of submergence, and found that the maximum value of correction factor Cw can be 1.7, when the water table reaches the footing level. Limited field investigations (Khanna et al. 1953; Ferreira and Da Silva 1961) reported in the literature show that the settlement gets doubled when the soil below the footing gets saturated,. suggesting a. correction factor of 2.0, supporting Terzaghi’s suggestion. A few laboratory experiments have been conducted so far to investigate the effect of rising water level on settlement, and contradictory results were reported. Agarwal and Rana (1987) used three square model footings in their experiments and the results suggested a correction factor of 2.0 at complete submergence, which support Terzaghi’s (1943) proposition. Three different sizes of square model footings were used by Murtaza et al. (1995) at three different soil densities, who observed significantly higher additional settlements, up to 8 to 12 times more than that in the dry sand when the sand beneath the footing is fully submerged. This implies maximum Cw values of 8-12, which are significantly higher than the values reported by the others. Morgan et al. (2001) used a single model square footing at very dense and very loose condition, and reported that the settlement increase in submerged soil can be 5.3 times 5.
(25) Chapter 1. (i.e. Cw=5.3) more than the settlement in dry condition. However, the contradictory results obtained from these small scale experiments justify the need for a systematic laboratory model study on the effects of the water table rise on the settlements of footings on sands.. 1.4 Objectives and Scope of the Research The primary goal of this dissertation is to investigate the effect of water table rise on settlement of shallow foundation resting on cohesionless soils, based on numerical modelling, comprehensive laboratory testing and theoretical analysis. The scope of the study includes the following: •. To revisit Schmertmann’s (1970) influence factors and develop strain influence factor diagrams for footings of various shapes (strip, circular, square, rectangular) using explicit finite difference codes, and the theory of elasticity.. •. To propose a rational method, based on strain influence factors and experimental results, to predict the additional settlement produced by the rise of water table on a footing resting on sands.. •. To simulate the rise of ground water table in granular soil by using explicit finite difference code FLAC and FLAC3D and study the resulting additional settlement.. •. To quantify the effect of varying footing shapes, water table depth, ground conditions and relevant soil parameters on additional settlement of footings due to submergence through laboratory modelling and numerical simulation.. The study will involve numerical modelling, laboratory modelling and theoretical analysis. While simulating the water table rise in granular soils using FLAC and FLAC3D, laboratory modelling of the footings will be performed concurrently and the results will be compared to verify the accuracy of the proposed method. The research will result in: •. Better understanding of the effect of water table rise on shallow foundation settlement resting on granular soils.. •. A rational methodology to predict the water table correction factor that will have the flexibility to account for the varying soil properties, footing shapes and water table depths.. •. Simple design charts and tables to assist the designers in selecting appropriate water table correction factors, which are based on sound fundamentals and verified by numerical and experimental results.. 6.
(26) Chapter 1. 1.5 Relevance of the research A large number of settlement prediction methods for foundations resting on cohesionless soil are available in the literature, mainly due to the difficulties involved in determining soil compressibility. Yet the current state-of-the-art for settlement prediction is very poor. This is well documented in the literature. The additional settlements produced by the rise of water table below the footing can bring in further uncertainties. Therefore, it is desirable to have some rational method for determining the additional settlements induced by the water table rise that can occur due to floods, rain fall or rise in sea level. There is no widely accepted procedure to quantify the increase in settlement due to rise in water table. Various researchers proposed correction factors for water table depth based on theoretical analysis, laboratory modelling and field test results. These factors differ from each other in magnitude and also vary with water table depth. Theoretical studies conducted by Vargas (1961), Brinch Hansen (1966b) and Bazaraa (1967) suggest that when water table rises up to the footing level, the correction factor is 1.7. A few field investigations performed by Ferreira and Da Silva (1961) and Khanna et al. (1953) suggest that the correction factor is 2.0, which support Terzaghi’s (1943) prediction. A few small scale laboratory experiments by Murtaza et al. (1995) and Morgan et al. (2010) have reported significantly higher values of correction factor. None of these investigated the effect of foundation shape on additional settlement caused by rising water level. Therefore, it is important to conduct a comprehensive laboratory experimental program to investigate the additional settlement induced by water table rise with varying footing shape, soil density and water table depth. The tests should be conducted with granular soils of various grain size distributions, representing well graded and poorly graded soils, in a wide range of grain sizes. The results can be analysed to determine the effect of different soil properties on settlement in submerged condition. Most of the past studies on settlement increment due to submergence are based on analytical and experimental results, and there is a lack of research efforts involving numerical modelling. Footings of different shapes can be modelled using FLAC and FLAC3D. Circular footing can be modelled as an axisymmetric problem and strip footing as plain strain problem in FLAC. For square and rectangular footings the problem becomes three dimensional and FLAC3D can be used. Settlement behaviour of model footings can be observed by simulating water table rise below the footings and the results can be compared with the experimental results in order to fully understand the effect of submergence on shallow foundation 7.
(27) Chapter 1. settlement. Influence of foundation embedment depth, Poisson’s ratio, finite layer thickness and other parameters can also be studied by numerical modelling.. 8.
(28) Chapter 2. Chapter 2. Literature Review. Settlements play a critical role in the designs of shallow foundations in granular soils. Future rise in water table below the foundation can produce additional settlements, which can threaten the integrity of the structure. The tolerable settlements of shallow foundations are generally small, in the order of 25 mm, and hence any such additional settlements have to be estimated with good care. A critical review of the current state-of-the-art for estimating settlements due to water table rise is presented in this Chapter. This includes analytical studies, laboratory model tests and field tests. Terzaghi’s (1943) hypothesis that settlement is doubled in granular soils when the water table rises to the ground level is supported by some analytical studies and limited field data. Laboratory model tests suggest that the settlement increase can be significantly larger, especially at higher stress-levels. 2.1 General Shallow foundations include pad, strip and raft foundations. These are often the most economical and conventional foundations that are the preferred choice of geotechnical engineers when the soil conditions are favourable. Settlements and bearing capacity are the two main considerations in the design of shallow foundations. While ensuring that the foundation is safe with respect to bearing capacity failure into the underlying soil, it is also necessary to ensure that the expected settlements are within tolerable limits. Generally, shallow foundations are designed to limit the settlements to 25 mm and to have a safety factor of at least three against bearing capacity failure. For most foundations in granular soils, it is believed that settlements are more critical than the bearing capacity, especially when the foundation width is greater than 1.5 meters, which is often the case. Settlement of a structure is not a big concern when the entire structure settles evenly. But if differential settlement occurs, that is, the adjacent footings experience a considerable difference in settlement values, there is a serious threat to the structure. The differential settlements can be controlled by limiting the total settlements of the various isolated footings that support the columns and walls. In case of shallow foundations in granular soils, the most important factors that govern the settlements are the applied pressure, soil stiffness, and the dimensions including the width, depth and shape of the footing. Variation in the water table also plays an important role as it 9.
(29) Chapter 2. causes fluctuation in the settlement of the shallow foundations. The soil below the water table has less stiffness, and this induces additional settlement. The groundwater level can rise up to or beyond the footing level, due to flood or rain, causing substantial additional and unforeseen settlements which can exceed the tolerable limits. The N value from standard penetration test (SPT) is used widely by geotechnical engineers for settlement prediction. Rise of water table also affects the blow count in SPT in granular soils. There is no widely accepted procedure to quantify the increase in settlement due to the rise of water table. Terzaghi (1943) intuitively proposed that the stiffness of granular soil reduces to half as it gets saturated, which in turn doubles the settlement. When the watertable rises to some depth below the footing, a correction factor for the new location of watertable is used in the design of shallow foundations. Various researchers (Terzaghi 1948; Teng 1962; Alpan I. 1964; Bazaraa 1967; Peck 1974; Bowles 1977; Department of the Navy 1982) proposed correction factors to quantify the additional settlement due to the watertable rise below the footing. These correction factors are multiplied by the settlement in dry sands, to get the settlement in submerged sands. These correction factors differ from each other in magnitude and also vary with water table depth reaching the maximum value when the water table reaches the foundation level. Limited field investigations suggest that submergence of granular soil doubles the settlement when compared to dry condition, agreeing with Terzaghi’s proposition. However, only limited laboratory studies have been conducted so far (Agarwal and Rana 1987; Murtaza et al. 1995; Morgan et al. 2010), and contradictory results have been found showing that the settlements increase by 12 times due to submergence. The extensive laboratory model tests carried out by the author in this dissertation also support these findings. These are critically reviewed in this Chapter. 2.2 Settlement prediction methods for shallow footings on granular soils In the design of shallow foundations, two major criterions are taken into consideration bearing capacity and settlement. When the foundation breadth is more than 1.5 m, settlement becomes more important than bearing capacity. Settlement of shallow foundations has two major components - elastic settlement and consolidation settlement. If the foundation is resting on granular soils, only the elastic settlement needs to be considered. In case of granular soil, it is very hard to get undisturbed soil sample which creates difficulty in determining the compressibility of the soil mass. This is why a large number of settlement prediction methods are available in the literature for footings on sand, much more than for 10.
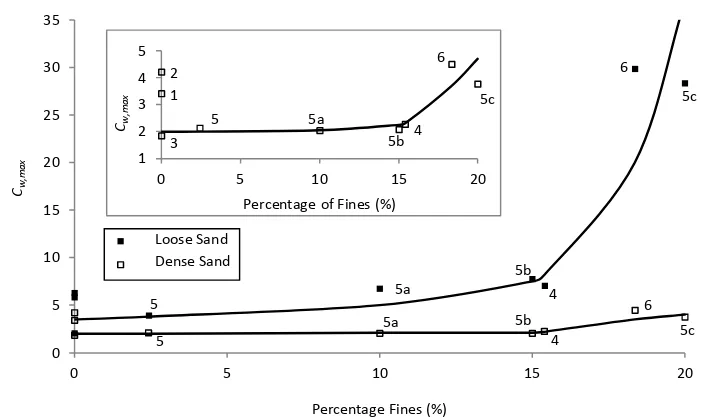
(30) Chapter 2. clays. Douglas (1986) reported 40 different settlement prediction methods for cohesionless soil. These can be classified in two general categories: 1. Empirical or semi-empirical methods based on observed settlement of structures. These methods correlate settlement with various in situ tests, for example, standard penetration test (SPT), cone penetration test (CPT), dilatometer test, etc. 2. Methods that use theoretical relationships obtained from the elastic theory. Methods of this category use the Young’s modulus to predict foundation settlement. Some of the most popular settlement methods were proposed by Terzaghi and Peck (1967); Schmertmann et al. (1978); Burland and Burbidge (1985); Berardi and Lancellotta (1994); Mayne and Poulos (1999). These methods were reviewed by Das and Sivakugan (2007) who also listed the empirical correlations that can be used for determining the soil stiffness. The settlement prediction exercise carried out in Texas in 1994 clearly demonstrated the inadequacy in the current state-of-the-art for settlement predictions of footings in sands (Briaud and Gibbens 1994). Here, 31 international experts were given soil data from a very extensive laboratory and in situ testing program, and were required to predict the column loads that would produce 25 mm and 150 mm settlements of the five footings prior to the load test. The predictions were quite poor, with significant difference between the predicted and actual loads. Settlements predicted by the different methods have been compared by Jeyapalan and Boehm (1986); Tan and Duncan (1991); Papadopoulos (1992); Berardi and Lancellotta (1994); and Sivakugan et al. (1998). The general observation is that most of the settlement prediction methods are conservative and hence overestimate the settlements and underestimate the allowable bearing pressures. Noting the uncertainty associated with the different methods, Sivakugan and Johnson (2004) proposed probabilistic design charts that can be used with some settlement prediction methods. These charts quantify the probabilities that the actual settlements can exceed specific values. Some researchers tried to develop settlement prediction methods using artificial neural network (Sivakugan et al. 1998; Shahin 2003). 2.3 Rise of water table and its effect on shallow foundation settlement Rise of water table in cohesionless soil causes additional settlements. This can be attributed to various reasons. Some soils have soluble salts which, due to their ionic nature, create 11.
(31) Chapter 2. strong bonding with the soil grains when dry. Rise in water table makes the salt get dissolved and the bonding is lost. This might create large additional settlement in loose granular soils (U S Army Corps of Engineers 1990). Presence of fines in granular soil mass can induce additional settlement when the water table rises. These fines create bonding with coarse grains in dry state, which is lost when they are saturated. Moreover, the lubrication mechanism of soil grains by water can result in additional settlement (US Army Corps of Engineers 1990). Another important reason for the increased settlement is the loss of capillary tension when the granular soil gets saturated. Capillary tension exists in partially saturated soil that exist above the water table. This causes an apparent cohesion in the granular soil mass, increases the effective stress and hence the shear strength. When the water table rises, the capillary suction is lost and additional settlement occurs (US Army Corps of Engineers 1990). But the most important cause for the additional settlement is the loss of soil stiffness which is described in the following section. Terzaghi and Peck (1948) suggested that settlement of a footing in sand depends on initial tangent modulus of soil (slope of the initial straight segment of the stress-strain curve) and increases with the decrease in the tangent modulus. As the initial modulus depends on the confining stress and confining stress is roughly proportional to effective vertical stress, it can be said that the soil modulus changes with change in effective vertical stress. In the presence of water table, the effective stress reduces roughly to half when compared to the dry condition, which in turn lowers the soil stiffness (elastic modulus) to half. Hence, the settlement gets doubled. Meyerhof (1956, 1965) noted that Terzaghi and Peck (1948) settlement calculation method is conservative and hence the correction for the presence of ground water table is not necessary. He also suggested that the effect of water table is already reflected on the value of the field standard penetration number N, and that is why further correction is not required. But if the water table rises after the determination of N value, there might be a significant increase in settlement value. Peck and Bazaraa (1969) also supported Meyerhof’s (1965) view about correction for water table, but they recognised the existence of field evidence of doubling the settlement due to water table rise to the footing level. They suggested that, when the water table rises into the influence zone in the vicinity of the foundation, the settlement on dry soil should be multiplied by the following factor 12.
(32) Chapter 2. Cw =. σ 0 in dry sand σ 0/ in submerged sand. (2.1). where, σ 0 = total overburden pressure at 0.5B below the footing base. σ 0/ = effective overburden pressure at 0.5B below the footing base Burland and Burbridge (1985) proposed a settlement prediction method based on the statistical analysis of 200 settlement records of foundations, tanks and embankments on granular soil. In majority of the cases, water table was close to the foundation level. Among those, a few cases were noted where significantly larger settlement occurred when compared with the dry sand. Burland and Burbridge (1985) carried out a statistical analysis on 15 cases where the depth of water table was more than five meters, and found that their settlement was only about 13% less when compared to the complete data set. Another analysis was carried out on 24 plate load tests where water table was deeper than the depth of B below the plates. It gave 25% less settlement value than the best estimate of all settlement records. Based on these, Burland and Burbridge (1985) concluded that there is no statistically significant effect of the water table depth on settlement value. But it does not mean that there is no effect of water level rise on settlement. While the presence of water table is reflected on the value of the field standard penetration number N, any future rise in water table can still cause significant increase in settlement.. Figure 2. 1 : Schematic diagram of foundation. Various researchers have taken into account the effect of water table on foundation settlement in their settlement estimation methods. Usually, the effect is reflected as a correction factor 13.
(33) Chapter 2. C w which is greater than 1. The correction factor is used to multiply the settlement calculated in dry condition to get the settlement in submerged condition. It is not unanimously agreed on the depth below which the rise in water table will have no effect on settlement. Generally it is taken as one to two times the width of the footing below the base of the footing. Depth of embedment also influences the effect of water table on settlement. The surcharge due to embedment results in increasing the settlement caused by water table fluctuation. In this thesis, the water table correction factor, foundation width, depth of embedment and water table depth will be denoted by C w , B , D f and Dw ,respectively (as shown in Fig. 2.1). Table 2.1 summarises the correction factors ( C w ) proposed by various researchers, and some of these are also shown graphically in Fig. 2.2 for D f / B = 0, 0.5 and 1. 2.4 Effect of watertable on N value The N value from standard penetration test is widely used in many settlement prediction methods. Hence, it is important to understand the effect of water table on the N value. The soil stiffness gets reduced when the soil gets saturated from dry state. Water lubricates the soil grains which reduce the intergranular shear resistance and increases slip potential. Also the apparent cohesion caused by capillary suction which contributes to the measured resistance, gets lost upon saturation. These affect the blow count in SPT test.. 14.
(34) Chapter 2. Table 2.1: Equations for water table correction factors Reference Teng (1962). Equation for Water table Correction Factor, C w Cw =. 1 < 2.0 for water at end below footing Dw − D f 0.5 + 0.5[ ] B. base Alpan (1964). C w = 2.0 − 0.5(. Terzaghi and Peck (1967). Cw = 2 −. Bazaraa (1967). Peck, Hanson and Thornburn (1974). Bowles (1977). NAVFAC(1982). Agarwal and Rana (1987). Cw =. Cw =. Dw ) for Dw = D f (approximately)>1.0 B. Dw (for surface footings) >1.0 2B. γ / ( D f + B / 2) no water γ / ( D f + B / 2) water present 1 Dw 0.5 + 0.5[ ] Df + B. Cw = 2 −. >1.0. Dw >1.0 Df + B. Cw = 2 −. Dw − D f 1.5B. C w = 1.95 − 0.57. >1.0. Dw >1.0 B. 15.
(35) Chapter 2 Watertable Correction Factor. 1. Watertable dpeth (Dw/B). 0 0.5 1. 1.25. 1.5. 1.75. 2. Bazaraa (1967) Peck et al. (1974)& Teng (1962). Bowles (1977) NAVFAC (1982). 1.5. Terzaghi and Peck (1997) also Alpan (1964). 2. (a). 1. Watertable Correction Factor 1.2. 1.4. 1.6. 1.8. Watertable Correction Factor 1. 2. 0. 0.5. Bowles. Footing Level. (1977) Peck et al. ( 1974). Teng (1962). NAVFAC (1982). 1. Watertable Depth. Watertable Depth(Dw/B). Bazaraa (1967). 1.2. 1.4. 1.6. 1.8. 2. -1. -0.5. Bazaraa (1967). -0.5. 0. Footing Level. Bowles (1977). . 0.5. Peck et al.. (1974). Teng (1962). NAVFAC (1982). 1. 1.5. (b). (c). Figure 2. 2 : Water table correction factors proposed by various researchers, (a) when Df=0, (b) when Df=0.5B, (c) when Df=B (adapted after US Army Corps of Engineers, 1991) Schultze and Menzenbach (1965) and Bazaraa (1967) have shown that submergence has little effect on N value in the case of coarse granular soil. However, there are contradicting observations for fine and silty sands. Terzaghi and Peck (1948) suggested reducing the N value for dense submerged fine or silty sand by the following, 𝑁𝑁 ′ = 15+ 0.5(N-15), when N>15. (2.2) 16.
(36) Chapter 2. This was contradicted by the laboratory test results of Gibbs and Holtz (1957) and Schultz and Melzer (1965). They investigated the effect of submergence on dynamic penetration value in very fine sands and observed that the penetration value gets substantially reduced in submerged sands. A large scale SPT test above and below the watertable was conducted by Bazaraa (1967) and he concluded that the N value for all fine and silty sands should be corrected by the following which is applicable for any value of N, 𝑁𝑁 ′= 0.6N,. (2.3). Burland and Burbridge (1985) conducted statistical analysis with 8 cases of submerged fine and silty sands. Applying correction for N value suggested by Terzaghi and Peck (1948) gives better results, whereas applying Bazaraa’s correction yields poorer compressibility assessment. Hence, based on the limited evidence, Burland and Burbridge (1985) concluded that Terzaghi and Peck (1948) correction gives better assessment of foundation subgrade compressibility.. 2.5 Further Developments In addition to the above semi-empirical multiplication factors provided by various researchers, there were few more rational analytical studies as well as field and laboratory model tests. These are discussed in this section. 2.5.1 Theoretical Analysis Vargas (1961) proposed a method to describe the settlement behaviour of Brazilian sand. The method assumes that the elastic modulus of soil ( E z ) at any depth z depends on the vertical and radial stresses at that point by: Ez =. (σ z − σ r ) = α ( K εz. 0. .γz + σ r ). (2.4). where, σ z = vertical stress increase due to applied load. σ r = radial stress increase due to applied load ε z = vertical normal strain at depth z 17.
(37) Chapter 2. α = a constant which varies with soil type K 0 = coefficient of earth pressure at rest. γ = unit weight of sand The settlement (s) of soil mass can be obtained by integrating the vertical strain ε z in Eq. 2.4, which gives:. s=. 1. ∞. σ z −σ r. α ∫ K .γz + σ 0. 0. dz. (2.5). r. Figure 2. 3 : Water table correction factors obtained by analytical methods (adapted after Bazaraa, 1967) Bazaraa (1967) used the method proposed by Vargas (1961) to study the effect of submergence on granular soil. He assumed the pressure on a circular footing resting on ground surface varies as a function of foundation width. Moreover, the pressure was chosen in such a way that it matches those of the buildings in Brazil and sufficient safety factor was maintained against bearing capacity failure. The vertical and radial stress changes were calculated using elastic theory assuming the Poisson’s ratio as 0.3. The settlement values were calculated for different positions of water table below the foundation and the values are shown in Fig. 2.3. It was found that the settlement increases approximately by 70% when the water table rises up to the footing level.. 18.
(38) Chapter 2. Brinch Hansen’s (1966b) method can also be used to quantify the effects of submergence. This method requires the values of some constants that can be obtained from oedometer and triaxial tests. Brinch Hansen proposed that the vertical strain ε 1 of sand can be obtained from general stress-strain relationship by using following equations:. ε 1 = f (σ 1 + σ 2 + σ 3 ) s (1 + C12 + C13 ). (2.6). be r (1 + 2 K o ) s (1 + 2 K 0 K c ). (2.7). f =. K 0 = 1 − sin φ. (2.8). K c = tan 2 (450 +. (m − 1) K c C12 =. φc. ). σ1 σ2. σ1 − 1) σ2. (m − 1) K c. σ1 σ3. m −1 d13n. d13 = (cos ecφ − 1)(. φ = sin −1 (. (2.9). (2.10). m −1 d12n. d12 = (cos ecφ − 1)(. C13 =. 2. σ1 − 1) σ3. σ1 −σ 3 ) σ1 + σ 3. (2.11). (2.12). (2.13). (2.14). where, σ 1 ,σ 2 ,σ 3 are principal stresses, φc is the friction angle at zero dilation and s, b, r, m, n are constants. These constants depend on soil type, and Brinch Hansen (1966b, 1966a) gave the values for Asnoes sand in Denmark (s = 0.46, b = 2.6, r = 2.25, m = 4.5, n = 2). Bazaraa (1967) considered a surface tank resting on semi-infinite soil medium having similar properties as Asnoes sand and investigated the effect of water table rise on settlement. The tank was assumed to be circular with a diameter of B (m) and subjected to a pressure of q 19.
(39) Chapter 2. (kN/m2) = 1.57B. Additional settlement due to water table rise was calculated using Brinch Hansen’s method (1966b) for various positions of water table. The result also exhibits that settlement in submerged condition is 1.7 times the settlement in dry condition as shown in Fig. 2. 3. 2.5.2 Field Investigations There are limited data available on field investigation of settlements in submerged and dry conditions. Khanna et al (1953) conducted some plate loading tests on square plate having an area of 928 cm2 embedded to 0.305 meter. The tests were conducted in dry and rainy periods. The results indicated that submergence increases the settlement to around 2.1 times in case of sandy loam, and 1.4 times for coarse gravelly soil. Ferreira and Da Silva (1961) conducted three plate loading tests on marine sand in Angola. The first test was conducted on sand at natural moisture content in dry weather (curve “a” of Fig. 2.4). The second one was carried out at the same natural moisture content for up to 98.07 kPa and then in submerged condition for higher loads (curve “c”). The last test was run on submerged sand (curve “b”). The results reveal that the submerged condition reduces the bearing capacity significantly and causes 2.5 times more settlement when compared to the natural moisture content. Moreover, the comparison of curve “a” and “b” indicates that the additional settlement due to submergence is much higher at high footing pressures. Ferreira and Da Silva (1961) have found iron and aluminium compounds in that soil which broke down in submerged condition and contributed to additional settlements.. 20.
(40) Chapter 2. Figure 2. 4 : Load-settlement curve obtained from field investigation by Ferreira and Da Silva (1961). Figure 2. 5 : Load-settlement curve for circular plates on clayey sandy gravel in dry (solid line) and submerged (dotted line) condition (adapted after Dvorák, 1963) Dvorák (1963) conducted plate loading tests on clayey sandy gravel. The soil was composed of more than 60% gravel and the rest was clayey sand. He used a square plate measuring 21.
(41) Chapter 2. 0.707 m X 0.707 m and carried out tests in dry and submerged condition. Fig. 2.5 shows the results of the tests. The solid line shows the load-settlement curve for dry soil, and the dotted line is the curve for submerged soil. The settlement in submerged sand was approximately 2.2 times than of the dry sand. In general, these limited field investigations suggest that submergence almost doubles the settlement in granular soil, supporting Terzaghi’s (1943) proposition. Bazaraa (1967) collected some field investigation data for situations where the sand was partially submerged. However, these failed to give any clear picture on the effect of water table rise at different depths. 2.5.3 Laboratory Model Tests Agarwal and Rana (1987) investigated the effect of water table on foundation settlement in sand and proposed an equation for water table correction. In this series of model tests, settlement under a given load was measured for different depth of water table underneath the footing. They conducted tests on square footings of size 20 cm x 20 cm, 15 cm x 15 cm and 10 cm x 10 cm. The sand used was poorly graded, air dried and was deposited to dry unit weights of 15.5 kN/m3 and 15.7 kN/m3. Uniform density throughout the layer was ensured by applying rainfall method. First, an initial settlement of a specific value was applied on the footing placed on dry sand, which was followed by gradual rise of water table from the bottom of the tank up to the base of footing, and the increment in settlement was observed. A correction factor C w was proposed which is the ratio of settlement value at different water table level to the settlement on a dry soil. Fig. 2.6. shows the variation of water table correction factor at different water table depths ( Dw ). The data points plotted in Fig. 2.6 were fitted along with the line of best fit given by: C w = 1.95 − 0.57. Dw B. (2.15). The equation shows that the settlement increases by a factor of 1.95 when the water table rises up to the footing level. The correction factor is 1.67 when Dw = 0.5 B and 1.38 when Dw = 1.0 B. These experimental findings support Terzaghi’s (1943) proposal that the settlement doubles when water table rises to the base of the footing and that the increase is linear. 22.
Figure
+7
Related documents
2 Percentage endorsement rates for items from the DISCO PDA measure stratified by group ( “substantial” PDA features, “some” PDA features and the rest of the sample).. N
Political Parties approved by CNE to stand in at least some constituencies PLD – Partido de Liberdade e Desenvolvimento – Party of Freedom and Development ECOLOGISTA – MT –
Most companies recruit for full-time and internship positions, but some indicate Co-Op as a recruiting priority, while not attending Professional Practice
In the previous sections, we dis- cuss the expectation that a neural network exploiting the fractional convolution should perform slightly worse than a pure binary (1-bit weights
• Taxpayers subject to the provisions of Title II of the Income Tax Law (ITL) which have declared taxable income of $644,599,005 or more in the immediately preceding tax
This model posits four types of health beliefs that affect an individual’s health behavior, in this case, the decision to seek mental health services: perceived
Specifically, we tested whether emotional responses would be less positive, and more negative, toward wearers of any Muslim veil compared with those wearing no veil (Hypothesis 1);
The government co ll ect s revenue f rom taxes on capital and labour income and value-added taxes on fina l demand , production taxes on intermediate inputs, and...
