Subscriber Research Series 2015-16
An Impact Study of the Guidance
Documents for Higher Education Providers
Published by QAA in 2013
Subscriber Research Series 2015-16
In 2014-15, following a call for expressions of interest open to its subscribers, QAA
commissioned six small-scale primary research projects intended to encourage collaboration between providers and promote the formation of communities of practice.
This report is an impact study of the guidance documents for higher education
providers published by QAA in 2013. It was submitted to QAA by Dr Anesa Hosein from
theUniversity of Surrey and Dr Namrata Rao from Liverpool Hope University.
The reports are not QAA documents, so we have respected the authors' approach in terms of style and presentation. We hope that you will read them with interest.
Other topics in the series are the transition experiences of entrants to higher education from increasingly diverse prior educational experiences; and the role of student satisfaction data in quality assurance and enhancement.
For more information, and to read other reports in the series, visit:
Contents
Foreword ... 1
Executive summary ... 2
Key findings ... 2
Introduction ... 4
The study ... 5
Methodology ... 5
Sampling frame ... 6
Analytical framework ... 7
Phase 1: Documentary survey ... 7
Phase 2: Interviews ... 10
Results ... 10
Phase 1: Documentary survey ... 10
Phase 2: Interviews ... 15
Findings ... 16
Foreword
This study was commissioned to review the impact of the guidance1 documents published
by the Quality Assurance Agency for Higher Education (QAA) in 2013, as a result of a cross-sector consultation, initiated by the Higher Education Public Information Steering Group (HEPISG). The stimulus for the guidance was the funding changes introduced in September 2012, which increased undergraduate tuition fees to £9,000 per year, supported by student loans.
The suite of publications (covering class size, student workload, staff teaching qualifications, and responding to feedback from students) was intended to help providers ensure that transparent and helpful information is made available to current and prospective students about teaching methods and learning opportunities, to inform their choice of what and where to study. It was intended to be used to complement the Indicators and Expectations of the relevant chapters of the UK Quality Code for Higher Education (particularly Part C) and relates to information about provision published on providers' websites and in their promotional material; as distinct from the Key Information Set (KIS) required by the Higher Education Funding Council for England (HEFCE), the Higher Education Funding Council for Wales (HEFCW) and the Department for Employment and Learning in Northern Ireland (DELNI).
Public information is now of even greater significance since the publication of the
Competition and Markets Authority (CMA) guidance in March 2015, and the proposals of the BIS Green Paper in November 2015, Fulfilling our Potential, Teaching Excellence, Social Mobility and Student Choice, regarding the introduction of a Teaching Excellence Framework (TEF).
It is, therefore, timely to consider the progress made to date by higher education providers in ensuring that students have detailed and transparent information available to them about the learning experience on offer, before making decisions about their investment in education.
QAA would like to thank Ansa Hussein from the University of Surrey and Narmada Rao from Liverpool Hope University for their research, which has contributed to the evidence base of this report.
Ian Kimber
Director of Quality Development QAA
1 Note: The guidance was compiled by a working group that included representatives of the following sector
Executive summary
The aim of this research was to investigate and assess the impact of the four guidance documents for higher education providers published by QAA in August 2013. The intention of the guidance (which was the product of extensive consultation with sector organisations) was to offer support to providers in making detailed and transparent information available to current and prospective students, particularly in relation to informing student choice.
The study examines how the online information differs, taking account of the following factors:
discipline differences
size of the institution
students' perception of the programme quality (as denoted by Question 22 of the National Students' Survey (NSS).
The overarching research question, to be explored through the use of documentary surveys of 38 university websites and interviews with eight universities, was:
To what extent have various HEIs used the guidance documents to disseminate relevant information to prospective students?
The results revealed a variation in the extent of information present on class size, student workload and teaching qualifications, in relation to discipline differences, the size of the institution, and students' perception of the quality of the programmes.
While the QAA guidance documents have emphasised the importance of HEIs providing sufficient information for prospective students to enable them to make an informed choice regarding their higher education, the responsiveness of the universities surveyed in adopting the recommendations would appear to be variable and, at times, formulaic.
While the interview data suggests that the guidance did not have a significant impact on the provision of information by universities, the website survey data indicate that some of the recommendations of the QAA guidance have been implemented by many of the institutions.
Key findings
The variation in information provided was found to be maximal with quality scores in the NSS, where institutions with high quality scores provided more information on their websites.
The variation between disciplines was found to be largely insignificant, except in subject areas where the availability of specialist facilities and resources is an important component of the learning experience. For example, biological sciences, where the information presented was more extensive.
The study indicates that, in general, the institutions surveyed appear to be doing well in providing information on the details of the 'facilitators of learning for the various types of delivery methods used' (lectures, seminars and laboratories, and so on).
The results indicate that only one fifth of the institutions surveyed provided some information on the class size for the various types of delivery methods (lectures, seminars and laboratories, and so on). However, the data suggests that a higher proportion of institutions with high quality scores in the NSS presented this information.
Introduction
This research analyses the impact of the four QAA guidance documents whose intended outcome was to provide more transparent and helpful information on the learning and teaching (L&T) opportunities in higher education programmes to both current and
prospective students. These QAA guidance documents were published in 2013 and are as follows:
Explaining Staff Teaching Qualifications: Guidance about Providing Information for Students2
Explaining Class Size: Guidance about Providing Information for Students3
Explaining Student Workload: Guidance about Providing Information for Students4
Responding to Feedback from Students: Guidance about Providing Information for Students.5
HEIs were expected to use these guides to discern the types of information (for example teaching and learning methods, support and contact time, learning opportunities and workload) desired by their students via their websites, prospectuses, definitive programme documents and/or open days and to use the UK Quality Code for Higher Education, Part C: Information about Higher Education Provision as a guide on where this information should feature. The L&T information was also expected to be distinct from the KIS, which is a requirement of the Higher Education Funding Council for England (HEFCE) for prospective students. The KIS dataset is used to provide comparable standardised information on HEI websites that are drawn from the National Student Survey (NSS) (Davies et al, 2010). Hence, information provided by KIS may not necessarily cater for the diverse information needs of the students. KIS also provides limited information on aspects of L&T processes such as class size, pedagogical approaches used, student workload and so on, though these educational processes may be of particular interest to prospective students. Further, one of the drawbacks of KIS is that it is based on data provided by final year students reflecting on their experiences of the past three years rather than the current situation for those joining the first year of the degree. For these reasons, current institutional changes are best communicated through institutional websites and/or prospectuses rather than league tables, which would normally be based on past performance (Briggs, 2006).
The sources of information accessed by prospective students in their decision-making have been extensively researched (see, for example, Ball and Vincent, 1998; Hutchings, 2003; Slack et al, 2014; Pampaloni, 2010). Websites have been found to be one of the most influential sources of information for students in higher education decision-making (Pampaloni, 2010; Schimmel et al, 2010). For example, Slack et al (2014) found that 95 per cent of students access university websites and prospectuses. Therefore, this impact study focused primarily on the L&T information provided for prospective students on university websites.
The study
Having recognised the importance of information on websites, it is important we consider how far the information needs of the students are being met over and above that provided by the KIS. Further, it is misleading to presume that the mere presence of the information in certain areas can ensure its consistency. We contend that there might be variation in the level of this information across various programmes within an institution. Further, we propose that the efficiency of dissemination of this information depends on the size of institution; that is, large institutions with a large number of programmes may find it more difficult to have a consistent dissemination strategy across the institution.
Considering that the QAA guidance documents are associated with enhancing student access to L&T information, it is probable that HEIs who are committed to their L&T are more likely to adopt this guidance. As suggested by Gibbs (2010), L&T information is of particular importance to the students in decision-making, hence it is probable that students from such institutions are more likely to have made well-informed choices and are more satisfied with the quality of their programme. Therefore, we argue that universities that demonstrate greater adoption of the QAA guidance are more likely to register higher quality scores.
The present study intends to identify whether students have access to sufficient L&T
information via university websites which they can critically assess to make informed higher education choices. To enable assessment of the provision of L&T information on university websites, the adoption of QAA guidance documents has been taken as a measure. Possible patterns in L&T information variance with subject, institutional size and with
perceived difference in the quality of L&T are explored to provide a deeper understanding of the variations in the dissemination of L&T information among HEIs with the view to help institutions to address any inconsistencies.
To this end the overarching research question was:
To what extent have various HEIs used the guidance documents to disseminate relevant information to prospective students?
The key sub-research questions were:
1 To what extent can prospective students find programme/course level L&T information recommended by the QAA guidance documents on the University websites?
2 How far is the L&T information consistent within the HEI across programmes? a Does the L&T information vary between HEIs depending on their sizes? b Does the L&T information vary between HEIs depending on the perceived
quality of their programmes?
3 Is HEI-wide related information clearly signposted for the student, for example, institutional strategy for feedback and proportion of teaching qualified staff? 4 To what extent can the L&T information be attributed to the guidance documents?
Methodology
The study involved a documentary survey of university websites to include online
prospectuses, HEIs' L&T strategy, and staff websites and programme pages. Four analytical frameworks were drawn (see Table 1) based on the criteria from the QAA guidance
Sampling frame
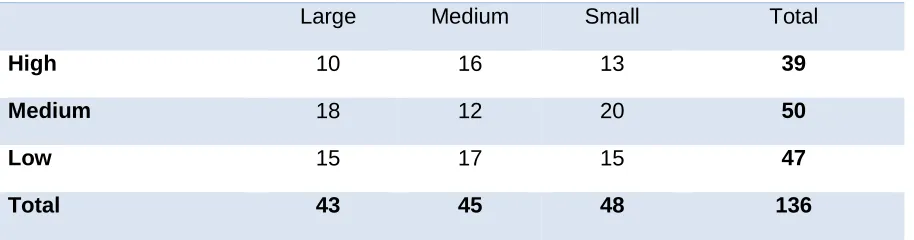
The size of the university was determined by the total enrolment at undergraduate level. The 2013-14 Higher Education Statistics Agency (HESA) statistics were based on the number of student enrolments for each of the 168 higher education providers. HEIs were then partitioned into small (≤9,500), medium (9,501-15,000) and large (>15,000) institutions depending on the number of enrolled students. The range of number of students was determined by using tertiles, that is to say the 168 institutions were partitioned into three equal parts of 1/3, 2/3 or 3/3 percentiles.
The quality of programmes in HEIs was approximated using Question 22 in the NSS, which measured students' perception of the overall quality of the programme. The 2014 NSS data for institutions were downloaded from HEFCE. The students' perception of the aggregated score of overall quality of programmes at the HEI was used. This dataset had 266
institutions and included further education colleges. Institutional names from the HESA statistics and the NSS data were matched for a total of 152 institutions. Institutions that had less than 1200 students were removed (16 in all); these were mainly specialised colleges such as for Arts, Music and Agriculture. The cut-off number was determined by the smallest university, the University of Buckingham, which had 1260 students. This left 136 HEIs (see Table 1). The HEIs were also partitioned into tertiles based on their overall quality scores into: high (>88 per cent), medium (>84 per cent to 88 per cent) and low
(≤84 per cent). A chi-square test showed that there were no differences in the distribution (χ2 (4) = 3.38, p =0.50). The chi-square statistical test was used, as it appeared that a large
number of institutions were in the medium tertile for the NSS.
A stratified random sampling method was then used to select universities. Nine groups of universities were created depending on their size and overall quality (three sizes x three quality codings). Two degree programmes, Sociology and Biological Sciences, common to most HEIs and representative of Social Science/Humanities and Sciences and Engineering were selected to determine consistency of L&T information within the HEI. When shortlisting the programmes to be included in the sample, only undergraduate full-time courses that fell under the broad umbrella term of Sociology and Biological Sciences were included. Where Sociology and/or Biological Sciences were not available, allied subjects such as Natural Sciences and Human Sciences were considered. These subjects could constitute the whole degree or could form part of a degree in combination with another subject.
Table 1: Total distribution of universities based on size and students' perception of the quality of programmes
Quality (as determined by NSS Q22)
Size
Large Medium Small Total
High 10 16 13 39
Medium 18 12 20 50
Low 15 17 15 47
Total 43 45 48 136
Table 2: Sample distribution of the 38 universities
Quality (as determined by NSS Q22)
University Size
Large Medium Small
High 4 5 4
Medium 4 4 4
Low 4 4 5
Analytical framework
Using the four QAA documents, an analytical framework was developed to determine whether the information as advised in these guidance documents was present on the
university websites. The criteria extracted from the QAA documents are presented in Table 3 along with explanations of what these criteria refer to.
Phase 1: Documentary survey
Table 3: Document criteria used in the analytical framework
Document/criteria Comment
Class size
Class Size (for lectures, seminars, labs)
Learning Experiences of Pedagogical Approach
In what ways are teaching and learning facilitated (for example interactive sessions,
quizzes, group work etc.)
Responsibility of Student as Partner
Indication of the responsibility of the student in their learning
Facilitators of Class (lectures,
seminar, labs)
Indication of who will take the classes (could be a named person or an indication of a person, for example a
postgraduate student, an experienced lecturer)
Support of Learning How learning is supported by availability of resources and/or within different types of
class sizes
Staff teaching
Proportion of Staff with Teaching Qualifications
Either be referred to FHEA, SFHEA; lecturers having a PGCert in Teaching and Learning; or PGCert in Academic Practice - this may be university-wide rather than at programme level
Staff Qualification at Programme Level
Qualifications of the staff (including MA, PhD, FHEA etc.) teaching on the programme/course on the programme page - this may be more general rather than specific, for example staff on this programme hold PhDs, MA and FHEA
Staff Qualification on Webpages
If staff qualifications are located on staff webpages (providing that they have indicated which staff will be teaching specific programmes)
Learning Experiences Provided by
Range of Staff
Indication of the learning and teaching experiences provided by a range of staff (such as librarians,
technicians, visiting lecturers, computer support staff) i.e. what do they provide to help the student learn?
Student workload
Expected Academic Support:
type and amount
Type and amount of support available to students
(for example reading of drafts, one-to-one tutorials, online support including VLEs)
Persons providing academic support
Document/criteria Comment
Methods of teaching, learning
and assessment
The range of learning and teaching methods that the student is likely to encounter including lectures, seminars, supervision etc. and the range of assessments including project work, essays etc.
Expected amount of contact time
Amount of time student can expect to interact with the member of staff (could either be
face-to-face or virtual)
Ways in which learning is supported by resources and specialist facilities
The workload that students should anticipate
The amount of hours required for studying on the programme, additional information such as hours for assessments etc., lectures, independent study
Responding to feedback from students
This may be found at the programme or wider university level such as the L&T strategy, or a document on student feedback or evaluations.
Student feedback obtained at module level
Mechanism for feedback/evaluation
Students provided with appropriate time to response to evaluations
Publish responses of module evaluations
Student satisfaction data forms part of internal review process
Phase 2: Interviews
In Phase 1, the data only concerned whether a user was able to find the information. However, it was possible that the information was present but the research student was unable to find the information. For this reason, interviews were followed up on a selection of universities to triangulate the data and to act as a verification method. The interviews were also used to determine the extent that universities were aware of the QAA guidance. The interviews were intended to be with quality assurance/ enhancement personnel as they were considered to be those most likely to be aware of the quality documents and the procedures that occur in their university.
Quality assurance/enhancement personnel were contacted from 30 of the 38 universities. Eight universities were not contacted because in six of the universities a quality
assurance/enhancement personnel contact could not be found and the remaining two were the pilot universities originally used. Of the 30 universities contacted, only eight accepted to do the interviews (see Table 4 for distribution). Of the remaining 22 universities, there was no response from nine, seven asked for more information but had no further contact, a further two declined without providing a reason, three declined because of upcoming reviews at their institutions and revamping their programmes based on the expected CMA
regulations for higher education, and one withdrew after initially accepting because of concentration on CMA regulations.
Of the eight universities which accepted, four quality assurance/enhancement personnel were interviewed and the remaining four were from a variety of roles related to marketing, learning and teaching, student engagement and admissions.
Table 4: Distribution of interviews based on size and quality of the university
Size/ Quality High Medium Low
Large 2 1 1
Medium 1 1
Small 1 1
Results
The results in this section are reported based on the phases of the data collection: that is, into the documentary survey of the websites and the interviews.
Phase 1: Documentary survey
The documentary survey of the 38 HEIs was completed using the analytical framework for evaluating the presence of information on the websites as advised by the QAA guidance documents. The data was analysed based on the degree programme, size and perception of quality of the programmes at the HEIs, which are now discussed.
Overview of L&T information provided on the university websites
The presence of information from all four QAA documents across the programmes, university size and quality coding is provided in Table 5.
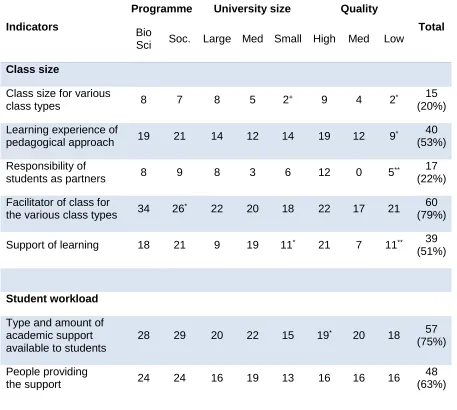
was present on the website. However, the HEIs were more forthcoming in providing information regarding 'facilitator of class for the various class types' (79 per cent).
Information on 'learning experience of pedagogical approach'(53 per cent) and 'support of learning' (51 per cent) was found in only about half of the HEIs.
At least two-thirds of the universities presented information on all parameters of student workload except the 'expected contact time', which was provided only on the websites of about one-third (36 per cent) of the surveyed universities. Information on 'methods of teaching, learning and assessment' was most commonly cited (91 per cent).
At least one-third of the HEIs presented information on all teaching qualification parameters. However, information on 'proportion of staff with recognised teaching qualifications at
institutional level' in comparison to national level data was not included by any of the 38 surveyed HEIs.
[image:14.595.72.529.353.763.2]Although 50 per cent of the HEIs indicated that they obtained feedback/evaluation from the student at the module level, only about 37 per cent of the HEIs appeared to have a programme or university-wide mechanism for obtaining this information with only 5 per cent indicating that they published the responses of the evaluations.
Table 5: Presence of information across the 76 programmes (two programmes x 38 universities) for the four QAA documents
Indicators
Programme University size Quality
Total
Bio
Sci Soc. Large Med Small High Med Low
Class size
Class size for various
class types 8 7 8 5 2
+ 9 4 2* 15
(20%)
Learning experience of
pedagogical approach 19 21 14 12 14 19 12 9
* 40
(53%)
Responsibility of
students as partners 8 9 8 3 6 12 0 5
** 17
(22%)
Facilitator of class for
the various class types 34 26
* 22 20 18 22 17 21 60
(79%)
Support of learning 18 21 9 19 11* 21 7 11** 39
(51%)
Student workload
Type and amount of academic support available to students
28 29 20 22 15 19* 20 18 57
(75%)
People providing
the support 24 24 16 19 13 16 16 16
Indicators
Programme University size Quality
Total
Bio
Sci Soc. Large Med Small High Med Low
Methods of teaching, learning and
assessment used
34 35 21 25 23 24 22 23 69
(91%)
Expected contact time 13 14 10 8 9 16 5 6** 27
(36%)
Resources and specialist facilities used to support learning
34 17 15** 18 18 22 14 15+ 51
(67%)
Anticipated student
workload 28 28 18 19 19 18 21 17
56 (74%)
Teaching qualifications
Proportion of staff with recognised teaching qualifications at institutional level
0 0 0 0 0 0 0 0 0
(0%)
Staff qualifications at programme/course level Qualifications of the teaching staff
16 17 7 13 13 11 16 6** 33
(43%)
Staff qualification on staff profiles on the university website
20 15 7 12 16+ 12 16 7* 35
(46%)
Range of staff providing the learning experience
13 13 9 10 7 15 2 9** 26
(34%) Responding to feedback from students Student feedback obtained at module level
19 19 15 13 10 12 14 12 38
(50%)
Mechanism for
feedback/evaluation 13 15 9 12 7 9 10 9
Indicators
Programme University size Quality
Total
Bio
Sci Soc. Large Med Small High Med Low
Students provided with appropriate time to respond to evaluations
7 7 2 8 4 4 2 8 14
(18%)
Publish responses of
module evaluations 2 2 2 2 0 4 0 0
* 4
(5%)
Student satisfaction data forms part of internal review process
15 16 11 10 10 8 10 13 31
(41%)
Indication on how student feedback enhances the learning experience
6 6 4 6 2 6 2 4 12
(16%)
Significance Level for Groupings in criteria: +: p<0.1; *: p<0.05; ** p<0.001
Consistency in L&T information across Biological Sciences and Sociology
When comparing the consistency of the level of information across the two programmes for the four categories of L&T information, two patterns of variations were apparent. Firstly, in Biological Sciences the information for the class size parameter 'facilitator of class for the various class types', was found to be higher than that in Sociology (p=0.02). While information for Biological Sciences was present on most HEI websites (90 per cent), only two-thirds of HEIs presented information (68 per cent) for Sociology. Secondly, we found statistically significant difference in information on the student workload parameter 'resources and specialist facilities'(p<0.01) between Biological Sciences (90 per cent) and Sociology (45 per cent). No significant differences were found in other parameters across the other four L&T information categories.
Consistency in the L&T information with size of HEIs
With regard to the variation in information based on size of the HEI, medium-sized
universities tended to present more information in comparison to large and small-sized HEIs for the class size parameter 'support of learning' for 'class size for various class types' (p=0.02). Similarly, significant variations were found in the level of information on student workload parameter 'type and amount of academic support available to students'where information in large (83 per cent) and medium-sized (85 per cent) universities on amount and type of academic support was much higher in comparison to small-sized (58 per cent) universities (p=0.04). However, information on other parameters of the analytical frameworks for class size and student workload did not show significant variation with size of the
Consistency in L&T information between HEIs depending on perceived quality of programmes
Variation in information on class size parameters with variation in quality scores of the HEIs was compared. Universities with high quality scores generally presented the highest amount of information. Although the level of information present in all HEIs was not high in general, significant variation was found in 'class size for various class types' with change in the levels of quality scores (p=0.05). Even though the information was present for only a third of the universities with high quality scores (35 per cent), it was around five times the information presented by universities with low quality scores (8 per cent) and twice that of the information presented by universities with medium quality scores (17 per cent).
Significant differences were found in the information present in'the learning experiences of various pedagogical approaches' (p=0.02) across the HEIs. Universities with high quality scores presented significantly higher information (73 per cent) in comparison to those with medium (50 per cent) and low (35 per cent) quality scores. Information on 'responsibility of students as partners' was also found to show significant variation where universities with high quality scores were more likely to emphasise this. While HEIs with high quality scores presented this information in about half the cases (46 per cent), this was absent in all HEIs with medium quality scores and was present only in a fifth (19 per cent) of HEIs with low quality scores (p<0.01). No significant difference was found in the levels of information on 'facilitator of class for various class types' for the HEIs with different levels of quality scores. A significant difference was found in 'support of learning' provided to the students by the HEIs (p<0.01). The majority of the HEIs (81 per cent) with high quality scores presented this information on their websites. Surprisingly, HEIs with low quality scores presented more information (42 per cent) in contrast to HEIs with medium quality scores (29 per cent).
Evaluation of the variation in information on student workload in HEIs with different quality scores revealed that the amount of information on'expected contact time' presented by HEIs with a high quality score was significantly higher (62 per cent) in comparison to HEIs with medium (21 per cent) and low (23 per cent) quality scores (p<0.01). No significant
differences were found in other student workload parameters.
Significant differences were found in HEIs with various levels of quality scores in all parameters of teaching qualifications except for information on proportion of 'staff with recognised teaching qualifications at institutional level' in comparison to national level data, which was not presented on the websites of any of the 38 HEIs.
Two-thirds of the universities with medium quality scores provided information on 'staff teaching qualification at programme level' (p<0.01) and on the 'staff qualifications on staff profiles on the university websites' (p=0.02) (67 per cent each) followed by approximately half of the universities with high quality scores (42-46 per cent). Information on 'staff
teaching qualification at programme level' and on the 'staff qualifications on staff profiles on the university websites' was present in only about a quarter of the HEIs with low quality scores (23 per cent and 27 per cent respectively).
HEIs with high quality scores provided most amount of information on 'range of staff providing the learning experience'(p<0.01, 58 per cent) in comparison to universities with medium (8 per cent) and low quality scores (35 per cent).
Finally, with regard to the last QAA document Responding to Feedback from Students: Guidance about Providing Information for Students, there was low presence of this
Phase 2: Interviews
The extent that L&T information can be attributed to the guidance documents
The interviews were revealing on the extent that personnel were aware of the four QAA documents. Half of the universities were not aware that the four QAA documents existed. Three of these institutions were surprised that they had not come across the documents previously. However, two of them indicated they were relatively new to their roles, starting within the last 18 months. Considering that the documents were recently published (in the last two years), the lack of awareness of these documents among the quality assurance personnel, suggests the limited dissemination of these documents within the institutions. The remaining two participants suggested that the reason for it was that it did not
come through their normal QAA dissemination routes as they were not quality
assurance/enhancement personnel. Of these four institutions, three of the institutions
indicated had they known about the documents they were likely to have used them to inform their decisions. However, one institution indicated that they found the documents unhelpful as they were not structured in a format they could circulate to their departments and articulate explicitly what information to include on their websites.
Of the other four participants who had heard of the documents, one indicated they did not look at the documents closely, one indicated they found only one document, the 'response to feedback' when they were searching about how to handle evaluations in their university and the final two disseminated through their usual channels of university boards with only one university ensuring that the information was incorporated into their dissemination of information for their prospective students.
HEI-wide related information clearly signposted to the prospective student
The interview data indicated that although in several cases our student researcher did not find the data present, the interviewees indicated that the data was there, particularly on dealing with responses to feedback and staff data. However, the data may not be explicitly linked to the programmes or was only available to current students through their intranet. One institution indicated that while the data could be found by prospective students, it probably was not clearly signposted. Another institution indicated that they were likely to put up some of this information on social media and YouTube, as their research suggested that prospective students were more likely to use these outlets for making judgements about the programme. All institutions did note that, based on the research, it raised issues on how they made information available to the students and ensured that the information is clearly
Findings
While the QAA guidance documents have emphasised the importance of HEIs providing sufficient information for prospective students to enable them to make an informed choice regarding their higher education, the responsiveness of the universities to adopt these recommendations and guidance has been variable and at times formulaic. The HEFCE-prescribed KIS has been adopted universally, but the attempts to provide additional information to aide prospective students in decision-making have been patchy as indicated by our study. Recruitment of ill-informed students, whose expectations from the course may be disengaged from the reality, would perhaps lead to consequent student dissatisfaction and would hinder their academic progress (Ozga and Sukhnandan, 1997).
In this study, a combination of content analysis and interview methods was used to assess the adequacy and the impact of the QAA recommended L&T information provided on the university websites. The results revealed a variation in the extent of information present on class size, student workload and teaching qualifications for the two programmes, with the size of the university and the levels of students' perception of the quality of the programmes. The main findings are:
1 Findings suggest that the QAA documents have not had a significant impact on how universities provide information for students. However, the quantitative data indicates that across most HEIs, some of these practices have been implemented. One of the reasons for this is that most of the universities indicated that how they determine what information they placed onto their websites were based on looking at their competitors' websites and ensuring similar information was available for their prospective students. It is therefore possible (but not measurable from this study) that the HEIs were learning from other institutions that had used the QAA documents to influence the information they have placed on their websites. For example, the only HEI which filtered down the QAA information was an institution known for its good practice with students (according to the interviewee) and it is likely other institutions were looking at this institution to set the standard. 2 The variation in information was found to be greatest with quality scores, where
HEIs with high quality scores presented more information. The high quality scores could be related to the presence of information on websites.
3 The variation with subject was found to be largely insignificant except in areas of resources and availability of specialist facilities. The information presented here was higher for Biological Sciences as information on aspects such as the presence of well-equipped laboratories can have significant influence on student learning and is therefore of interest to students.
4 Our results indicate that only one-fifth of the surveyed HEIs provided information on the class size for the various class types (lectures, seminars and laboratories). Closer inspection of the data suggested that a higher proportion of HEIs with high quality scores presented this information.
5 The teaching staff have a profound impact on the learning experiences of the students. Gibbs (2012) emphasised that it is important for the students to be aware of who does the teaching; whether they are full-time, part-time or hourly paid staff and whether they have teaching qualifications. This may have an impact on the quality of students' learning experience and as beneficiaries of HIM they are entitled to have access to this information. The results of our study indicated that
universities in general appear to be doing well in providing information on the details of the 'facilitators of the class for the various class types' (lectures, seminars and laboratories).
students about teaching qualifications of their teaching staff. Despite the importance placed on the teaching qualifications of the staff as emphasised by the
recommendations of the White paper (BIS, 2011) and in the QAA guidance
document Explaining Student Workload: Guidance about Providing Information for Students (2013), the findings of our study indicated a complete lack of this
information at institutional level and limited presence of this information at course and individual staff profile level. This may imply that either the academic staff may not have the desired teaching qualifications or the university still places more emphasis on research over teaching. Considering the importance students place on teaching qualifications of their teachers, HEPI (2015) has even recommended that KIS should be revamped to incorporate this information. Institutions that place heavier emphasis on research and administrative achievement, may risk the neglect of teaching (Gibbs, 2012).
7 Chickering and Gamson (1991) identified in their study 'faculty contact time' as one of the 'seven principles of Good Practice in undergraduate education'. Our study indicated a consistently high amount of information on student workload irrespective of the subject, size of the HEI and their quality scores. Expected contact time with the tutors was the only aspect of the student workload information, which had limited presence on the websites. However, universities with high quality scores presented significantly higher information even on the expected contact time. The views on the information about the importance of the amount of contact time for students are variable. Gibbs (2010) contends that the number of class contact hours on their own has little to do with educational quality but what happens with those hours determines quality. The Open University in spite of having the lowest class contact hours has high quality scores. Therefore, the contact hours at institutional level might not be of much value to the students on their own. However, the amount of hours spent in various L&T activities like lectures or seminars might be of particular importance for students (BIS, 2011).
References
Ball, S J and Vincent, C (1998) 'I heard it on the grapevine: 'Hot' knowledge and school choice'. British Journal of Sociology of Education, 19, no 3: 377-400
BIS (2011a) 'Higher Education: Students at the Heart of the System'
Briggs, S (2006) 'An exploratory study of the factors influencing undergraduate student choice: the case of higher education' Studies in Higher Education, 31 (6), 705-22
Chickering, A W and Gamson, Z F (1991) Applying the seven principles for good practice in undergraduate education. San Francisco: Jossey-bass
Davies, P, Hughes, A, Mangan, J, Slack, K, Renfrew, K, Baird, H and Green, H (2010)
Understanding the Information Needs of Users of Public Information About Higher Education,Bristol: Higher Education Funding Council for England
Gibbs, G and Coffey, M (2004) The impact of training of university teachers on their teaching skills, their approach to teaching and the approach to learning of their students, Active Learning in Higher Education, 5 (1), 87-100
Gibbs, G (2010) Dimensions of Quality York: Higher Education Academy
Gibbs, G (2012) Implications of Dimensions of Quality York: Higher Education Academy
HEPI (2015) Student Academic Experience Survey: Summary and recommendations. York: Higher Education Academy (accessed on 9 August 2015)
Hutchings, M (2003) 'Information, advice and cultural discourses of higher education' in
Higher education and social class: Issues of exclusion and inclusion (ed) Archer, L, Hutchings, M and Ross, A, 97-118 London: Routledge Falmer
Nasr, A, Gillett, M and Booth, E (1996) Lecturers' teaching qualifications and their teaching performance. Research and Development in Higher Education, 18, pp 576-81
Ozga, J and Sukhnandan, L (1997) Undergraduate non-completion in higher education in England Bristol: Higher Education Funding Council for England
Pampaloni, A M (2010) The influence of organizational image on college selection: what students seek in institutions of higher education Journal of Marketing for Higher Education, 20 (1) 19-48
QAA (2013a) Explaining Class Size: Guidance about Providing Information for Students, available at: www.qaa.ac.uk/publications/information-and-guidance/publication/?PubID=74
QAA (2013b) Explaining Staff Teaching Qualifications: Guidance about Providing Information for Students, available at:
www.qaa.ac.uk/publications/information-and-guidance/publication/?PubID=75
QAA (2013c) Explaining Student Workload: Guidance about Providing Information for Students, available at:
www.qaa.ac.uk/publications/information-and-guidance/publication/?PubID=84
QAA (2013d) Responding to Feedback from Students: Guidance about Providing Information for Students, available at:
Schimmel, K, Motley, D, Racic, S, Marco, G and Eschenfelder, M (2010) The importance of university web pages in selecting a higher education institution Research in Higher
Education Journal, 9(1): 1-16
Slack, K, Mangan, J, Hughes, A and Davies, P (2014) 'Hot', 'cold' and 'warm' information and higher education decision-making British Journal of Sociology of Education, 35(2), 204-23
QAA1390 - Nov 15
© The Quality Assurance Agency for Higher Education 2015 Southgate House, Southgate Street, Gloucester GL1 1UB
Tel: 01452 557 000