• No results found

Measuring disadvantaged pupils’ attainment gaps over time (updated 29th January 2015)

N/A
N/A
Protected

Academic year: 2019

Share "Measuring disadvantaged pupils’ attainment gaps over time (updated 29th January 2015)"

Copied!
23
0
0

Loading.... (view fulltext now)

Full text

Loading

Figure

Figure 1: Key stage 2 headline attainment gap for 2012-20143
Figure 2: Key stage 4 headline attainment gap for 2012-2014
Figure 3: “Barcode” illustration of the Disadvantaged Pupils Attainment Gap Index
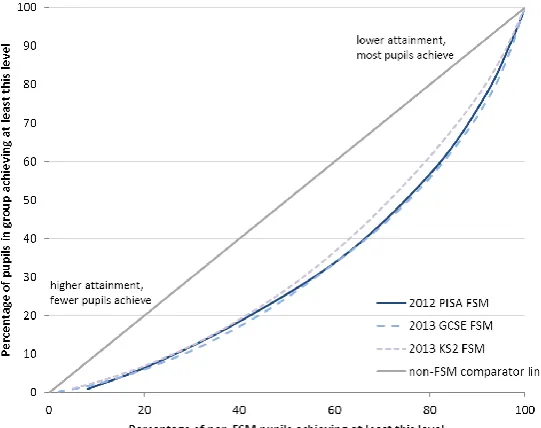
Figure 4: Lorenz Curve “banana” chart of the Disadvantaged Pupils Attainment Gap Index (at KS4)
+4

References

Related documents