This is the
Accepted Version
of a paper published in the
journal International Journal of Human Factors Modelling
and Simulation:
Paul, Gunther, Pendlebury, Jonathan, and Miller, Jason (2012) The contribution of seat components to seat hardness and the interface between human occupant
and a driver seat. International Journal of Human Factors Modelling and Simulation, 3 (3/4). pp. 378-397.
The contribution of seat components to seat
hardness and the interface between human occupant
and a driver seat
Gunther Paul†, Jonathan Pendlebury‡, and Jason Millerⱡ
† Queensland University of Technology, School of Public Health and Social Work, Brisbane, Qld, Australia
‡ Ford Motor Company Australia, Melbourne, Vic, Australia [email protected]
ⱡ Futuris Automotive Interiors Pty Ltd, Port Melbourne, Vic, Australia [email protected]
Abstract: Effective digital human model (DHM) simulation of automotive driver packaging ergonomics, safety and comfort depends on accurate modelling of occupant posture, which is strongly related to the mechanical interaction between human body soft tissue and flexible seat components. This paper comprises: a study investigating the component mechanical behaviour of a spring-suspended, production level seat when indented by SAE J826 type, human thigh-buttock model hard shell; a model of seated human buttock shape for improved indenter design using a multivariate representation of Australian population thigh-buttock anthropometry; and a finite-element study simulating the deflection of seat cushion foam, underlying suspension and the seat frame when loaded by a 95th percentile occupant. The results of the three studies provide a description of the mechanical properties of the driver-seat interface, and allow validation of future dynamic simulations, involving multi-body and finite-element (FE) DHM in virtual ergonomic studies.
Keywords: digital human model (DHM); anthropometry; driver posture;
Biographical notes:
Gunther Paul has studied Engineering and Ergonomics at TU Darmstadt in Germany, where he received a Masters degree in Mechatronics and a PhD in Ergonomics. After working in research and academic teaching at TU Darmstadt for five years, he joined a leading global OEM in the automotive industry in 1999. He remained in product development, information technology and manufacturing engineering functions in the automotive industry in Germany and France until 2009. Gunther then moved to Australia, where he established a laboratory and research group in Ergonomics at the University of South Australia, funded by the automotive industry’s collaborative research centre (AutoCRC). He is now Senior Lecturer for Occupational Safety, Health and Ergonomics at Queensland University of Technology. Gunther is co-chairing the IEA technical committee for human simulation and virtual environments and is specializing in biomechanical, digital human modeling.
1
Introduction
Seat interface pressure
Seat safety functions and seat comfort are crucial attributes for designing a seat (Van Hoof, van Markwijk, and Verver, 2004), and quite often a tradeoff can be found, as for example anti-submarining performance vs. comfortable posture (Andreoni et al., 2002). To analyze posture as a key component of static comfort, physiologic methods, landmark coordinate measurements or pressure maps are employed. Pressure mapping as the standard method for investigating static comfort (Siefert, Pankoke, and Wölfel, 2008) at the seat body interface however has not always delivered useful results in the past. While Kyung and Nussbaum (2008) studied the associations between three subjective ratings (overall, comfort, and discomfort) and 36 measures describing driver–seat interface pressure, and reported correlations between (1) lower pressure ratios at the buttocks and higher pressure ratios at the upper and lower back, (2) balanced pressure between the bilateral buttocks, (3) balanced pressure between the lower and upper body and overall / comfort ratings (rather than discomfort ratings), Gyi and Porter (1999, p.99), when analysing the technique of interface pressure measurement found that a “clear, simple and consistent relationship between interface pressure and driving discomfort” could not be identified and Kolich, Seal, and Taboun (2004) reported that given the current state of technology, with impractical and obtrusive pressure sensors influencing the measurement, seat-interface pressure measures are difficult to establish, which was supported by Paul, Daniell, and Fraysse (2012). Porter, Gyi, and Tait (2003) later repeated that for three cars, no clear relationship was found between interface pressure data and reported discomfort. Despite these findings, Kolich and Taboun (2004) presented a multiple linear regression model relating seat interface pressure characteristics to occupant data and subjective perceptions of seat comfort to a comfort index, on the basis of reliable pressure measures.
Seat cushion models
ranging between 120-285 N (foam density 43-65 kg/m3), does not represent the hardness of a foam pad found in a seat. Polyurethane (PU) foam is typically the major constituent of automotive seat pads, and exhibits highly nonlinear behaviour under normal operating conditions. Efficient design requires not only an understanding, but also a good model of such foam behaviour (Widdle Jr., Bajaj, and Davies, 2004).
It should be noted that the material property ‘foam stiffness’
𝑘 =𝐸𝑡 (1) (where k: foam stiffness; E: Young’s modulus; t: thickness of material) is called either ‘foam hardness’ when measured according to ISO 2439 (or indentation load deflection, ILD; where foams are compressed by a 200 mm diameter circular plate at 10 cm/min) or ‘foam firmness’ when measured according to ASTM D3574 (or indentation force deflection, IFD; in which a circular flat indenter of area A= 323 cm2 presses on a slab of foam, typically of thickness 100 mm and area 500 mm by 500 mm, supported on a flat table, perforated with small holes to ease air flow). The 25% IFD result also does not necessarily correlate with the seating stiffness for true load application, as the foam can creep. Foam selection criteria are low resilience and creep, and testing with a buttock form is advised (Mills, 2007). To be compatible with human soft tissue, open cell foams of the order of 20 kPa are used in automotive seats. This coincides with findings by Paul (2004), where comfortable, local pressures of drivers were found at values between 5-14 kPa, measured at a seat height H30 (SAE J1100) of 300mm and independent of driving conditions in a simulated environment.
Seat design however depends on customer preferences. In Germany harder seats are used, with smaller static compression strains than in the UK. The Japanese market uses foams with high energy dissipation and moderate strength, and the North American market uses foams with low energy dissipation, while the European market is intermediate. In upscale car seats, the cushion often sits on a mechanical spring suspension. While in cheaper and lighter seats, the foam cushion provides the majority of the deflection and changes shape significantly under load, the force–deflection relationship of a suspended seat is more linear (Mills, 2007).
Human modeling
et al. (2009) assumed (a) initial isotropy, (b) local homogeneity and (c) time-invariant (i.e. non-viscoelastic) material behaviour, and used a Mooney–Rivlin hyperelastic material model. In a very detailed extension of the H-Model™, Konosu (2003) also stressed the importance of modelling the pelvic joints (sacroiliac joint, pubic symphysis) and strain rate dependency of pelvic components (e.g. tibial cartilage, sacro-iliac ligaments) for improved kinematics performance. In a synthesis of the THUMS and H-Model™ for vehicle crash simulation, Murakami et al. (2004) developed a model which represents an average US adult male in a driving posture. As physical geometry, mechanical characteristics and joint structures were replicated as precise as possible, the total number of nodes reached about 67,000 and the model has about 1,000 materials. As usual, parameters were derived from cadaver tests though, and although muscle-tendon function is included in the model, this provides opportunity for further development.
Unlike FEM models, which are able to investigate both contact and the interaction between occupant and the seat, but require many parameters to be defined, an accurate meshing algorithm and lengthy computations, multibody models allow to monitor the three dimensional kinematic behaviour of a virtual dummy. They simulate different postures and model human body properties, requiring the definition of only a small set of parameters. Moreover, the interaction with a vehicle can be described using lumped parameters. As the computational demand is reasonable, multibody simulations can easily handle various percentiles of occupants. However, a multibody model cannot investigate pressure distribution (Pennestrì, Valentini, and Vita, 2005). In addition to soft tissue material parameters, the geometric shape of thighs and buttocks need to be considered in both physical and analytical models. Such a model, based on multibody techniques and arbitrary surfaces attached to rigid bodies, was developed by Verver et al. (2005).
Only one study was found (Tuttle, Barrett, and Gass, 2007) which investigated seated buttock contours of Australians. A contour measurement device was developed and used to measure buttock contours of senior Australian high-school students in five sitting postures. Buttock contours were quantified by constructing anterior–posterior (AP) and lateral profiles from which six discrete profile dimension measurements were made. AP and lateral profiles were found to have a consistent shape across all participants. Five out of six profile dimensions were significantly different between genders, with just one significantly different between sitting postures.
In summary,
• Seat interface pressure is difficult to measure reliably, and although simulations are on a promising pathway, models still require significant work to achieve a level of specification and confidence required for comfort predictions.
• Seat cushion models have reached a good level of detail and assurance for the foam component. The contribution of the seat suspension to its dynamic behaviour, and the interaction between foam and seat suspension, have not been dealt with so far.
• Human FE models still require significant work in all areas, especially validity (i.e. representation of a general population), material properties, and geometric properties.
2
Methods
• identify the reaction parameters of a suspension type seat under human-like hard shell indentation;
• model human thigh and buttock geometry for a selected Australian population
• and simulate occupant-seat interaction in a finite-element model.
Suspension seat parameter identification
To measure force-deflection behaviour of a suspension type seat within industry specification (75mm), Ford engineering specification CETP 01.10-L-401 was applied. Measurements were taken at the Ford of Australia material testing laboratory in Geelong.
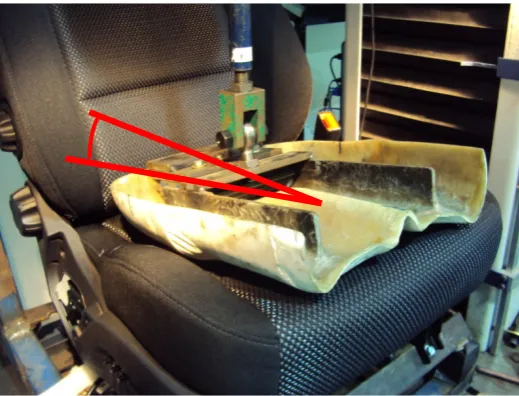
[image:9.595.169.429.380.578.2]The indenter was mounted to the testing rig so that the loading centre of the indenter was at the centre of the swivel joint. A fibreglass SAE AM50 type buttock form (Ford engineering test procedure CETP-01.10-L401 for seat cushion hardness testing; 450mm (l) x 370mm (w)) was attached and suspended from the indenter so the upper surface of the form, at rest, was on a 10° inclination from horizontal (Figure 1).
Figure 1: Positioning of an indenter form relative to seat at 10 deg. from horizontal
Representative Australian production level seats were used for testing. The seat was tested according to following positional rules:
Seat track set at mid-travel
Cushion height at mid-travel. Where possible adjusted from both front and rear
Humidity 50% +/- 10%
Seats were pre-conditioned and tested in an un-deflected and undistorted state. H-point was determined according to produces outlined in SAE J826. Manikin legs were not applied. Force was zeroed at preload and the form impressed the seat cushion at constant velocity (5 mm/s) until a force of 950N was applied. The indenter was then fully retracted. Force was recorded between 0-950 N with a precision of 10-4 N, and deflection was recorded with a precision of 10-5 mm. All measurements were repeated and averaged.
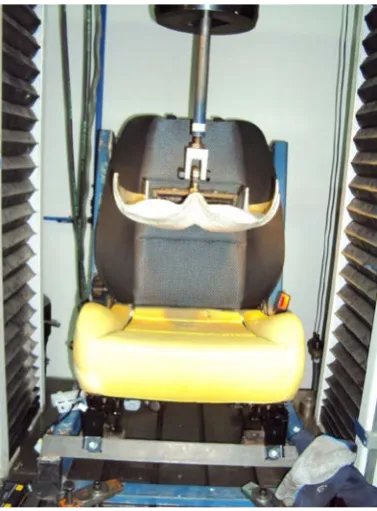
[image:10.595.203.392.351.607.2]Measurements were taken on a fully trimmed seat (Figure 1), on a seat with trim removed (foam on suspension) (Figure 2), on the seat suspension only (Figure 3), on the foam pad only (Figure 4) and on a foam pad with an intermediate neoprene layer, simulating a soft matter indentation (Figure 5). This latter measurement was also compared to an identical measurement on a non-contoured foam block of similar foam hardness.
Figure 3: Indentation on seat suspension with foam and trim removed
Figure 4: Indentation on foam pad only (no seat)
[image:11.595.189.407.522.688.2]Human geometric model
The data used for modelling thigh and buttock geometry were taken on three subjects, using a whole-body three-dimensional scanner. The scanner used for this study was the Vitus Smart (Kaiserslautern, Germany) whole-body laser scanner. An individual scanned using the Vitus Smart scanner will on average yield 700,000 to 1 million voxels that correspond to the surface of the scanned body. The three thigh-buttock forms produced are representative of the following percentiles using internal data from an Australian anthropometric study:
5th percentile female 50th percentile male 95th percentile male
Height and weight were not the measurements used to classify subjects as a representation of these percentiles. The measurements used were ‘hip breadth’ (seated) and ‘buttock-to-knee length’. These measurements provide a better representation of the variation in buttock/thigh shapes that would be encountered in automotive drivers.
The database used to determine the percentiles represents the general population of a Western population (n=857; 432f/425m). No recent data accurately represent the general Australian population. The bivariate percentiles of the combined hip breadth (seated) and buttock-to-knee length distributions (Table 1) used in this study closely represent the selected Australian and the US population, assuming that Australia is now reaching the same levels of overweight and obesity as the US.
Table 1: Anthropometric measurements of three subjects, representing three bivariate percentiles.
Subject Hip breadth
(seated) (cm)
Buttock-to-knee length (cm)
5th percentile female 32.0 52.0
50th percentile male 34.5 60.4
95th percentile male 39.1 67.0
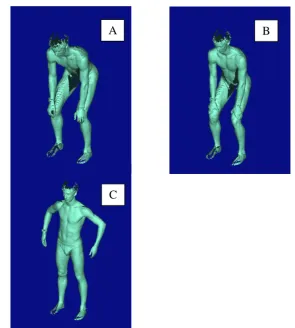
Each subject was scanned twice in three postures while wearing form fitting underwear. The subject was required to be in the following positions (Figure 6):
Feet shoulder width apart with knees bent and the torso flexed at the hip to create a 110 degree angle between the torso and legs. Standing straight, feet shoulder width apart
Figure 6: Example of 50th percentile male scanned with: (A) Feet shoulder width apart, knees bent and torso flexed at the hip for 90 degree angle between the torso
and legs, (B) Feet shoulder width apart, knees bent and torso flexed at the hip for 110 degree angle between the torso and legs, (C) Standing straight, feet shoulder
width apart
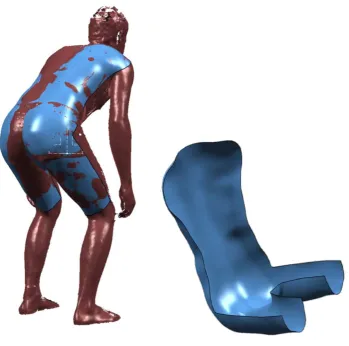
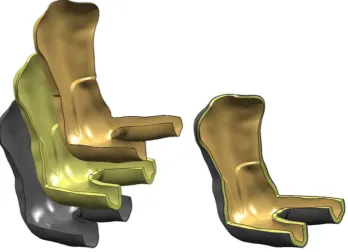
A resulting thigh-buttock-trunk surface shell for the 95th percentile subject in posture A is depicted in Figure 7. This model was also further on used for the analytic model and simulation.
Offsets were used to account for the compression of the skin, muscle and fat expected through sitting in a seat. A 6 mm layer of neoprene (Shahbeyk and Abvabi, 2009; Norpoor et al., 2008) was used to represent skin in the outer shell and various thicknesses of foam, modelling muscle and fat, are required to accurately represent the expected level of compression. Three foam thicknesses are representative of three different body corpulence
A B
percentiles. Based on literature and the analysis of magnetic resonance imaging scans (Al-Dirini et al., 2012), the following foam thicknesses were selected:
Figure 7: 3D scan resulting surface model for 95th percentile (Table 1), posture A
• 5th percentile (f) 0mm
• 50th percentile (m) 40mm
• 95th percentile (m) 65mm
Therefore, each thigh-buttock model is made of up three distinct layers; a hard shell, foam and neoprene (Figure 8). The hard shell is offset from the original scans by the thickness of the neoprene and foam. Down scaled models were designed off this generic model
upper percentiles. It is required for computational efficiency purposes during initial system optimization performed in this study.
[image:15.595.125.474.214.466.2]• A hard shell structure. This model allows even more time efficient FEM simulation and comparison with physical indenter results.
Figure 8: Three layer thigh – buttock model for 95th percentile (Table 1), posture A
To replicate the effects of skin, a neoprene rubber layer was modelled as a hyperelastic material with viscoelastic behaviour. A Neo-Hookean material model was used to model this behaviour in FEM, and a uniaxial tensile strength test was conducted using an Instron testing machine to develop the neoprene rubber material model. Clamp motion was set to a speed of 5 mm/s. The hard shell assumption was used for a rigid indenter, which was modelled using the default structural steel linear elastic material model.
Seat model
The analytical model is based on the CAD assembly of a Ford Territory seat supplied by Futuris, which was significantly modified for analysis. The assembly was reduced to include only parts of interest for frame, suspension and untrimmed foam pad, and a new assembly was created with properly defined connections. Due to the quasi-static nature of the analysis, the new assembly had all the nuts, bolts, washers and unnecessary components removed. Nevertheless the model was too large and failed to converge due to the high complexity in the geometry of the parts and the high level of non-linearity in the model (material and contact non-linearity). Even with a bonded contact assumption, the model was still too large and failed to converge. At this stage, the new assembly was reassessed, and the different parts were remodelled to a less complex geometric representation. In the remodelling stage, cosmetic curves were disregarded, bonded parts of the seat structure were combined as one part and bolsters and side supports of the seat cushion were smoothed out. The final assembly was successfully imported to ANSYS WB using the ANSYS toolbar in Solidworks®.
The seat cushion is made of open-cell PU foam. Open-cell PU foam is highly compressible due to its microstructure. Its structure has pours of air trapped inside it. When the PU foam cushion undergoes initial compression, the air inside the pours is pushed out. During this process, the foam only deforms in the direction of compression. Due to this behaviour, the Poison’s ratio is assumed to be zero in the foam material model. Furthermore, hyper-elasticity can be noted in the behaviour of foam under compression as it is able to undertake high strains without failing (Mills, 2007). Based on the above notes, a hyper-elastic Ogden second order material model with viscoelastic behaviour was used to model the PU seat cushion. As only quasi-static loading is investigated, seat structure material is assumed to be the default steel linear elastic material model in ANSYS WB v13. This was deemed acceptable as the structure and its components do not undergo any excessive loading that could drive it into failure.
3
Results
Suspension seat parameters
fabric/laminate and seat foam pad removed, the seat foam pad only with a neoprene mat on top, the same seat foam pad without neoprene mat, an unformed foam block with a neoprene mat on top, and the same foam block without neoprene mat. Table 3 provides the relative deflection data in comparison of the different properties.
Table 2: Seat and foam indentation results for rigid indenter.
Ref
Maximum Deflection
[mm]
Maximum Force [N] Fully trimmed seat cushion A1 -41.1102 -952.129 Untrimmed seat cushion A2 -42.9845 -953.719
[image:17.595.164.473.399.511.2]Seat suspension only A3 -24.8786 -981.409 Cushion pad + Neoprene fabric B1 -32.8404 -953.255 Cushion pad only B2 -33.0054 -953.226 Foam block + Neoprene C1 -44.97 -950.449 Foam block C2 -48.2931 -952.144
Table 3: Seat and foam indentation relative results for rigid indenter.
Ref
∆ Maximum Deflection [%] Contribution of production fabric to seat
cushion A1-A2 -5% Contribution of suspension A1-A3 61%
[image:17.595.157.443.536.623.2]Contribution of neoprene on foam pad B1-B2 -1% Contribution of mould/contour B1-C1 -27% Contribution of neoprene on foam block C1-C2 -7%
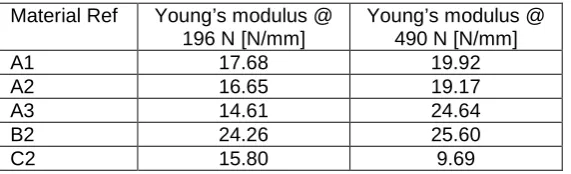
Table 4: Seat and foam stiffness calculated from experimental data (Table 2-3).
Material Ref Young’s modulus @ 196 N [N/mm]
Young’s modulus @ 490 N [N/mm]
A1 17.68 19.92
A2 16.65 19.17
A3 14.61 24.64
B2 24.26 25.60
C2 15.80 9.69
selected from the best trial out of two repeated measures and offset corrected.
Human and seat model
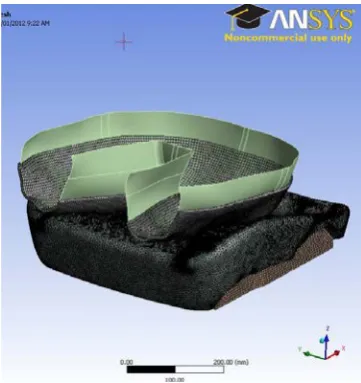
[image:18.595.111.486.279.387.2]The optimized seat frame, suspension and foam pad CAD data were transformed and meshed into finite-element models and indented by a two layer, soft surface human finite-element model (Figure 9), as well as a hard shell, human finite-element model of equal geometry (Figure 10-11).
Table 5: Seat, foam model and indenter material properties for single layer model as reported by ANSYS.
Property Base for
Cushion Suspension Cushion pad Indenter
Nodes 680 4035 30139 1227
Elements 537 3786 136289 1154
Material Structural Steel
Structural
Steel CF45 foam
Structural Steel
Volume 1.1497e-003 m³
2.3303e-004 m³
1.9072e-002 m³
2.5309e-003 m³ Mass 9.0248 kg 1.8293 kg 19.072 kg 19.868 kg
Converging results with the least computational effort were achieved for a bonded connection between cushion and seat base as well as cushion and suspension, no separation between neoprene and indenter shell (Figure 9) and a frictional connection between cushion pad and neoprene.
[image:18.595.118.299.467.659.2]Four springs with longitudinal stiffness of 9 N/m @ 22 N and 38 N/m at 523 N were chosen for the suspension.
The masses for cushion pad and indenter are shown as reported by ANSYS (19.072 kg and 19.868 kg) (Table 5), although these are obviously incorrect. Given that all other parameters and the simulation results were physically sensible, it appears that the incorrect masses constitute rather an ANSYS reporting error, than an effective parametric error.
The simulation runs of indentation were terminated at an indentation force of 950 N.
In order to achieve a closer comparison of force-deflection simulation results from the FE model with experimental measurements, the modified single layer FE model (Figure 10), based on thin 95th percentile anthropometry was then used to represent a rigid (hard shell) indenter. However it should be noted that proportions of physical and analytical indenters were not identical. Maximum deformation for both the single and two layer, soft surface indenter trials was 49mm, and Young’s modulus for the suspension was 3.35 MPa. Optimized foam parameters for the simulation were
• density (reported by ANSYS) 1000 kg/m3 and
• Young’s modulus 0.76 MPa.
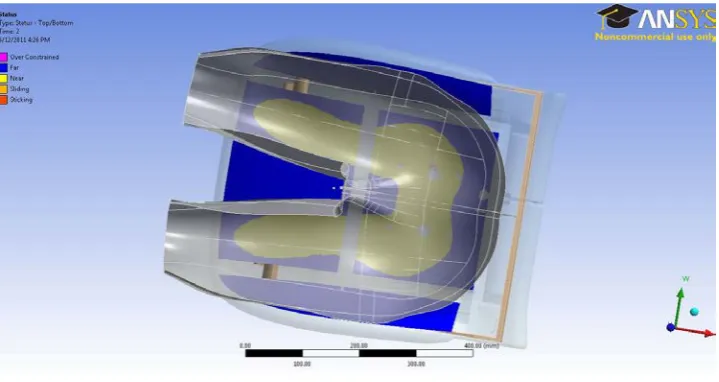
[image:19.595.119.479.462.653.2]As a qualitative control measure, seat cushion contact surface (Figure 10) and seat cushion contact pressure (Figure 11) were recorded.
Figure 11: Single layer model simulated indentation on seat cushion: contact pressure
4
Discussion
Maximum seat cushion deflection for a fully trimmed (untrimmed) suspended seat under 950N load was found to be 41mm (43mm) under experimental conditions. Seat trim, i.e. production fabric was found to have very little influence on deflection, which was reduced by 5%.
On the other hand, seat suspension contributed 61% of total seat cushion deflection, which allows the conclusion that by optimizing a seat suspension system, thinner foam pads could be used under package critical conditions. Contour or mould of the cushion pad contributed to reduced foam deflection by up to 27%, compared to a non contoured or molded foam block with similar ILD hardness and foam density. The application of neoprene for simulating indentation with a soft tissue indenter (i.e. human thigh-buttock), contributed only a negligible 1% when used in combination with the cushion pad, and 7% less deflection when used with the foam block. The study should be repeated to compare the effects of other trim type, e.g. leather vs. fabric.
reports of high energy dissipation foam pads used in Japan, if compared to other countries (Mills, 2007).
Maximum force-deflection of the untrimmed suspended seat (43mm) was approximated within 12% error margin in a finite-element model (49mm deflection) with satisfactory precision, particularly as the physical and the virtual indenter shells were not identical in shape (50th univariate percentile of US population vs. 95th bivariate percentile of combined population US/AUS).
The foam and shell density reported by ANSYS is incorrect, by a factor of 20 for PU foam when compared to physical evidence. Consequently foam and shell mass reported by ANSYS was also significantly overweighed (19.07 kg for the foam pad and 19.87 kg for the shell), again reflecting the factor 20 for foam. This oddity was also found in the data reported by Mergl et al. (2004) and will need to be further investigated.
In a qualitative assessment, pressure distribution simulated in the hard shell indentation model is very similar to pressure distribution measured on an equivalent physical property for a suspended seat. The seat pressure distribution and seat indentation simulation model “BOB” (body objective biometrics) is therefore suitable for seat comfort optimization.
Opportunities for improvement
Current geometric CAD seat models need simplifying to ensure the FEM works and generates only a small simulation error. There is opportunity for optimising within current FEM capabilities and, in the future as the processing power increases, will enable greater accuracy for simulation. Seat cushion thickness reduction is a primary focus of package efficient seat design. As seat cushion spring suspension contributes 61%, and seat cushion contour contributes 27% of deflection on a 50 mm thick cushion, there is an opportunity to reduce overall thickness of the seat cushion (~50mm) while maintaining comfort by further developing cushion pad contour and the cushion spring suspension system.
The modelling technique’s key performance characteristics scalability (e.g. dimensional variation of seat cushion and/or indenter), adjustability (e.g. softer foam, softer indenter, stiffer springs), portability (e.g. the model can be replicated in other FEM simulation packages) and extension (e.g. addition of parts like heater mats, cooling systems, spacer mats etc.) provide opportunity for a wider range of application.
5
Conclusions
The study modelled and simulated human-seat interface pressure at a reliable level required for comfort predictions, and provide insight into the contribution of suspended seat structures to the force-deflection behaviour of the combined human-seat system, which is important for both vibration comfort and static comfort analysis. By simulating a FORD physical test on a production seat, which is representative of human-seat interaction, an approximation was achieved within reasonable error. Thus the contributions of seat components to seat force-deflection behaviour were established, leading to the determination of model parameters for human-seat interface simulations. Future work will have to expand on the outcome, with an emphasis on developing a full range of human shell models, and simulating their impact on seat force deflection behaviour. Moreover, a quantitative validation of simulation results versus physical pressure maps remains to be undertaken.
Acknowledgement:
The authors acknowledge AutoCRC project funding (project C3-21) and in-kind support by Ford Motor Company Australia. We would particularly like to thank Nathan Daniell and Rami Al-Dirini for their substantial contributions to human CAD and finite-element modeling in the study.
6
References
Al-Dirini, R.M.A., Reed, M., Paul, G., and Thewlis, D. (2012) A subject-specific model of human buttocks and thighs in a seated posture. In 7th Australasian Congress on Applied Mechanics, ACAM 7, 9-12 December 2012, University of Adelaide, Adelaide, SA.
Andreoni, G., Santambrogio, G.C., Rabuffetti, M and Pedotti, A. (2002) ‘Method for the analysis of posture and interface pressure of car drivers’, Applied Ergonomics, Vol. 33 (2002), pp.511–522.
Bourdet, N and Willinger, R. (2006) ‘Modeling of car seat and human body interaction under rear impact’, International Journal of Crashworthiness, Vol. 11 No.6, pp.553-560.
Fleischer, A.G, Rademacher, U and Windberg, H.-J. (1987) ‘Individual characteristics of sitting behaviour’, Ergonomics, Vol. 30 No.4, pp.703-709.
Edwards, O., Morbitzer, J., Musardo, C., Neal, J., Slone, L., Snyder, E., Staccia, B, Zemskyy, D., the 2004 Ohio State University Future Truck Team, Guezennec, Y., Ohlemacher, F and Rizzoni, G. (2004) ‘Design and Development of the 2004 Ohio State University Future Truck’, The Ohio State University.
Grujicic, M., Pandurangan, B., Arakere, G., Bell, W.C., He, T and Xie, X. (2009) ‘Seat-cushion and soft-tissue material modeling and a finite element investigation of the seating comfort for passenger-vehicle occupants’, Materials and Design, Vol. 30 (2009), pp.4273–4285. Gyi, D.E and Porter, J.M. (1999) ‘Interface pressure and the prediction of
car seat discomfort’, Applied Ergonomics, Vol. 30 (1999), pp. 99-107.
Hartung, J., Mergl, C., Henneke, C., Madrid-Dusik, R and Bubb, H. (2004) ‘Measuring Soft Tissue Compliance of the Human Thigh’, SAE Technical Paper Series 2004-01-2158.
Kolich, M., Seal, N and Taboun, S. (2004) ‘Automobile seat comfort prediction: statistical model vs. artificial neural network’, Applied Ergonomics, Vol. 35 (2004), pp.275–284.
Kolich, M and Taboun, S.M. (2004) ‘Ergonomics modelling and evaluation of automobile seat comfort’, Ergonomics, Vol. 47 No.8, pp.841-863.
Konosu, A. (2003) ‘Development of a Biofidelic Human Pelvic FE-Model with Several Modifications onto a Commercial Use Model for Lateral Loading Conditions’, SAE Technical Paper Series 2003-01-0163. Kyung, G and Nussbaum, M.A. (2008) ‘Driver sitting comfort and
discomfort (part II): Relationships with and prediction from interface pressure’, International Journal of Industrial Ergonomics, Vol. 38 (2008), pp.526–538.
McEvoy, J.T., White, P.L., Kolich, M and Szott, M. (2004) ‘Performance of Polyurethane Foam Vibrational Characteristics and S.E.A.T. Full Foam Seat Systems’, SAE Technical Paper Series 2004-01-1715. Mergl, C., Anton, T., Madrid-Dusik, R., Hartung, J., Librandi, A and
Mills, N.J. (2007) ‘Polymer Foams Handbook: Engineering and Biomechanics Applications and Design Guide’, Butterworth-Heinemann.
Murakami, D., Kitagawa, Y., Kobayashi, S., Kent, R and Crandall., J. (2004) ‘Development and Validation of a Finite Element Model of a Vehicle , SAE Technical Paper Series 2004-01-0325.
Murata, Y., Takagi, D., Ochiai, T., Sasaki, T and Harada, H. (2002) ‘High Performance Seat Cushion PAD for Vehicle Vibrational Absorption’, JSAE Conference Proceeding No. 81-02 20025413.
Norpoor, A., Abvabi, A and Kiasat, M.S. (2008) ‘Development of a new model of EEVC/WG17 lower legform for pedestrian safety’, Proceedings of World Academy of Science, Engineering and Technology, Vol. 31, July 2008, pp. 191-198.
Paul, G. (2004) ‚Sitzkomfort im Fahrzeug‘, in Bruder, R. (Ed.), Ergonomie und Design, Ergonomia Verlag, Stuttgart, Germany, pp.181-186.
Paul, G., Daniell, N and Fraysse, F. (2012) ‘Patterns of correlation between vehicle occupant seat pressure and anthropometry’, WORK, Vol. 41(S1), pp. 2226-2231.
Pennestrì, E., Valentini, P.P and Vita, L. (2005) ‘Comfort analysis of car occupants: comparison between multibody and finite element models’, Int. J. Vehicle Systems Modelling and Testing, Vol. 1, Nos. 1/2/3, 2005.
Porter, J.M., Gyi, D.E and Tait, H.A. (2003) ‘Interface pressure data and the prediction of driver discomfort in road trials’, Applied Ergonomics, Vol. 34 (2003), pp.207–214.
Shahbeyk, S and Abvabi, A. (2009) ‘A numerical study on the effect of accident configuration on pedestrian lower extremity injuries’, Scientia Iranica, Transaction A: Civil Engineering Vol. 16, No.5, pp. 376-387.
Siefert, A., Pankoke, S and Wölfel, H.-P. (2008) ‘Virtual optimisation of car passenger seats: Simulation of static and dynamic effects on drivers’ seating comfort’, International Journal of Industrial Ergonomics, Vol. 38 (2008), pp.410–424.
Society of Automotive Engineers (2008) ‘SAE J 826 Devices for Use in Defining and Measuring Vehicle Seating Accommodation, SAE International.
Society of Automotive Engineers (1992) ‘SAE J 1013 Measurement of Whole Body Vibration of the Seated Operator of off-Highway Work Machines (Cancelled: Nov 2007)’, SAE International.
Society of Automotive Engineers (2009) ‘SAE J 1100 Motor Vehicle dimensions’, SAE International.
Thiyagarajan, P.B. (2008) ‘Non-linear finite element analysis and optimization for light weight design of an automotive seat backrest’, Master Thesis, Graduate School of Clemson University.
Tuttle, N., Barrett, R and Gass, E. (2007) ‘Seated buttock contours: a pilot study of Australian senior high-school students’, Ergonomics, Vol. 50 No.10, pp.1593-1602.
Van Hoof, J., van Markwijk, R and Verver, M. (2004) ‘Numerical Prediction of Seating Position in Car Seats’, SAE Technical Paper Series 2004-01-2168.
Verver, M.M., van Hoof, J., Oomens, C.W.J., Wismans, J.S.H.M and Baaijens, F.P.T. (2004) ‘A Finite Element Model of the Human Buttocks for Prediction of Seat Pressure Distributions’, Computer Methods in Biomechanics and Biomedical Engineering, Vol. 7 No.4, pp.193-203.
Verver, M.M., de Lange, R., van Hoof, J and Wismans, J.S.H.M. (2005) ‘Aspects of seat modelling for seating comfort analysis’, Applied Ergonomics, Vol. 36 (2005), pp.33–42.
Viceconti, M., Ansaloni, M., Baleani, M and Toni, A. (2003) ‘The muscle standardised femur’, Journal of Biomechanics, Vol. 36 (2003), pp.145–146.