Research and Information Service
Research Paper
Research and Information Service briefings are compiled for the benefit of MLAs and their support staff. Authors are available to discuss the contents of these papers with Members and their staff but cannot advise members of the general public. We do, however,
15 March 2016
Eóin Murphy
Economic impact of cuts to the
Higher Education Sector
NIAR 549-15
This briefing paper is prepared for the Committee for Employment and Learning to
consider key potential economic impacts of the Executive’s budget reductions for
Northern Ireland’s Higher Education Sector. It considers the impact at both individual
and economy levels using available information and data relating to university public
financing, student numbers and graduate supply.
Key Points
A number of sources were used to inform this paper including Higher Education Statistics Agency (HESA) data, the Department for Employment and Learning (DEL) publications, Ulster University’s Northern Ireland Skills Barometer, Northern Ireland Executive (the Executive) Budget publications and academic and consultancy research; and,
It should be noted that as the economics of higher education (HE) is a broad area, this paper focuses on specific aspects of the Higher Education Institutions (HEI) public expenditure reductions, namely the impact on HEI finances, studentenrolments, graduate destinations and the economic contribution of students. Other areas touched on this paper may warrant additional research.
HEI Funding:
The Executive’s expenditure budget allocations for HEIs have fallen. Available expenditure for the teaching grant fell from £230 million in 2010/11, to £174.3 million in 2014/15, a reduction of £55.7 million (or 24%);
Student support funding during this period increased from £153.8 million in 2009/10, to £242.3 million in 2014/15;
However, student support includes the Notional Loan Subsidy Charge (NLSC), which is over 50% of this budget in 201/15 and does not constitute cash transfers to HEIs;
After applying a deflator, real terms expenditure at NI’s HEIs falls, with the HE funding grant in 2014/15 (£174.3m) only worth £150.4m in 2007/08 prices;
Both Queen’s University Belfast (QUB) and Ulster University (Ulster) have become more reliant on other income sources, including tuition fees; and,
Review of the Income and Expenditure accounts at each HEI found that QUB, Ulster and Stranmillis all had surpluses for the last number of years. It appears that the increases in other sources of income, alongside cost saving measures, have offset the HEIs’ public expenditure reductions.Impact on Students:
The overall total number of students attending NI HEIs has increased from academic year (AY) 2008/09 to 2014/15;
The overall number of first year, first degree students has increased since 2008/09 AY, with 11,360 students in 2013/14 AY. However, in the spending review period the number of students dropped from 11,350 in the previous year to 10,450, with student numbers only just reaching the 2009/10 AY level in 2014/15 AY;
In 2014/15, 7,320 full-time NI domiciled students had received first-degree qualifications;
The majority of those entering into employment are on permanent or open-ended contracts (58.2% in 2013/14);
The NI Skills Barometer (compiled by the Economic Policy Centre at Ulster) found that the largest net requirement for skills in NI comes from the graduate level, with 25,394 job vacancies from 2015 – 2025;
Consideration of both the Destination of Leavers Survey and the NI Skills Barometer identities an apparent under- and over-supply of graduates in NI, dependent on subject studied; and,
This may create issues of over-education and under-supply, forcing graduate salaries down and impacting growth in the economy.Student Impact on the Economy:
It is well-recognised in the research that students play an important role in a local economy, in both generating income for HEIs via tuition fees and on-campus spending, and creating employment in the local economy;
Based on announced student number reductions, there will be 2,300 fewer student places in NI in the next three years;
Using per capita figures developed by Viewforth Consulting (2014) it is possible to calculate that a reduction in NI domiciled students will reduce NI Gross Value Added (GVA) by £19,306,200 per year; and,
However, this reduction may be offset by an increase in international students attending NI HEIs, with QUB intending to increase its intake by 2020 from 1,500 to 4,200.The Committee for Employment and Learning (CEL) may wish to consider the following:
Have NI’s HEIs developed long-term future funding models, or put plans in place to develop such models?
Has the DEL commissioned any research to capture the medium to long-term impacts of current and potential future reductions (if any) in HEI publicexpenditure budget allocations?
Contents
Key Points ... 1
Contents ... 3
Introduction ... 5
1 HE Expenditure ... 5
1.1 HE Public Expenditure ... 5
1.1.1 Devolution Funding Process ... 6
1.1.2 Changes in the Executive’s HE Budget... 6
1.1.3 Deflating HE Public Expenditure ... 9
1.2 Other HEI Income Sources ... 11
1.2.1 HEI Annual Accounts ... 11
1.2.2 A Comparative Perspective ... 13
1.3 Observations about Changing Trends ... 16
2 Relationship between HE and the Economy ... 17
2.1 HE and Individual Benefits ... 17
2.2 HE and Social Returns ... 19
2.2.1 Social Returns ... 19
2.2.2 Students’ and Graduates’ Contribution to the Economy ... 21
3 Key Potential Economic Impacts for NI ... 23
3.1 Impact on the individual student ... 23
3.1.1 Student Enrolment ... 23
3.1.2 Impact on Graduate Destinations ... 26
3.1.3 Graduates and the Skills Gap ... 28
3.1.4 Over- and Under-Supply of Graduates... 30
3.2 Social Returns: Student Impact on the Economy ... 32
3.2.1 Impact on the Economy of Student Number Reductions ... 32
Introduction
The Executive’s 2016-17 budget included further public expenditure reductions for Northern Ireland’s (NI) Higher Education Institutions (HEIs). Thereafter the Committee for Employment and Learning (CEL) commissioned the Research and Information Service (RaISe) to provide a paper examining key potential economic impacts of these reductions for NI.
This paper provides relevant background information, drawing on financial data and economic theory, to contextualise subsequent discussion. It is presented as follows:
Section 1: HE public expenditure;
Section 2: Relationship between Higher Education (HE) and the economy;
Section 3: Key potential economic impacts for NI; and,
Section 4: Concluding remarks.This paper addresses HEIs only and does not consider HE provided at Further
Education (FE) colleges. This is due to the availability of information and data, as well as resource constraints within RaISe.
In addition, it is still too soon to know the full impacts of the HEI public expenditure reductions, with many of the responses to the reductions still being played out (such as voluntary exit schemes and cuts in student enrolments).
1
HE Expenditure
To consider key potential economic impacts of the HEI public expenditure reductions first it is necessary to explain these reductions in the context of the expenditure available to HEIs in NI via the Executive and other sources.
1.1 HE Public Expenditure
This sub-section provides an overview of HE public expenditure. It explains the funding process under prevailing devolution in NI, and notes recent changes in the Executive’s HE budget and includes consideration of the real monetary value of HEI funding. Thereafter it highlights other HEI income to assess whether they are sufficient to offset the public expenditure reductions.
1.1.1 Devolution Funding Process
As with the other devolved administrations in the United Kingdom (UK), the NI Executive is responsible for the allocation of funding received from the UK
Government. In budget terms, this funding consists of two types – “Departmental Expenditure Limits” (“DE Limit”) and “Annual Managed Expenditure” (AME). The DE Limit is set via the Barnett Formula. It is used for set and budgeted expenditure, such as administration fees, capital projects and salaries.
AME, on the other hand, is used to cover the costs of student tuition loans and maintenance loans. As a result, it is demand led, and subject to change due to a number of variables, including:
The number of students applying for third level places;
The number of students applying for tuition and maintenance loans; and,
The Maximum Student Number (MaSN) - the cap placed on the number of students allowed to enter third-level education, set by government and enforced by the funding of places.The DE Limit provides funding for HE for a variety of purposes, including:
Infrastructure Development;
Recurrent funding for learning; and,
Teaching and research.This paper considers the DE Limit funding only, given AME is demand led.
1.1.2 Changes in the Executive’s HE Budget
Diagram 1 overleaf1 details the Executive’s HE public expenditure budget allocations.
This expenditure is divided into two elements: HE funding (which includes the teaching grant); and, Student Support and Postgraduate Awards (which includes a number of elements, including maintenance grants and postgraduate awards).
HE public expenditure fell from £230 million in 2010/11, to £174.3 million in 2014/15. This is a reduction of £55.7 million (or 24%) over five years. However, there is an 8% year-on-year increase in HE funding between 2014-15 and 2015-16.
Student Support and Postgraduate Awards (Student Support) increased from £153.8 million, to £242.3 million in 2014/15. It is worth noting that Student Support includes the Notional Loan Subsidy Charge (NLSC), which:
Reflects the notional cost to the Department of issuing loans to NI students at a subsidised rate in line with Government policy.
1 Diagram produced by RaISe based on NI Executive Budget 2008-11, Revised 2010-11 spending plans, Budget 2011-15 and
The NLSC makes up the majority of resource expenditure Student Support. For example, in 2014/15 £152m of the budgeted £242.3m was for the NLSC. The NLSC also continues to increase (as a result of a number of factors, including loan repayment patterns and issuance of new student loans). However, in real terms the NLSC does not reflect a cash transfer to a HEI. As such it does not constitute expenditure available to HEIs.
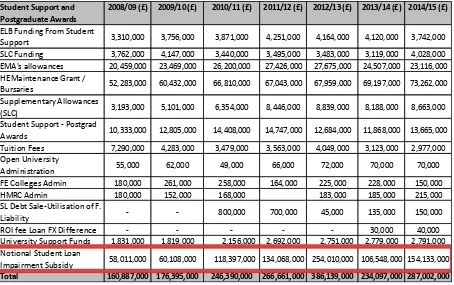
Table 1 below, compiled by the DEL, provides a breakdown of the Student Support budget in NI since 2008.2 Its figures do not match those of Diagram 1 above. The DEL
explains that this is:3
…largely due to changes in forecasted macroeconomic assumptions, which are forecast by the Office for Budgetary Responsibility (OBR)
In addition:
[image:10.595.89.543.381.666.2]…this budget is ring fenced, i.e. it cannot be used for any other purpose and the increases in the annual budgets came direct from HMT as these were UK wide issues.
Table 1: DEL Student Support and Postgraduate Awards Budget 2008/09 to 2014/15
As Table 1 shows the NSLC makes up a significant portion of Student Support and Postgraduate Awards. The level of NSLC has shifted from 2008/09 to 2014/15.
2 Department for Employment and Learning, DEL correspondence to RaISe, 4 March 2016 3 RaISe correspondence with DEL, 11 March 2016
Student Support and Postgraduate Awards
2008/09 (£) 2009/10 (£) 2010/11 (£) 2011/12 (£) 2012/13 (£) 2013/14 (£) 2014/15 (£)
ELB Funding From Student
Support 3,310,000 3,756,000 3,871,000 4,251,000 4,164,000 4,120,000 3,742,000 SLC Funding 3,762,000 4,147,000 3,440,000 3,495,000 3,483,000 3,119,000 4,028,000 EMA's allowances 20,459,000 23,469,000 26,200,000 27,426,000 27,675,000 24,507,000 23,116,000 HE Maintenance Grant /
Bursaries 52,283,000 60,432,000 66,810,000 67,043,000 67,959,000 69,197,000 73,262,000 Supplementary Allowances
(SLC) 3,193,000 5,101,000 6,354,000 8,446,000 8,839,000 8,188,000 8,663,000 Student Support - Postgrad
Awards 10,333,000 12,805,000 14,408,000 14,747,000 12,684,000 11,868,000 13,665,000 Tuition Fees 7,290,000 4,283,000 3,479,000 3,563,000 4,049,000 3,123,000 2,977,000 Open University
Administration 55,000 62,000 49,000 66,000 72,000 70,000 70,000 FE Colleges Admin 180,000 261,000 258,000 164,000 225,000 228,000 150,000 HMRC Admin 180,000 152,000 168,000 183,000 185,000 215,000 SL Debt Sale-Utilisation of F.
Liability - - 800,000 700,000 45,000 135,000 150,000 ROI fee Loan FX Difference - - - 30,000 40,000 University Support Funds 1,831,000 1,819,000 2,156,000 2,692,000 2,751,000 2,779,000 2,791,000 Notional Student Loan
Impairment Subsidy 58,011,000 60,108,000 118,397,000 134,068,000 254,010,000 106,548,000 154,133,000
Nonetheless, the general trend is upwards. In 2008/09 it was 39.1% of the Student Support budget, and in 2014/15 it consisted of 54% of the Student Support budget. Major contributors to Student Support include the HE Maintenance Grant/Bursaries at 26% of the budget. Student Support for Postgraduate Awards amounted to
[image:11.595.208.389.249.416.2]£13,665,000 in 2014/15, an increase on the previous year. However, this aspect of the budget reached £14,747,000 in 2011/12, and then fell considerably the following year. As the NLSC is non-cash it is possible to remove it from consideration. Once this is carried out, it can be seen that the Student Support budget is considerably smaller:
Table 2: Student Support less the NLSC4
Year
Student Support less NLSC (£'000)
Year on year change
(%) 2008/09 102,876 -
2009/10 116,287 13.0
2010/11 127,993 10.1
2011/12 132,593 3.6
2012/13 132,129 -0.3
2013/14 127,549 -3.5
2014/15 132,869 4.2
As can be seen, in 2008/09 to 2010/11 the student support budget increases, with public expenditure reducing in 2012/13 and 2013/14, although it returns to £132,869m in 2014/15.
Diagram 1 (above) highlights that there has been a consistent fall in elements of the Executive’s expenditure budget allocations to HEIs. However, the impact of inflation should also be taken into consideration, as considered below.
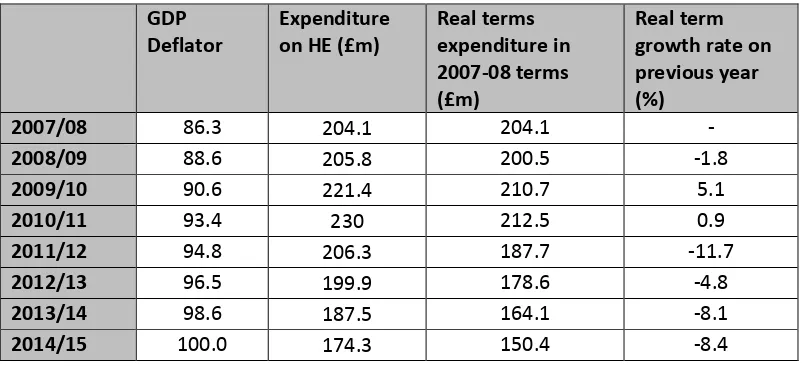
1.1.3 Deflating HE Public Expenditure
Table 3 applies a deflator to the Executive’s expenditure budget allocation for HE, using 2007-08 as the reference year.5 2007-08 is used as the reference year as it is
pre-recession and therefore reflects prices prior to the financial crisis.
Please note, no calculations are provided for the 2015-16 budget as a Gross Domestic Product (GDP) deflator is not yet available for 2015-16.
4 Table compiled by RaISe using DEL data.
5 Table calculated by RaISe, using HM Treasury GDP Deflators (
Table 3: Real terms HE expenditure budget allocations 2007-08 to 2014-15
GDP Deflator
Expenditure on HE (£m)
Real terms expenditure in 2007-08 terms (£m)
Real term growth rate on previous year (%)
2007/08 86.3 204.1 204.1 -
2008/09 88.6 205.8 200.5 -1.8
2009/10 90.6 221.4 210.7 5.1
2010/11 93.4 230 212.5 0.9
2011/12 94.8 206.3 187.7 -11.7
2012/13 96.5 199.9 178.6 -4.8
2013/14 98.6 187.5 164.1 -8.1
2014/15 100.0 174.3 150.4 -8.4
As can be seen after applying the deflator, real terms expenditure at NI’s HEIs drops with the 2014-15 expenditure allocation - £174.3m - valued at £150.4m in 2007-08 prices.
[image:12.595.97.502.427.609.2]Table 4 applies the deflator to Student Support funding (based on the Executive budget figures, rather than the DEL data, in order to ensure consistency with Table 2).
Table 4: Real terms Student Support funding 2007/08 to 2014/156
GDP Deflator Expenditure on Student Support (£m) Real terms expenditure in 2007-08 terms (£m) Real term growth rate on previous year (%)
2007-08 86.3 150.5 150.5 -
2008-09 88.6 162.4 158.2 5.1
2009-10 90.6 150.3 143.0 -9.6
2010-11 93.4 153.8 142.1 -0.7
2011-12 94.8 190.6 173.4 22.0
2012-13 96.5 193.6 173.0 -0.3
2013-14 98.6 213.7 187.0 8.1
2014-15 100.0 242.3 209.0 11.8
Student Support funding differs from HE funding in that there is an increase in real terms expenditure from 2013-14.
It can be seen that alongside the budget reductions, the impact of not including an inflationary rise to meet rising prices has appeared to result in the HEIs consequently receiving – in real terms – a further reduction in the expenditure allocated to them by the Executive.
6 Table calculated by RaISe, using HM Treasury GDP Deflators (
So while, the public expenditure provided to HEIs has fallen over the last number years, this reduction has been exacerbated by the impact of inflation.
1.2 Other HEI Income Sources
Public expenditure of HEIs in NI, as seen in sub-section 1.1, has fallen over the last number of years. However, in order to ascertain how this reduction impacts on HEIs themselves it is necessary to consider each HEI’s individual finances to see if other income sources have been identified by the HEIs to offset that reduction.
1.2.1 HEI Annual Accounts
Table 5 below details the total income for the four NI HEIs. Please note, as the Open University teaches part-time HE courses, it only receives a small amount of public funding. As such, it has not been included in this discussion.
[image:13.595.71.526.411.513.2]It should be noted that St. Mary’s Annual Accounts were not all available online. A request for a copy of its Accounts from 2008/09 onwards was made by RaISe and as soon as this information becomes available, the paper will be updated to reflect this additional information.
Table 5: NI HEI’s Total Income7
As can be seen above, there is some year on year variation in the total income of NI’s HEIs. Analysis of the year on year percentage change shows that there was a drop in HEI income between 2010 and 2011, with QUB’s income falling by 6%, Ulster’s by 1% and Stranmillis UC by 4%. This corresponds with the fall in public expenditure
allocated to for HEIs following the 2010-11 Spending Review.
For example, QUB’s income fell by approximately £17m during this period. As seen in sub-section 1.1.2, this fall in income corresponds with the budget reductions in the 2010/11 spending plans. QUB’s income began to increase in 2012, exceeding its 2010 funding level in 2014. However, Ulster’s income continued to decline until 2014; and by 2015 it had yet to reach the same levels of publicly funded income it had received previously in 2010.
7 Data sourced from HEIs annual accounts/financial statements, Note 2
2008 (£'000)
2009 (£'000)
2010 (£'000)
2011 (£'000)
2012 (£'000)
2013 (£'000)
2014 (£'000)
2015 (£'000) Queen's University
Belfast 258,440 288,937 293,668 276,029 282,686 286,090 298,389 312,630
Ulster University 187,407 201,620 205,064 202,944 199,379 191,723 199,217 204,258
Stranmillis University
Figure 1 below shows the change in government grants received by the HEIs, with the information sourced from the HEIs’ Annual Accounts.
Figure 1: HEI Government Funding (Teaching Grant)8
As can be seen above, in purely monetary terms public expenditure for NI HEIs has fallen over the last number of years. Funding for QUB has fallen from its high point in 2009 of £107m, to £93m in 2015. This is a percentage fall of 13%. Ulster’s funding has also fallen, from a high point in 2010 of £93m, to £84m in 2015, a percentage fall of 9.6%.
Stranmillis’ public expenditure reached its high point in 2009 at approximately £7.2m. It has since fallen to £6.1m in 2015, a percentage fall of 15%, giving it the largest
percentage fall in expenditure provided to the HEIs. In addition, the drop in funding for Stranmillis has been consistent, unlike QUB and Ulster which, as seen above, have had increases and decreases in their funding throughout the period discussed. Whilst public expenditure allocation to the HEIs has fallen over the last number of years, it appears that other sources of income were used to offset part of this decrease. As such, it is necessary to discuss the four other major sources of HEIs’ income as listed in their Annual Accounts:
Tuition fees;
Research grants and contracts;
Other operating income; and,
Endowment income and interest receivable.8 Data sourced from HEI annual accounts and Financial Statements, Note 2
0 20,000 40,000 60,000 80,000 100,000 120,000
Queen's University Belfast
Ulster University
For each HEI, the income derived from tuition fees has steadily increased since 2008. For example, QUB’s tuition fee income has grown from £53.6m in 2008 to £86.5m in 2015 (a 61% increase). Ulster has had a similar increase from £36.6m in 2008 to £73.9m (a 102% increase).
There appears to be a number of potential reasons for this: but certainly the increase in the amount that can be charged for tuition fees for Great Britain (GB) and
non-European Union (EU) students in 2011/12 will have generated an increase in income from tuition fees. HEIs have also increasingly focused on attracting international students to NI, as they pay significantly higher fees than domestic or EU domiciled students.
The Committee may wish to note the following:
There appears to be a shift in the balance of sources of income for HEIs. To what extent will this shift be able to compensate for the reduction in public expenditure allocations?1.2.2 A Comparative Perspective
[image:15.595.119.477.429.718.2]Table 6 compares income streams for NI’s HEIs in 2009 and 2015. It also highlights changes in the income received from various non-public sources.9
Table 6: NI HEI’s income 2009 and 201510
QUB
2009
(£'000)
% 2009 total
2015 (£'000)
% 2015 total Government Grants 107,386 37 93,100 30
Academic fees, support grants and training contracts
60,499 21 86,591 28
Research grants and
contracts 61,845 21 72,498 23 Other operating
income 50,947 18 58,353 19 Less: Share of joint
venture income -4 0 -3,220 -1 Endowment income
and interest receivable
8,270 3 5,308 2
Total 288,937 100 312,630 100
9 Table produced by RaISe, based on data sourced from HEI accounts
Ulster 2009 (£'000) % 2009 total 2015 (£'000) % 2015 total Funding Council
Grants 91,997 46 84,765 41 Academic fees and
support grants 45,723 23 73,920 36 Research grants and
contracts 20,594 10 26,408 13 Other operating
income 42,653 21 15,682 8 Endowment income
and interest receivable
653 0 3,483 2
Total 201,620 100 204,258 100
Stranmillis 2009 (£'000) % 2009 total 2015 (£'000) % 2015 total Funding Council
Grants 7,287 63 6,163 46 Tuition Fees 2,585 22 3,573 27
Research grants and
contracts 329 3 170 1 Other operating
income 1,345 12 3,302 25 Interest receivable 394 3 227 2
Total 11,586 100 13,435 100
[image:16.595.124.474.96.523.2]At the outset, it is important to clarify the use of terminology. First, government grants and funding council grants both refer to funding provided by the DEL to the HEIs. Table 6 above uses the HEIs’ terminology for clarity of any future references
(Government grants and funding council grants both refer to funding received from the DEL).
In addition, 2009 is used as the initial year in this table because this was the peak of public expenditure allocations in the Annual Accounts reviewed (2008/09 to 2014/15). As Table 6 above shows, there has been a fall in the public funding received by each of the HEIs between 2009 and 2015. There is also a clear change in the balance of income for each HEI, with academic/tuition fees making up a considerably larger proportion of a HEI’s income in 2015 than in 2008.
in Ulster’s Annual Accounts) has fallen by 5% between 2009 and 2015, with tuition fees income rising by 5%. Ulster’s other operating income has also risen by 13%.
The change in public funding is much more significant in Stranmillis than either QUB or Ulster, a difference of 17% in the income breakdown for 2009 and 2015.
Research grant income has increased significantly at QUB (albeit with a slight reduction in 2012 and 2013), rising from £61.8m in 2009 to £72.5m in 2015. Ulster’s research grant income also increased but at a slower pace than QUB, increasing by 3% (or £5.8m) in the period from 2009 to 2015.
It should be noted that QUB is a member of the Russell Group, a group of universities which are research focused. As such, it would be expected that the level of research grant funding it receives would be higher than other NI HEIs.
Other operating income is a major source of income for HEIs. Of note is that QUB’s operating income has grown at a relatively steady rate, increasing by 14% since 2009. Ulster has seen its other operating income fall, dropping from £42.6m in 2009 to
£15.6m in 2015. Stranmillis on the other hand has risen from £1.2m in 2008, to £3.3m in 2015 (albeit with the occasional fall in income).
Review of the HEIs’ costs found that both QUB and Ulster had relatively stable levels of surpluses over the last number of years, despite the public expenditure reductions.11
For example, for 2014-15, both QUB and Ulster held surpluses of £14.1m. Indeed, Ulster’s surplus has actually increased over the last number of years from a low of £106,000 in 2009-10.
There is no evidence that this retained level of surplus is a result of the either QUB or Ulster liquidating assets or other extraordinary income sources (although it should be noted QUB has a much larger surplus in 2015 as a result of exceptional income from the sale of it’s holding in Kainos Ltd)12. Some savings have been made via reductions
in expenditure, including staff costs. For example, Ulster has a drop in staff costs between 2009-10 and 2014-15 of £9,265,000, which will certainly have offset some of the public expenditure reductions. However, QUB has actually had the opposite occur with staff costs increasing from £155.8m in 2009-10, to £175.2m in 2014-15.
It should be noted that Stranmillis also shows a surplus each year. However, it shows considerably more variation, e.g. for year end 2013 Stranmillis had a surplus of £277,128, and for year-end 2014 this was £603,734.
As such, it appears that the additional income derived from tuition fees, research grants and other income have offset the losses created as a result of the public expenditure reductions, with some additional savings such as staff costs in Ulster.
1.3 Observations about Changing Trends
Based on the above, it appears that there has been a clear shift by HEIs away from public funding to other sources, with tuition fees forming the backbone of this new approach. These new income sources appear to have offset, to some part, the public expenditure reduction.
However, whilst HEIs have been able, to date, to offset some of these budget reductions through increasing the number of international students, voluntary exit schemes and through cost savings in different parts of their spending, the HEIs have begun to contract. This is evidenced by the announced cuts in both staff and student numbers at both QUB and Ulster. The reduction in student numbers is discussed further in section 3.
This could be a significant development in terms of future HEI financing if public expenditure reductions continue, given increased reliance on student fees to plug the gap created by these reduction. Indeed, the Minister for Employment and Learning stated in the forward to the recently published Big Conversation Options paper, that:13
The current funding levels for our higher education system are no longer sustainable. Decisions now need to be taken to address this situation.
The DEL paper has three main options regarding the future funding model of HE:14
Option 1: Increased public investment;
Option 2: Increased student contributions; and,
Option 3: Increased public investment and student contributions. The options paper goes on to state that:15Some of the options entail significant lead-in times and all require political consensus regarding the prioritisation of resources during the course of the next Comprehensive Spending Review period. Securing a sustainable solution for higher education funding will be a key challenge during that period, and this document is intended to aid consideration of these issues by a new Executive after the 2016 Assembly election and inform a decision on what is the preferred way forward.
What decision will be made by the new Executive, and its impact, will not be known until after the 2016 Assembly election.
13 Department for Employment and Learning, Securing a sustainable solution for Higher Education in Northern Ireland: An
options paper, https://www.delni.gov.uk/sites/default/files/consultations/del/HE%20options%20paper.pdf#page=38
2
Relationship between HE and the Economy
Public funding of HEIs is considered an investment in the future development of the countries human capital. This in turn drives productivity gains and economic growth. If NI’s public investment into HE falls this could result in future problems regarding skills gaps and productivity.
Indeed, the Department for Employment and Learning has stated that:16
Northern Ireland is the only region in the UK actively disinvesting in higher education, and, without reform or a renewed emphasis on direct investment from government, the higher education system will likely continue to contract.
It is well established that education and training are key factors in economic growth, acting as a means of raising productivity. Whilst other factors can result in short-run economic improvements, such as large scale production or more intensive use of capital equipment, education and training are critical to embedding long-term growth. As found by Harvey and Jowsey (2008):17
In the longer run, more significant increases can come with education and the acquisition of skills through training. These really represent, however, an increase in the capital investment in labour.
Benefits from HE come in two forms – at the individual level and at the societal level (generally referred to as the ‘social returns’).
This section highlights themes concerning the relationships between HE and
economics, which arise from a selection18 of research findings compiled by academics
and research consultancy. Those themes address the following relationships:
HE and individual benefits; and,
HE and social returns.2.1 HE and Individual Benefits
Individuals can benefit from accessing HE in a number of ways, including:
Increased job prospects: A 2008 study by Borooah and Mangan19 found that ineach of the UK regions higher qualifications were significantly associated with labour market success. The study also found that qualifications at degree level and above
16 Department for Employment and Learning, The Higher Education Big Conversation,
https://www.delni.gov.uk/sites/default/files/consultations/del/BIG%20CONVO%20STAGE%20TWO.PDF
17 Harvey, J and Jowsey, E, 2008, Modern Economics
18 Based upon an extensive literature review of economics publications and recent research carried out by academics, research
bodies and management consultancies
19 Education Economics, 2008, Vol.15, No. 4, Borooah, V and Mangan, J “Education, occupational class and unemployment in
had the highest impact on individuals being employed in professional, managerial and technical jobs; and,
Improved long-term health: Heise and Meyer (2004) found that it is widelyaccepted that the higher the level of education the better health and quality of life an individual has.20 In a meta-analysis of existing research they found that there was a
positive correlation between education, training and skills and the quality of life, health prospects and avoidance of social exclusion.
When an individual first considers entering HE, they, as per Ehrenberg and Smith (2010)21, have two potential streams:
Stream 1: The individual enters into employment, whereby income becomes immediately (more or less) available, but does not rise very high; and,
Stream 2: They enrol in a HE course, in which they have negative income for three years (due to the costs associated with tuition fees, accommodation and other costs of living), followed by potentially higher long-term earnings.The individual’s decision is informed by a number of factors that can influence the demand for HE places and the supply of graduates.
Partially contributing to this decision is the opportunity to access a potentially higher wage. Economists Krugman and Wells (2015) found that employers are willing to pay a premium for workers with more education:22
In 2013, Americans with four-year college degrees made 98% more per hour on average than those without a degree. That percentage is up from 89% in 2008, 85% in 2003 and 64% in the early 1980s.
However, the attractiveness of a higher wage and better quality of life can impact in other ways. Ehrenberg and Smith stated that:23
If more high-school students decide to attend college when presented with higher returns to such an investment, market forces are put into play that will tend to lower these returns in the future. Increased numbers of college graduates put downward pressure on the wages observed in labour
markets for those graduate, other things being equal, while a fall in the number of high school graduates will tend to raise wages in markets for less educated workers.
As such, a high investment return from HE attendance might encourage more individuals to attend a HEI, but in turn lead to lower graduate salaries.
20 CEDEFOP 2004, Impact of Education and TRAINING – Article by Heise, M and Meyer, W, “The benefits of education, training
and skills from an individual life-course perspective with a particular focus on life course and biographical research
21 Ehrenberg, R and Smith, R, 2012, Modern Labor Economics 22 Krugman, P and Wells R, 2015, Economics
2.2 HE and Social Returns
Social returns are the advantages and disadvantages resulting from government investment in HE. The following sub-sections provide an overview off these returns, as identified by academics and economists.
2.2.1 Social Returns
Ming and Tan (1996)24 found that investing in education is socially profitable, with
significant returns for countries that invest heavily in education. However, the stage of a country’s economic development is also important, with high income countries deriving the best social return from HE.
Wilson and Briscoe (2004) found that investing in higher education increases productivity, and therefore produces higher levels of national growth.25
In considering the impact of HE on NI, Oxford Economics, an economics consultancy, produced a report in 2007 for the DEL which examined graduate employment and productivity levels. They found that a 10% increase in the percentage of graduates in the private sector resulted in 30% higher wages for all workers. The report speculated that this may be a result of graduates facilitating the creation of high value added activities, resulting in increased demand for high paying specialised (non-graduate) labour.
However, some economists argue that the link between high levels of higher education and economic growth may not be as clear cut as discussed above.
Wolf (2002), an economist, carried out an extensive analysis of this matter and argued that:26
The links between education and growth are far less direct than our politicians suppose.
Whilst Wolf states that education is an essential part of the economy, she argues that:27
The problem arises when, as has happened in recent decades, we move to extrapolating the benefits of education in the same mood of boundless and groundless optimism as investors caught up in a stock-market bubble. The result has been expansion as an end in itself.
As such, too much public investment in HE, to the detriment of other skills levels, may in fact slow economic growth.
24 CEDEFOP 2004 Impact of Education and Training – Article by Wilson, R and Briscoe, G The Impact of Human Capitalism on
Economic Growth: A review.
25 Ibid
A report carried out by Viewforth Consulting (specialist independent consultants with expertise in higher education), on the behalf of the DEL, found that HE plays a number of roles in the NI economy including the impact of HEIs as businesses, and the higher education sector as an industry: 28
Generating economic activity, creating jobs, attracting export earnings, generating output and contributing to Gross Domestic Product (GDP); and,
Increasing the skills base and ‘absorptive capacity’ of the economy through attracting students to a region and helping a region retain its graduates. Viewforth Consulting went on to state that:29HEIs are frequently described as ‘anchor institutions’ in an economy. This is a way of describing how they are typically an embedded part of a region’s economic infrastructure. They are closely linked to, and identified with, their host region and - unlike many other kinds of enterprise - would not tend to move or be at risk of relocation to another region or country.
The study found that:30
NI HEIs provided 6,170 full time equivalent jobs;
In 2012/13 NI HEIs spent a total of £477 million; and,
The HEIs’ own output was £503 million. Through secondary or ‘knock-on’ effects the NI HEIs generated an additional £665 million in other industries across the UK, with the majority (£440 million) accruing to NI industries.Viewforth Consulting went on to state that:
The employment generated by the HEIs and their students is equivalent to around 2.6% of all Northern Ireland employment. The expansion or
contraction of the sector will consequently have a ‘knock-on’ effect on the other Northern Ireland businesses that depend on the HEIs.
As such, public expenditure reductions for NIs HEIs could have a major impact on the regional economy. Sub-section 3.2.1 discusses students and their economic
contribution.
28 Viewforth Consulting, Kelly et al, January 2015, The economic impact of higher education on the Northern Ireland Economy 29 Ibid
2.2.2 Students’ and Graduates’ Contribution to the Economy
Students
Once the decision is made to attend a HEI, students contribute to the economy in two main ways:31
Students pay money to HEIs for their fees, accommodation (where applicable) and other ancillaries (canteen/on campus catering etc.) The HEIs then re-spend the money; and,
Students also spend money on a wide range of goods and services off-campus. This includes the private rented sector, local supermarkets and local pubs and clubs.For UK domiciled students, the revenue they bring into an area is largely recycled within the economy. For example, students apply for student loans to cover the costs of tuition fees and living expenses. This money is paid to universities and local businesses, which in turn use this inflow to pay salaries, purchase from the supply chain and pay taxes. These taxes are used (in part) to provide students with loans in order to access HE.32 Via multiplier effects this cycle helps the economy grow. For
example, with every £1 million of HEI expenditure in NI, there is a further £0.88 million of output33 from NI industries.34
International students, however, introduce ‘new money’ to the system. As stated by Viewforth Consulting in their report on the economic impact of HE students on Belfast (where the majority of NI HEI students are based):35
Money spent by students from outside Northern Ireland is a clear and obvious injection into the Northern Irish economy whereas the expenditure of Northern Irish students is arguably not additional to the Northern Ireland economy as a whole.
As such, students have a significant impact on the economy in NI with any reduction in students as a result of budget cuts potentially having a negative impact on the region. To what extent this impact is will depend, in part, on whether students are NI domiciled or international.
Student numbers and the potential economic impact of changes to the number of students in NI is discussed in Section 3 of this paper.
31 Viewforth Consulting, February 2014, Belfast: A Learning City, The economic impact of higher education students on the
economy of Belfast, http://www.viewforthconsulting.co.uk/sitebuildercontent/sitebuilderfiles/belfastreport2.pdf
32 Please note, this is a rather simplified version of the economy and is for illustrative purposes only. 33 Output refers to the quantity/value of goods and services produced by a firm, industry or economy.
34 Viewforth Consulting, February 2014, Belfast: A Learning City, The economic impact of higher education students on the
economy of Belfast, http://www.viewforthconsulting.co.uk/sitebuildercontent/sitebuilderfiles/belfastreport2.pdf
Graduates
An increased number of graduates within an economy is linked to increased levels of productivity. Increased productivity in turn results in higher levels of growth within an economy.
Academics Sianesi and Van Reenen (2003)36 found strong empirical evidence that this
occurs with public investment in human capital increasing productivity. This suggests that education is a productivity enhancing activity. In its discussion of Sianesi and Van Reenen’s work, a Department of Business, Innovation and Skills (BIS) report stated that:37
The studies surveyed typically suggest that a one-year increase in average education is found to raise the level of output per capita by between three and six percent, or raise the rate of potential growth by just over one percentage point per annum.
As such, it can be argued that increasing graduate numbers within an economy (thereby investing in human capital) can increase productivity levels and therefore economic growth.
Over- and Under-supply of Graduates
There are also counter arguments which found that an over-supply of graduates in the labour market can have a downward pressure on salaries.
In addition, it can result in over-education (also known as “bumping-down theory”). This is when the supply of qualified workers grows and there are insufficient skilled jobs available. If this occurs, there is a subsequent fall in graduate-relative wages. In this regard, McGuiness (2004), an academic, found that:38
Should demand prove insufficient, or unresponsive to changes in relative supply, then workers may be forced to take jobs for which they are overeducated.
As such, over-education could be costly for the individual (in terms of having had to pay tuition fees and the opportunity cost of attending HE), the firm (with overeducation associated with lower productivity) and the education system itself. Indeed, McGuiness went on to state that:39
36 Department for Business, Innovation and Skills, 2013, Holland et al, The relationship between graduates and economic
growth across countries, https://www.gov.uk/government/uploads/system/uploads/attachment_data/file/229492/bis-13-858-relationship-between-graduates-and-economic-growth-across-countries.pdf
37 Ibid
The impacts of over-education are likely to be non-trivial and phenomenon may potentially be costly to individuals and firms, as well as the economy more generally.
3
Key Potential Economic Impacts for NI
Sections 1 and 2 set out the context in which the HE public expenditure reductions have taken place. Against this background, section 3 considers key potential economic impacts for NI, as a result of these public expenditure reductions, looking at the level of:
Sub-section 3.1: Individual student; and,
Sub-section 3.2: Societal returns.3.1 Impact on the individual student
As discussed in sub-section 2.1, HE can have a significant impact on individuals entering HE, increasing their opportunity to improve their future earnings and long-term employment prospects and subsequently their health.
This sub-section examines student enrolment figures and outcomes for graduates following completion of their courses, relying on available evidence.
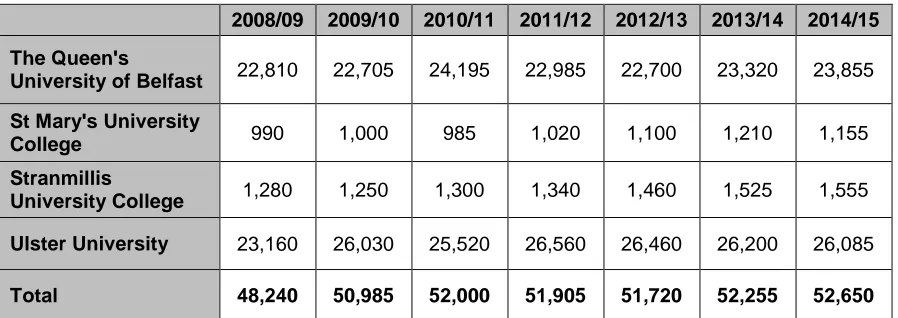
3.1.1 Student Enrolment
[image:25.595.75.524.503.662.2]Table 7 shows all students in NI by HEI since 2008.40
Table 7: HEI enrolments 2008/09 to 2014/15
2008/09 2009/10 2010/11 2011/12 2012/13 2013/14 2014/15 The Queen's
University of Belfast 22,810 22,705 24,195 22,985 22,700 23,320 23,855 St Mary's University
College 990 1,000 985 1,020 1,100 1,210 1,155
Stranmillis
University College 1,280 1,250 1,300 1,340 1,460 1,525 1,555 Ulster University 23,160 26,030 25,520 26,560 26,460 26,200 26,085
Total 48,240 50,985 52,000 51,905 51,720 52,255 52,650
The overall total number of students attending NI HEIs has increased from academic year 2008/09 to 2014/15, although this has been a relatively steady growth. It should be noted that QUB had a drop in student numbers in 2011/12 and 2012/13 and in
40 HESA, Students in Higher Education Institutions, Table 1 - All students by HE institution, level of study, mode of study and
2014/15 had yet to reach similar levels as in 2010/11. This occurs at the same time as the budget reductions introduced as part of the 2010/11 Spending Review.
Ulster has had a decline in enrolments since 2011/12.
Closer examination of undergraduate and postgraduate numbers finds that the drop in overall student numbers seems to occur mainly amongst the number of postgraduate students.41 For example, QUB had a drop from 5,840 postgraduate students in
2010/11, to 4,625 in 2012/13. It should be noted that postgraduate students are not generally supported via the DEL’s HE public expenditure. Rather, most students are
self-financing with some public funding provided via the “Student Support and
Postgraduate Awards”, as discussed in sub-section 1.1.2.
Ulster University has also had some fluctuation in its number of post-graduate students with a 6% fall in numbers between 2013/14 and 2014/15 (from 5,865 to 5,510).
[image:26.595.77.540.381.653.2]Table 8 examines the number of first year, first degree students attending NI HEIs. This can be used to identify the level of enrolments in HEIs for new students, to see if there have been any changes over time.
Table 8: First year, first degree students enrolled at NI HEIs 2008/09 to 2013/1442
Total First Year, First Degree
2008/09 2009/10 2010/11 2011/12 2012/13 2013/14
Full Time 10,075 10,525 9,680 10,485 10,245 10,655
Part Time 825 825 765 790 845 705
Full Time and Part
Time 10,895 11,350 10,450 11,275 11,095 11,360
NI students only
2008/09 2009/10 2010/11 2011/12 2012/13 2013/14
Full Time 9,345 9,750 8,850 8,820 8,950 9,620
Part Time 745 740 710 705 785 595
Full Time and Part
Time 10,090 10,490 9,555 9,525 9,735 10,215
Fee Paying students - GB and Non-EU
2008/09 2009/10 2010/11 2011/12 2012/13 2013/14
Full Time 390 395 445 1,370 965 735
Part Time 15 15 10 20 10 50
Full Time and Part
Time 405 405 460 1,385 975 790
The overall number of first year, first degree students has increased since 2008/09, with 11,360 students in 2013/14. However, in the Spending Review period, the number of students dropped from 11,350 in the previous year to 10,450, with student numbers only just reaching the 2009/10 level in 2014/15. Full-time students saw the biggest
drop in percentage terms (8%), although the fall in part-time student numbers was similar (7.3%).
Of particular note was that the fall in student numbers was centred around NI domiciled students. Between 2009/10 and 2010/11 there were 935 fewer new NI domiciled students entering NIs HEIs. Fee paying students (GB and Non-EU students) on the other hand, had an increase from 405 students to 460. In the following year this jumped to 1,385, more than doubling the number of fee paying students in NI. The number of NI domiciled first year, first degree students has increased since this period and had reached 10,215 in 2013/14 whilst the number of fee-paying students has fallen to 790.
[image:27.595.137.498.344.562.2]Figure 2 below details the number of full-time, first degree graduates from NI HEIs since 2008/09.43
Figure 2: Full-time, first-degree NI domiciled Students gaining qualifications at NI HEIs44
As can be seen above, there was an increase in the number of NI domiciled students gaining qualifications in 2011/12. This was followed by a slight down turn over the next two years. By 2014/15, 7,320 full-time NI domiciled students had received first-degree qualifications.
From 2010/11 NI has had an increasing number of graduates entering the labour market, which as discussed in sub-section 2.2.1, may result in increased productivity and growth in the NI economy. However, this is largely dependent on a graduate finding employment. As discussed in sub-section 2.2 investing in HE is socially
43 Department for Employment and Learning, 18 February 2016, Qualifications gained at UK Higher Education Institutions:
Northern Ireland Analysis 2014/15, Table 6, https://www.delni.gov.uk/publications/qualifications-gained-uk-higher-education-institutions-northern-ireland-analysis-201415
44 Figure compiled by RaISe using DEL data
6,200 6,400 6,600 6,800 7,000 7,200 7,400 7,600
profitable, increasing a region’s productivity and subsequent economic growth. However, it is necessary that these graduates are gaining skills in subject areas for which there is a need in the economy, or as discussed in sub-section 2.2.1 there can be an over-supply of graduates liable to enter jobs for which they are not suitable creating a downward pressure on salaries and impacting staff morale.
3.1.2 Impact on Graduate Destinations
The number of enrolments in NI HEIs has tended to trend upwards, with the number of NI domiciled students increased since 2012 when Great Britain (GB) domiciled
[image:28.595.106.489.372.518.2]students were no longer included in the MaSN cap. Indeed, the number of enrolled students in NI HEIs since 2008/09 has increased from 48,240 to 56,445 in 2014/15. Figure 2 highlighted that there has been an increase over time in the number of students achieving qualifications. This suggests that there are a greater number of graduates entering the labour market.
Table 9 provides a breakdown of student destinations six months after graduation.
Table 9: DEL Destination of Leavers data for first degree graduates45
2010/11 (%)
2011/12 (%)
2012/13 (%)
2013/14 (%)
Work 65 69 68 70
Work and Further Study 10 7 8 7
Further Study Only 13 12 13 13
Assumed to be
Unemployed 9 9 8 6
Not Available for
employment or other 4 4 4 4
As can be seen, the majority of graduates who responded to the survey entered into employment, with 70% entering work only and 7% entering work and further study in 2013/14. The percentage entering work only has varied slightly over time, but in 2013/14 was at its highest level in the four years of data provided. When including work and further study, there is a steady, albeit small, increase in the number of graduates finding employment six months after graduating. This corresponds with the falling level of those assumed to be unemployed.
The type of work a graduate enters can also be indicative of the labour market they are enter. Table 10 considers the type of employment graduates enter into.46
45 Department for Employment and Learning, Destination of Leavers from Higher Education,
https://www.delni.gov.uk/articles/destinations-leavers-higher-education
[image:28.595.106.492.372.518.2]Table 10: Employment types for graduates47
2011/12 (%) 2012/13 (%) 2013/14 (%) Self-employed 2.0 1.9 2.2
Starting up own business 0.3 0.3 0.3
Permanent or open ended contract 55.4 54.4 58.2
Fixed term contract lasting 12 months or
longer 16.9 21.0 17.5 Fixed term contract lasting less than 12
months 12.4 12.6 10.5 Voluntary Work 0.9 1.2 0.7
Internship/placement 2.3 2.2 3.3
Developing portfolio/Creative practice 0.3 0.3 0.2
Temping (including supply teaching) 5.5 3.5 4.8
Other 3.5 2.6 2.1
Unknown 0.5 0.1 0.0
The majority of those entering into employment are on permanent or open-ended contracts (58.2% in 2013/14). This figure increased over the period provided. Those on fixed term contracts lasting 12 months or longer were the next largest group at 17.5%.
As such, 86.2% of those who responded to the survey were in some form of permanent or fixed-term contract employment. If temping is included in this, then 93.9% of
graduates who responded to the survey were in some form of employment in 2013/14. A Universities UK study found that 86% of graduates were in employment across the UK, putting NI higher than the UK average for graduate employment.48
It is important, however, to consider whether these graduates are meeting the skills needs of the economy, as discussed below.
47 Please note, data prior to 2011/12 is not provided due to a change in reporting that occurred in the 2011/12. As a result,
aspects of the previous reports are non-comparable and therefore have not been included in Table 10. Compiled by RaISe.
48 Universities UK, The Impact of Universities on the UK Economy,
3.1.3 Graduates and the Skills Gap
The NI Skills Barometer49 compiled by Ulster’s Economic Policy Centre, found that the
largest net requirement for skills in NI comes from the graduate level, with 25,394 jobs vacancies from 2015 - 2025. Of these, the Barometer expects that at existing and projected graduate levels, NI will have 13,979 posts filled and a further 11,415 in need of appropriately qualified graduates. The majority of these (8,379) are at NQF50 level
6+ (Degree level and above).
This undersupply of graduates is noted in the DEL’s Big Conversation Options Paper51
which notes that this under-supply occurs at a time in which QUB and Ulster are reducing student places in order to offset the public expenditure reductions.
The Barometer found that there will be high demand for employees in industries such as Information and Communication (86%), Professional Scientific and Technical (41%) and Arts and Entertainment (28%).52
In NI both Information and Communication and Professional Services are small in total employment terms, but are expected to have the highest growth rates over the next ten years.
The Barometer found that of those with a NQF level 6 qualifications, 86% were in employment.
The study went on to state that it had identified: an over-supply of NQF levels 7 – 8 (postgraduate and doctorate level); and, an under-supply at Level 6 of 585 qualifiers and at Level 4-5 (HNC and HND level) of 1,420 qualifiers.
In terms of subject of study in which there was an under-supply or over-supply, the study found that there was an annual average under-supply of degree level graduates in:53
Maths and Computer science;
Engineering and technology;
Physical/Environmental;
Humanities;
Business and financial;
Creative arts and design; and,
Agricultural sciences.49 Economic Policy Centre, Ulster University , November 2015, The Northern Ireland Skills Barometer,
https://www.delni.gov.uk/publications/ni-skills-barometer
50 National Qualifications Framework
51 Department for Employment and Learning, 9 March 2016, Securing a Sustainable Solution for Higher Education in Northern
Ireland, https://www.delni.gov.uk/sites/default/files/consultations/del/HE%20options%20paper.pdf#page=38
52 Economic Policy Centre, Ulster University , November 2015, The Northern Ireland Skills Barometer,
https://www.delni.gov.uk/publications/ni-skills-barometer
An over-supply exists in:
Architecture and related;
Languages and cultural studies;
Medicine and dentistry;
Law;
Mass communications and documentation;
Biological sciences;
Education; [image:31.595.87.501.327.744.2]
Medical related subjects; and,
Social Studies. [image:31.595.95.500.330.742.2]Table 11 below details the percentage of students who found employment six months after graduation by subject area.
Table 11: Employment of full-time leavers from NI HEIs by subject area (%)54
Subject area 2009/10 (%)
2010/11 (%)
2011/12 (%)
2012/13 (%)
2013/14 (%) Medicine & dentistry 89 92 92 92 99
Subjects allied to medicine 52 64 67 68 74
Biological sciences 30 33 32 34 40
Agriculture & related
subjects 53 0 38 49 51 Physical sciences 31 41 31 34 40
Mathematical sciences 25 28 17 26 39
Computer science 58 31 62 69 70
Engineering & technology 55 53 55 63 69
Architecture, building &
planning 43 52 49 64 67 Social studies 45 44 45 47 49
Law 40 40 46 43 52
Business & administrative
studies 42 47 52 58 63 Mass communications and
documentation 43 47 40 44 47 Languages 25 43 32 33 37
Historical and philosophical
studies 27 21 25 31 39
54 Department for Employment and Learning, Destination of Leavers from Higher Education,
Creative arts & design 31 25 34 36 46
Education 51 30 59 66 72
Total 44 47 49 53 59
As can be seen above, the table largely reflects the findings of the Barometer. For example, those who studied medicine or dentistry largely entered full-time employment; as did people who qualified in computer science based subjects, with 70% of graduates in full time employment in 2013/14.
Law graduates had a lower rate of employment at 52% in 2013/14. However, this may reflect, in part, the requirement for law graduates to undertake further study in order to achieve full qualification as a solicitor or barrister (17% of law graduates went on to study full-time).
Language graduates had the lowest level of those going on to full-time employment, with one of the highest levels of going on to further full-time study (22%). It should be noted that Ulster has recently announced the closure of its School of Languages. As noted in the Barometer, there is an existing over-supply of languages students in the NI labour market. This is further reflected in the employment levels for languages
students seen in the destination of leavers of survey. Based on this, a reduction in the number of graduates may not have as significant an economic impact, at this moment in time, if other courses were closed.
The Graduate Destinations survey provides only a snapshot of a graduate’s situation at the time of the survey and should be treated as such. However, it does help indicate that there are a large number of graduates who are facing employment issues following completion of courses. Indeed, when considering the data for subject area of those who are unemployed, graduates with degrees in Mass Communications and Creative Arts and Design have high levels of unemployment (10.3% and 8.6% respectively). Of note, however is that despite the under-supply in the labour market of those with computer science qualifications, the 2013/14 Destination of Leavers survey found that 8.9% of graduates with a degree in computer science were unemployed.
As found by Universities UK, following strong growth in the number of students in the UK, there have been concerns about an over-supply of graduates. This can affect employment and earnings prospects of graduates and is discussed further in sub-section 3.1.4 below.55
3.1.4 Over- and Under-Supply of Graduates
The potential over-supply of graduates can have a significant impact on the economy.
55 Universities UK, The Impact of Universities on the UK Economy,
As discussed in sub-section 2.2.1, if there are too many graduates in the labour market, wages can be forced down. This is a result of a number of factors, including
over-education in which a graduate finds employment for which they are over-qualified for. As such they earn less than the career they have trained for and can be more prone to lower morale and low productivity.
However, the Barometer argues that an under-supply of skills would have a much more significant impact on the economy:56
The most significant implication would be that economic growth would be constrained, the skills mismatch would result in a continued loss of talent to employment opportunities overseas and higher levels of unemployment.
[image:33.595.88.499.359.567.2]What is noteworthy is that NI appears to have both an over- and under-supply of graduates, based on the subject areas studied at HEIs. Figure 3 below provides the salary of NI domiciled full-time first-degree qualifiers from UK HEIs in full-time employment by Standard Occupation Classification (SOC).
Figure 3: NI domiciled full-time, first-degree graduates by SOC57
As can be seen, graduate salaries have remained static in NI for a number of years. For those who enter a professional career six months after graduation, the annual median salary has remained at £22,000 per annum since 2009/10.
The total median salary has remained static at £20,000 per annum since 2010/11.
56 Economic Policy Centre, Ulster University , November 2015, The Northern Ireland Skills Barometer,
https://www.delni.gov.uk/publications/ni-skills-barometer
57 Department for Employment and Learning, Destination of Leavers from Higher Education,
https://www.delni.gov.uk/articles/destinations-leavers-higher-education
£10,000 £12,000 £14,000 £16,000 £18,000 £20,000 £22,000 £24,000
Managers, directors and senior officials
Professional
Associate professional and technical
Administrative and secretarial
Skilled trades
Caring, leisure and other service
Sales and customer service
Process, plant and machine operatives
Elementary
Based on the economic theory presented above, the lack of a rise in salaries could imply that the effect of the over-supply of graduates is causing graduate wages to remain relatively static.
In order to investigate this further, it would be necessary to consider salaries paid based on the subject of study a graduate is qualified in. However, following a search of the available data (including DEL statistics and HESA publications), it was not possible to identify relevant information to facilitate this analysis at this time.
In addition, a number of other factors would need to be considered, to ensure a thorough examination of this issue, including medium- to long-term employment, existing economic factors (e.g. business growth, impact of the reduction in employment in the public sector, a major employer of graduates in NI and potential Foreign Direct Investment impacts).
As seen in Section 3.1 of this paper, NI has a growing level of graduates. However, the NI Skills Barometer identifies that there is both an over- and under-supply of graduates.
This appears, based on the limited analysis possible with available data, to be a factor in the flattened wage growth for graduates. This may be an area for possible future research to determine the connection, if any, between these variables.
3.2 Social Returns: Student Impact on the Economy
As discussed in sub-section 2.1, students play an important role in a local economy, generating income for HEIs via tuition fees and on-campus spending, as well as creating employment in the local economy.
3.2.1 Impact on the Economy of Student Number Reductions
It is reasonably foreseeable that a reduction in the number of students would impact on the local economy. This appears to have occurred previously in 2010/11 in NI. More recently, both QUB and Ulster have announced reductions in student numbers.
In a briefing to the CEL on the 7 October 2015, QUB stated that there was to be in total a reduction of 2,200 student places at QUB and Ulster over the next four years, with 1,050 of these places coming from QUB. 58 Ulster, however, stated in a briefing on
the 15 October 2015 that it was reducing its student numbers by 1,250.59 As such, this
totals 2,300 fewer student places in NI.
58 Northern Ireland Assembly, Committee for Employment and Learning, 7 October 2015, Briefing by Queen’s University Belfast,
http://data.niassembly.gov.uk/HansardXml/committee-15185.pdf
59 Northern Ireland Assembly, Committee for Employment and Learning, 21 October 2015, Budget cuts: Ulster University
RaISe has contacted QUB and Ulster (3 March 2016) for further information regarding the reduction in student numbers, including if it will be drawn from a specific part of the student body (such as NI students only).
Ulster has stated that:60
The reduction in student places is across full-time undergraduate places.
And that:
This reduction affects student places within the MaSN mechanism (Maximum Student Numbers). This mechanism applies a cap to the number of students recruited from Northern Ireland, eligible for support from public expenditure.
To implement the reduction in student numbers:61
…Ulster University reviewed its full-time undergraduate provision in its entirety, with a focus on the sustainable delivery of high quality teaching and world-leading research that produces graduates with industry ready, relevant skills that benefit business and society.
This has resulted in some course closures and the consolidation of course provision on individual campuses.
A number of factors were taken into consideration when arriving at decisions on course provision. These factors include student demand, attrition rates, student satisfaction, research performance, employment statistics and the strengths of and opportunities for each campus.
QUB will reduce its undergraduate places for NI and EU domiciled students.62
Based on the per capita contribution made by students to the NI economy as
calculated by Viewforth Consulting63, it is possible to calculate an estimate cost to the
NI economy of this reduction.
Please note, a number of caveats are attached to this calculation. As a result, it is best considered indicative only for the following reasons:
The Viewforth Consulting report developed a per capita GVA figure for students from outside Belfast. As such, it does not include students who are Belfast domiciled;60 RaISe correspondence with Ulster University, 8 March 2016, Economic Impa