NFER Teacher voice
omnibus
Research report
July 2016
Suzanne Straw, Jack Tattersall and David
Sims
Contents
List of figures 4
List of tables 6
Executive Summary 7
Introduction 7
Key findings 7
Statutory assessment 7
Qualification reform 8
Accountability reforms 9
Careers and apprenticeships 9
Building pupils’ character, resilience and active learning 10
Alternative provision 11
Prevent 12
Physical activity 12
English as an additional language (EAL) 13
Vocational programmes 13
Introduction 14
The survey sample 14
Statutory assessment 15
Qualification reform 19
Accountability reforms 21
Primary floor standard 21
Secondary: Progress 8 22
Careers and apprenticeships 25
Careers 25
Apprenticeships 27
Building pupils’ character, resilience and active learning 29
Alternative provision 34
Prevent 37
Physical activity 39
English as an additional language (EAL) 41
Vocational programmes 43
Annex 1: Supporting information 44
How was the survey conducted? 44
What was the composition of the panel? 44
How representative of schools nationally were the schools corresponding to the
teachers panel? 44
How accurately do the results represent the national position? 49
References 50
List of figures
Figure 1: Which of the following best describes your school’s approach to assessment? ... 16 Figure 2: Would your staff benefit from additional training on assessment without levels? ... 17 Figure 3: Does your school collect data to track pupil progress between statutory and end of key stage assessments? ... 18 Figure 4: How well has the preparation and start of teaching gone in your school for the new GCSEs? ... 20 Figure 5: What steps have you taken to prepare for the new primary floor standard? ... 22 Figure 6: Have the accountability reforms for 2016 encouraged your school to enter some Year 9 pupils for a different number of qualifications than previously? ... 24 Figure 7: Which of the following activities and services do you provide as part of your careers programme to help young people make informed choices about their post-16 options? ... 26 Figure 8: What does your school do to promote apprenticeships? ... 27 Figure 9: To what extent do you agree that: the range of extra-curricular activities my institution offers pupils has increased in the last 12 months; and the number of pupils taking up extra-curricular activities has increased ... 31 Figure 10: How often have the following taken place over the last 12 months: visits to your school by employers to work with pupils; and pupil visits to employers/places of work? ... 32 Figure 11: How often have the following taken place over the last 12 months: visits to your school by voluntary organisations to work with pupils; and pupil visits to voluntary organisations? ... 33 Figure 12: From which of the following do you commission alternative provision? ... 35 Figure 13: To what extent would you agree with the following statement – I am happy with the quality of alternative provision providers in my area? ... 36 Figure 14: How confident are you in implementing the new duty on schools to ‘have regard to the need to prevent children and young people from being drawn into
terrorism’? ... 38
Figure 15: How many hours in a typical week do pupils spend on: PE, sport/active clubs, dance and physical activity at lunch/break? ... 40 Figure 16: What specific learning provision, if any, does your school offer for English as an additional language (EAL) pupils? ... 42 Figure 17: How are employers involved in the delivery of vocational programmes? ... 43
List of tables
Table 1: Representation of primary schools compared to primary schools nationally 45 Table 2: Representation of (weighted) secondary schools compared to secondary
schools nationally 46
Table 3: Representation of all schools compared to all schools nationally 47 Table 4: Comparison of the achieved sample with the national population by grade of
teacher (not including academies) 48
Table 5: Comparison of the achieved academies sample with the national population by
grade of teacher 48
Table 6: Precision of estimates in percentage point terms 49
Executive Summary
Introduction
The Department for Education (DfE) submitted a total of 23 questions to NFER which were included in the Teacher Voice Omnibus Survey and a Senior Leader Booster Survey conducted in autumn 2015. The Teacher Voice Omnibus Survey was completed online between 6th and 11th November 2015, and the Senior Leader Booster Survey was completed online and on paper between 20th November and 11th December 2015. The questions explored teachers’ and senior leaders’ views on, and strategies and activities relating to, a range of areas such as: statutory assessment; curriculum reform; accountability reforms; careers and apprenticeships; building pupils’ character, resilience and active learning; alternative provision; Prevent; physical activity; English as an
additional language (EAL) and vocational programmes.
In total, 1,920 respondents completed the survey from 1,549 schools in the maintained sector in England. Forty-eight per cent (917) of the respondents were teaching in primary schools and 52 per cent (1003) were teaching in secondary schools. In terms of roles, there was a fairly even spilt between senior leaders (defined as headteachers, deputy headteachers and assistant headteachers) and classroom teachers. There were 965 senior leaders (just over 50 per cent) and 955 classroom teachers (just less than 50 per cent).
Findings are provided for the overall sample, and are broken down by school phase (primary and secondary) and role (senior leader or classroom teacher), where relevant.
Key findings
Statutory assessment
A new National Curriculum for primary and secondary schools was started to be
implemented from September 2014. As part of the reforms, the system of ‘levels’ used to report children’s attainment and progress was removed.
Following the removal of levels, the majority of senior leaders and classroom teachers (71 per cent) reported that their school had developed new approaches to assessment. A small proportion (15 per cent) had fully implemented a new approach, around two-fifths (42 per cent) had developed a new approach to assessment and had started to
implement it, and 15 per cent were currently developing a new approach. Much higher proportions of respondents in secondary schools, as opposed to primary schools, both
intended to keep using levels (11 per cent as opposed to 2 per cent) and were still using levels but intended to develop a new approach (37 per cent as opposed to 5 per cent). The majority of senior leaders and classroom teachers (76 per cent) agreed that their staff would benefit from some type of additional training on assessment without levels. Just over a quarter (26 per cent) agreed that a basic product for in-service training would be useful/helpful, whilst just under a third (30 per cent) preferred a more in-depth
professional development course. Just over a fifth (21 per cent) reported that they would welcome the opportunity for selected staff to develop detailed expertise in assessment. However, just over a fifth (23 per cent) reported that staff were already competent at assessing without levels and did not require training. Classroom teachers were more interested than senior leaders in a basic or in-depth professional development course for all rather than a specialist course for selected staff.
When asked about processes for tracking pupil progress between statutory end of key stage assessments, around a half (49 per cent) of senior leaders and classroom teachers reported that they collected and recorded data more than once a term, with a similar proportion (46 per cent) collecting and recording data on a termly basis.
Qualification reform
In secondary schools, a new and more demanding style of GCSE has been introduced. This includes a new grading scale of 9 to 1 (with 9 being the top grade) and assessment mainly being undertaken by exam at the end of the course. The new GCSEs in English language, English literature and mathematics have been taught since September 2015. From September 2016, new GCSEs will be taught in: ancient languages, art and design, biology, chemistry, citizenship studies, computer science, dance, double science, drama, food preparation and nutrition, geography, history, modern foreign languages, music, physical education, physics and religious studies.
Senior leaders were asked how confident their school was to teach the second wave of new GCSE subjects from 2016. Three-fifths of senior leaders (60 per cent) were ‘very confident’ (9 per cent) or ‘fairly confident’ (51 per cent). Just over a quarter (26 per cent) were ‘neither confident nor unconfident’. Around one in ten were ‘not at all confident’ (11 per cent).
Regarding the preparation for, and start of, teaching the new GCSEs in English
language, English literature and mathematics from September 2015, similar responses were received for these three subjects. Just over three-fifths of senior leaders (62 per cent for both English subjects and 61 per cent for mathematics) reported that the
preparation and start of teaching had gone ‘fairly well’. Around a quarter reported that it had gone ‘very well’ (25 per cent for English language, 23 per cent for English literature and 24 per cent for mathematics). A minority of senior leaders reported that it had gone
‘not very well’ or ‘not at all well’ (5 per cent for English language, 6 per cent for English literature and 7 per cent for mathematics).
Accountability reforms
In primary schools, there has been a move away from an absolute measure of progress (i.e. pupils being expected to make two levels of progress between Key Stage (KS)1 and Key Stage (KS) 2) to a relative measure in which pupils’ progress at KS2 is compared against pupils with a similar baseline (i.e. the same KS1 average point score).
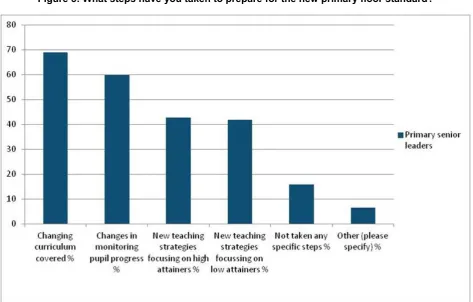
In preparing for the new primary floor standard, the majority of primary senior leaders reported that they had changed the curriculum covered (69 per cent) and changed the way in which they monitored pupil progress (60 per cent). More than two-fifths had also developed new teaching strategies focusing on high attainers (43 per cent) and on low attainers (42 per cent).
The new secondary school accountability framework includes two headline measures of school performance: Attainment 8 and Progress 8. These replace the previous measure focusing on the number of pupils achieving at least 5 A*-C grades at GCSE, including English and mathematics. Attainment 8 measures the achievement of a pupil across 8 subjects and makes comparisons to the average score of pupils with the same starting point. A school’s Progress 8 score is calculated on the average of its pupils’ Progress 8 scores. It will give an indication as to whether pupils in the school have made above or below average progress compared to similar pupils in other schools.
In the light of the introduction of Progress 8, a large proportion of secondary senior leaders (62 per cent) planned to carry on as usual in terms of where resource was focused. Where schools were making changes, most were planning to focus more on high attainers (GCSE grade B or higher) (19 per cent).
Secondary senior leaders were asked if the reforms for 2016 had encouraged their school to enter some Year 9 pupils for a different number of EBacc qualifications. Similar proportions of senior leaders reported that they were not entering Year 9 pupils for more EBacc qualifications (47 per cent) or were entering Year 9 pupils for more EBacc
qualifications (44 per cent). In terms of the total number of qualifications and the number of non-GCSE qualifications that Year 9 pupils were being entered for, the majority of senior leaders (60 and 59 per cent respectively) were not making any changes.
Careers and apprenticeships
There is a statutory duty on schools to secure independent careers guidance for all Year 8-13 pupils. One of the post-16 options pupils can consider are apprenticeships which combine practical training and work-experience with study. There has been a recent
government commitment to reach three million new apprenticeship starts in England by 2020.
Senior leaders in secondary schools were asked what activities they provided as part of their careers programme to help young people make informed choices about their post-16 options. The most common activities provided were: events/careers fairs (reported by 86 per cent); access to websites which show all the options available (82 per cent); apprenticeships information (78 per cent); and support from professional careers advisers (77 per cent). These activities were followed by: workplace visits and/or work experience (reported by 70 per cent), local education and training providers being invited into school (69 per cent), external employer speakers (68 per cent) and visits to local education and training providers (66 per cent).
The main way of promoting apprenticeships was sharing literature, reported by more than four-fifths (82 per cent) of secondary senior leaders. Around a half also reported inviting education or training providers into school to talk about apprenticeships (54 per cent), taking pupils to a careers or apprenticeships fair (53 per cent), and inviting employers into school to talk about apprenticeships (48 per cent).
Regarding support to promote apprenticeships, two-thirds of secondary senior leaders (66 per cent) reported that they would like a free online tool for pupils to search and apply for apprenticeship vacancies. A similar proportion (62 per cent) wanted a mechanism to match schools/colleges with employers offering apprenticeships and willing to speak to students.
Building pupils’ character, resilience and active learning
As part of its £3.5 million Character Grants scheme for 2015/16, the DfE is providing grants to expand initiatives that successfully improve the character of young people and expects to improve the lives of 150,000 children in more than 1,100 schools.
Senior leaders in primary and secondary schools were asked about the number of extra-curricular activities they provided and their links and activities with employers and
voluntary organisations. Senior leaders in secondary schools reported offering a larger number of extra-curricular activities than their counterparts in primary schools in all areas of interest. The highest number of activities was offered in sport/games/exercise in both phases of education, with 83 per cent of senior leaders in secondary schools and 39 per cent of senior leaders in primary schools reporting that they offered ‘five’ or ‘more than five’ activities in this curricular area. Following sport/games/exercise, secondary schools offered the most activities in academic subjects, music and homework. Primary schools offered the most activities in music, with provision also commonly offered in arts/crafts, ICT, drama/dance/film and academic subjects.
Just under half of all senior leaders (48 per cent) reported that their range of extra-curricular activities had increased in the last 12 months. Similarly, half of all senior leaders (50 per cent) ‘strongly agreed’ or ‘agreed’ that the number of pupils taking up extra-curricular activities had increased over the same period.
Senior leaders in secondary schools reported that employer and voluntary organisation visits into school to work with pupils tended to take place termly (with 47 and 48 per cent respectively reporting this). Pupil visits out of school to employers/workplaces, tended to take place annually (with 45 per cent reporting this). Pupil visits out of school to voluntary organisations tended to take place termly (with 30 per cent reporting this) or annually (25 per cent).
Secondary senior leaders were also asked to think about the employer with which they had been working the longest with regards to visits and to say how long they had been working with this specific employer. The vast majority (70 per cent) reported that they had been working with this employer for a year or more. They gave a similar response
regarding voluntary organisations, with two-thirds (66 per cent) having worked with a specific voluntary organisation for a year or more.
Alternative provision
Alternative provision is arranged by local authorities and schools for pupils who, due to exclusion, illness or other reasons, would not otherwise receive suitable education. Its aim is to provide a good quality of education, on a par with the mainstream, whilst the needs which require intervention are addressed
Senior leaders were asked how confident they were in commissioning alternative provision for pupils. Just over two-fifths (42 per cent) reported that they were ‘fairly confident’, with a fifth (21 per cent) being ‘very confident’. A higher proportion of senior leaders in secondary schools than in primary schools reported that they were ‘very confident’ (27 per cent as opposed to 15 per cent). The most commonly commissioned alternative provision was from local authority Pupil Referral Units (reported by 56 per cent), followed by private organisation/individual (27 per cent) and FE colleges (20 per cent).
Senior leaders were asked if they had commissioned alternative providers to help
manage pupils with behavioural problems who could not be managed in school. Around a third (32 per cent) reported doing this ‘occasionally’, with a quarter (24 per cent)
commissioning provision ‘very rarely. Secondary schools were more likely to commission alternative provision for this reason than primary schools.
Senior leaders were also asked if they were happy with the quality of alternative provision in their area. There were mixed views with 36 per cent responding ‘strongly agree’ or
‘agree’ and 31 per cent responding ‘disagree’ or ‘strongly disagree’ and just over a fifth (23 per cent) responding ‘neither agree nor disagree’.
Prevent
Since 1 July 2015, all schools are now subject to a duty under section 26 of the Counter-Terrorism and Security Act 2015 to have “due regard to the need to prevent people from being drawn into terrorism”. This is known as the Prevent duty. Protecting children from radicalisation is seen as part of schools’ wider safeguarding duties.
Senior leaders and classroom teachers were asked how confident they were in
implementing the new duty on schools to ‘have regard to the need to prevent children and young people from being drawn into terrorism’. Over four-fifths of senior leaders (83 per cent) were ‘very confident’ (30 per cent) or ‘fairly confident’ (53 per cent) in
implementing the new duty. Only six per cent were ’not very confident’ (5 per cent) or ‘not at all confident’ (1 per cent). Almost no senior leaders were unaware of the new duty. Classroom teachers were less confident than senior leaders in implementing the new duty, with just over half (52 per cent) reporting that they were ‘very confident’ (17 per cent) or ‘fairly confident’ (35 per cent) in implementing it. Seventeen per cent were ‘not very confident’ (11 per cent) or ‘not at all confident’ (6 per cent) in implementing the new duty, with 7 per cent being unaware of it.
Physical activity
Schools are required to provide a high quality physical education curriculum which inspires all pupils to succeed and excel in competitive sports and other physically- demanding activities. This includes providing opportunities for pupils to participate in a range of extra-curricular activities.
Senior leaders in primary and secondary schools were asked how long most pupils in their school spent on a range of physical activities in a week. This included physical education (PE), sport/active clubs, dance and physical activity at lunch and break times. In terms of PE, the majority (65 per cent) reported that pupils spent ‘more than two hours and up to three hours’ in a typical week. The picture was similar for primary and
secondary schools. In addition, nearly half of senior leaders (46 per cent) reported that pupils spent ‘more than 30 minutes and up to an hour’ on sport/active clubs.
In terms of time spent on dance activities in a typical week, around a third of senior leaders (34 per cent) reported that pupils spent ‘more than 30 minutes and up to an hour’, whilst 27 per cent reported pupils spending ‘up to 30 minutes’. However, 17 per cent reported that no time was spent on dance, with a higher proportion of secondary than primary respondents reporting this (21 per cent as opposed to 12 per cent).
Regarding time spent on physical activities during lunch and break, a third of senior leaders (34 per cent) reported that pupils spent ‘more than 30 minutes and up to an hour’. A fifth (22 per cent) reported pupils spending ‘up to 30 minutes’ and 15 per cent reported ‘more than an hour and up to two hours’. Senior leaders in primary schools reported pupils spending more time on physical activities during lunch and break times than their counterparts in secondary schools. More than a quarter (27 per cent) of senior leaders in primary schools reported pupils spending more than two hours on this activity compared to 12 per cent in secondary schools.
English as an additional language (EAL)
English as an additional language (EAL) is a commonly used term in schools for pupils whose first language is not English. In 2015, around 19 per cent of primary and 15 per cent of secondary school pupils had a main language other than English, with the figure rising every year.
Senior leaders were asked what specific learning provision they offered for English as an additional language (EAL) pupils. Between a third and a half reported that they undertook scaffolding in curriculum subjects (49 per cent), provided intensive catch-up support on an individual basis (42 per cent), provided one-to-one tuition (34 per cent) and had an EAL coordinator (34 per cent).
Vocational programmes
The government is currently reforming and re-categorising the vocational qualifications system. This now includes Level 3 Applied General and Technical Level qualifications, as well as the Technical Baccalaureate. There is also the Level 2 Technical Certificate. Senior leaders in secondary schools were asked how employers were involved in the delivery of vocational programmes. The most common way was through providing work experience or work placements, reported by 70 per cent of respondents. This was followed by employers delivering training at the school or college (44 per cent) and employers providing mentoring to pupils (29 per cent).
Introduction
The Department for Education (DfE) submitted a total of 23 questions to NFER which were included in the Teacher Voice Omnibus Survey and a Senior Leader Booster Survey conducted in autumn 2015.
This report provides an analysis of the responses preceded by a short policy context. Findings are provided for the overall sample, and are broken down by school phase (primary and secondary) and type of respondent (senior leader or classroom teacher), where relevant. Supporting information about the survey sample is provided in Annex 1. Alongside this report, a complete set of data tables for the survey has been published presenting responses to each question. This includes responses broken down by school phase (primary and secondary) and role in school (senior leader and classroom teacher), where appropriate.
The survey sample
The primary school sample and combined primary and secondary school sample were representative of the national population in terms of free school meals (FSM) eligibility, school type, region, achievement and local authority type. The secondary school sample was not representative of the national population of secondary schools in terms of FSM eligibility. Weights were therefore calculated and applied to the secondary school data in order to address this issue. After weighting the data, the secondary school sample was also representative of secondary schools nationally in terms of FSM eligibility, school type (including academies), achievement, region and local authority type. Detailed information about the sample is given in Annex 1 of the report.
Statutory assessment
A new National Curriculum for primary and secondary schools was announced in January 2011 and was started to be implemented from September 2014. As part of the reforms to the national curriculum, the system of ‘levels’ used to report children’s
attainment and progress was removed. Level descriptors were intended to be used for end of key stage statutory assessment but, over time, they played an increasing role in all assessment and teaching practice. They encouraged pace over consolidation. It was perceived that some pupils were being encouraged to move on before they had securely grasped curriculum content and the descriptors did not give parents an accurate
understanding of how their children were doing in school. The removal of levels is intended to allow classroom assessment to return to its real purpose of helping teachers to evaluate pupils’ knowledge and understanding of curriculum content and to plan. Further information can be found in the Department for Education National Curriculum and assessment fact sheet.
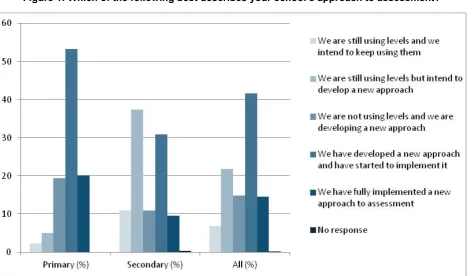
When asked about their school’s approach to assessment following the removal of levels, the majority of senior leaders in primary and secondary schools (71 per cent) reported that they were no longer using levels. As Figure 1 shows, a small proportion (15 per cent) had fully implemented a new approach to assessment, around two-fifths (42 per cent) had developed a new approach and had started to implement it, and 15 per cent were currently developing a new approach. Only a very small proportion (7 per cent) intended to retain the levels and just over a fifth (22 per cent) were still using levels but intended to develop a new approach.
Looking at differences by phase showed that higher proportions of respondents in secondary schools, as opposed to primary schools, both intended to keep the levels (11 per cent as opposed to 2 per cent) and were still using levels but intended to develop a new approach (37 per cent as opposed to 5 per cent). Conversely, higher proportions of respondents in primary than in secondary schools reported that they had fully
implemented a new approach (20 per cent as opposed to 10 per cent) or had developed a new approach and started to implement it (53 per cent as opposed to 31 per cent).
Figure 1: Which of the following best describes your school’s approach to assessment?
Source: Teacher Voice Omnibus Survey November 2015 and Senior Leader Booster November 2015
Higher proportions of senior leaders than classroom teachers in both primary and secondary schools reported that their school had developed or had fully implemented a new approach to assessment.
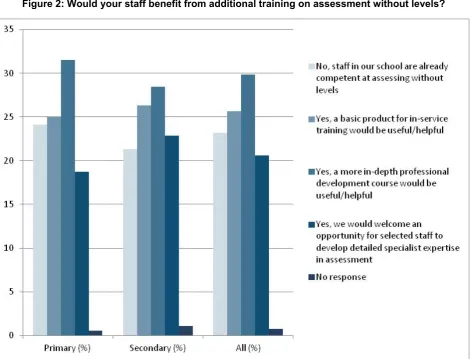
When asked if staff would benefit from additional training on assessment without levels, the majority of respondents (76 per cent) reported that they would. As Figure 2 shows, just over a quarter (26 per cent) agreed that a basic product for in-service training would be useful/helpful whilst just under a third (30 per cent) preferred a more in-depth
professional development course. Just over a fifth (21 per cent) reported that they would welcome the opportunity for selected staff to develop detailed expertise in assessment. However, just over a fifth (23 per cent) reported that they did not require training as staff were already competent at assessing without levels.
Figure 2: Would your staff benefit from additional training on assessment without levels?
Source: Teacher Voice Omnibus Survey November 2015 and Senior Leader Booster November 2015
In secondary schools, senior leaders were slightly more confident than classroom
teachers that staff in their school were already competent at assessing without levels (25 as opposed to 18 per cent). Classroom teachers in both school types were more
interested than senior leaders in a basic or in-depth professional development course for all rather than selected staff developing specialist expertise.
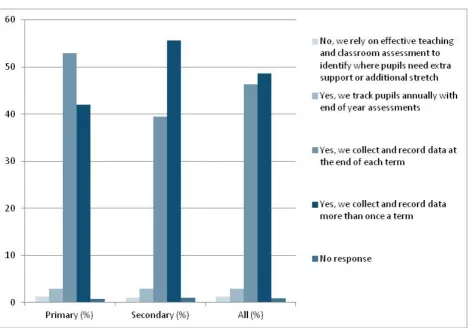
Senior leaders and classroom teachers were also asked if their school collected data to track pupil progress between statutory end of key stage assessments. Around a half (49 per cent) reported that they collected and recorded data more than once a term, with 46 per cent collecting and recording data at the end of each term. Three per cent reported tracking pupils annually with end-of-year assessments, whilst 1 per cent relied on effective teaching and classroom assessment to identify where pupils needed extra support or additional stretch.
Regarding comparisons between primary and secondary respondents, as Figure 3 shows, a higher proportion of secondary than primary respondents reported that they collected and recorded data more than once a term (56 as opposed to 42 per cent) with, conversely, a higher proportion of primary than secondary respondents reporting that they collected data once a term.
Figure 3: Does your school collect data to track pupil progress between statutory and end of key stage assessments?
Source: Teacher Voice Omnibus Survey November 2015 and Senior Leader Booster November 2015
Qualification reform
In secondary schools, a new and more demanding style of GCSE has been introduced, which includes a new grading scale of 9 to 1 (with 9 being the top grade and 1 the bottom), with assessment mainly being undertaken by exam at the end of the course. The new GCSEs in English language, English literature and mathematics have been taught since September 2015. From September 2016, new GCSEs will be taught in: ancient languages, art and design, biology, chemistry, citizenship studies, computer science, dance, double science, drama, food preparation and nutrition, geography, history, modern foreign languages, music, physical education, physics and religious studies. These changes are outlined in the Summary of changes to GCSEs from 2015 guidance document.
Senior leaders were asked how confident their school was to teach the second wave of new GCSE subjects from 2016. Three-fifths of senior leaders (60 per cent) were ‘very confident’ (9 per cent) or ‘fairly confident’ (51 per cent). Just over a quarter (26 per cent) were ‘neither confident nor unconfident’. Around one in ten were ‘not at all confident’ (11 per cent).
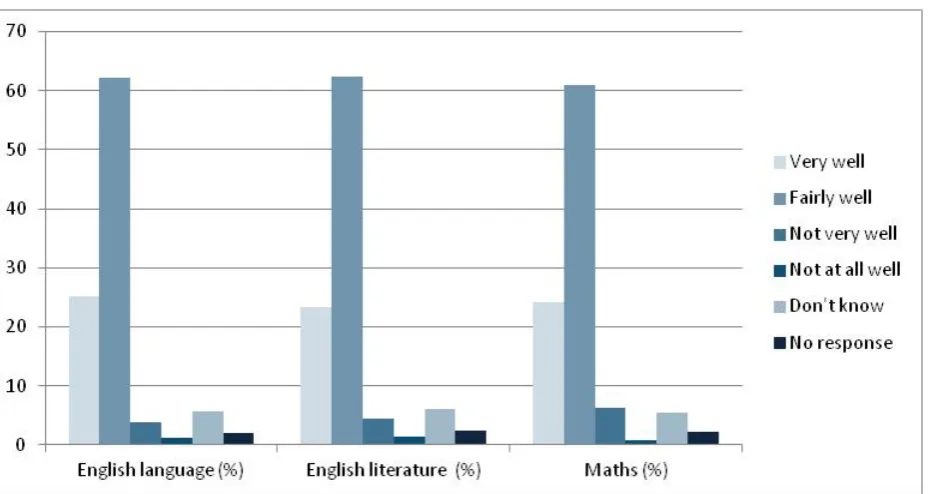
Senior leaders were also asked how well the preparation and start of teaching had gone for the new GCSEs in English language, English literature and mathematics from
September 2015. As shown in Figure 4 overleaf, very similar responses were received for the three subjects with just over three-fifths for all subjects (62 per cent for both English subjects and 61 per cent for mathematics) responding that the preparation and start of teaching had gone ‘fairly well’. Around a quarter reported that it had gone ‘very well’ (25 per cent for English language, 23 per cent for English literature and 24 per cent for mathematics). A minority of senior leaders reported that it had gone ‘not very well’ or ‘not at all well’ (5 per cent for English language, 6 per cent for English literature and 7 per cent for mathematics).
Figure 4: How well has the preparation and start of teaching gone in your school for the new GCSEs?
Source: Teacher Voice Omnibus Survey November 2015 and Senior Leader Booster November 2015
In the previous wave of the Omnibus Survey (June 2015), senior leaders were asked a similar question about their levels of confidence in teaching these three new GCSEs. Responses provided were similar to those given in relation to the preparation and start of teaching these subjects in this wave, suggesting that levels of confidence were reflected in experiences of implementation. Just over three-fifths of senior leaders reported that they were ‘fairly confident’ in teaching the new GCSEs (62 per cent for English literature and 61 per cent for English language and maths) which compared to a similar proportion reporting that the preparation and start of teaching these subjects had gone ‘fairly well’. In addition, around a quarter reported that they were ‘very confident’ in teaching these subjects (27 per cent for English language, 26 per cent for English literature and 24 per cent for maths) which compared to a similar proportion reporting that the preparation and start of teaching had gone ‘very well’.
Accountability reforms
Primary floor standard
In primary schools, there has been a move away from an absolute measure of progress (i.e. pupils being expected to make two levels of progress between Key Stage (KS)1 and Key Stage (KS) 2) to a relative measure in which pupils’ progress is compared against pupils with a similar baseline (i.e. the same KS1 average point score). At the same time, KS2 test outcomes will be reported on a scaled score, where the expected standard is 100.
The floor standard for a school defines the minimum standards for pupil achievement and/or progress that the Government expects schools in that particular phase of education to meet. If a school’s performance falls below this floor standard, then the school may come under scrutiny through inspection. In 2016, primary schools will be above the floor standard if more than 65 per cent of their pupils achieve the expected standard in reading, writing and mathematics, or the schools has sufficient progress scores in all of reading and writing and mathematics. ‘Sufficient progress’ will be
calculated using a value-added measure from KS1 to KS2. The precise level of ‘sufficient progress’ that a school needs to achieve will not be set until the first new KS2 tests are sat in summer 2016. Details of the new floor standard are laid out in the DfE primary technical guidance document.
Primary senior leaders were asked what steps they had taken to prepare for the new primary floor standard. As Figure 5 shows, the majority reported that they had changed the curriculum covered (69 per cent) and changed the way in which they monitored pupil progress (60 per cent). More than two-fifths had also developed new teaching strategies focusing on high attainers (43 per cent) and on low attainers (42 per cent). The most common additional strategies reported by respondents included: developing assessment, targeted interventions (e.g. via involvement in PiXL (Partners in Excellence)),
involvement of parents, and appointing additional staff.
Figure 5: What steps have you taken to prepare for the new primary floor standard?
Source: Teacher Voice Omnibus Survey November 2015 and Senior Leader Booster November 2015
Secondary: Progress 8
In October 2013, the Department announced a new secondary school accountability framework to be implemented in 2016. This includes two new headline measures:
Attainment 8 and Progress 8. These replace the previous measure which focused on the number of pupils achieving at least 5 A*-C grades, including in English and mathematics, at GCSE.
Attainment 8 measures pupil achievement across eight subjects including mathematics and English (both of which will be double-weighted1), three further qualifications that
count in the English Baccalaureate (EBacc)2 and three further qualifications which can be
GCSE qualifications or any non-GCSE qualifications on the DfE approved list. A
Progress 8 score will be calculated for each pupil by comparing their achievement – their
1 English will only be double weighted if the pupil has taken English literature and English language or, for the last time in 2016, combined English.
2 To gain the EBacc, pupils need to achieve GCSEs grades A*-C or the equivalent in the new 9-1 grading structure in: English (either language or literature); mathematics; history or geography; two sciences (different combinations of science GCSEs which are equivalent to two GCSEs incorporating study of biology, physics and chemistry); and a language. Further information is available on the school and college performance tables website.
Attainment 8 score – with the average Attainment 8 score of all pupils nationally who had a similar starting point, calculated using assessment results from the end of primary school. The greater the Progress 8 score, the greater the progress made by the pupil compared to the average of pupils with similar prior attainment. A school’s Progress 8 score is the mean average of its pupils’ Progress 8 scores. It will give an indication as to whether pupils in the school have made above or below average progress compared to similar pupils in other schools. The DfE Progress 8 measure guide contains more information about these changes.
In the light of the introduction of Progress 8, secondary school senior leaders were asked if they had plans to focus resources on different groups of pupils. The majority (62 per cent) planned to carry on as usual. Where schools were making changes, most were planning to focus more on high attainers (GCSE grade B or higher) (19 per cent) rather than low attainers (GCSE E grade or lower) (7 per cent) or middle attainers (GCSE grades C and D) (3 per cent).
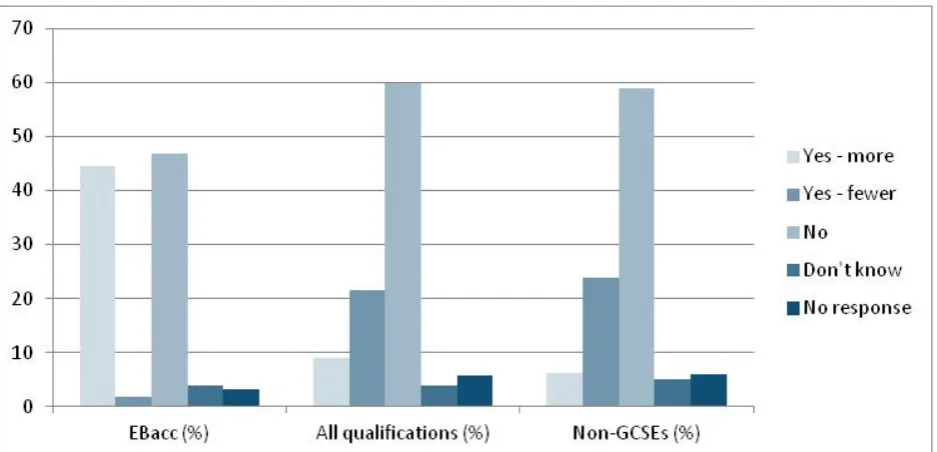
Secondary senior leaders were also asked if the reforms for 2016 had encouraged their school to enter some Year 9 pupils for a different number of EBacc qualifications, a different number of qualifications in total, or a different number of non-GCSE
qualifications than previously. The findings are presented in Figure 6.
In terms of the EBacc, similar proportions of senior leaders reported that they were not entering Year 9 pupils for more qualifications (47 per cent) or were entering Year 9 pupils for more qualifications (44 per cent). Regarding the total number of qualifications that Year 9 pupils were being entered for, the majority of senior leaders (60 per cent) were maintaining the status quo, with a fifth (22 per cent) entering pupils for fewer
qualifications and 9 per cent entering pupils for more qualifications. It was a similar
picture for non-GCSE qualifications, with 59 per cent reporting that they were maintaining the status quo and just less than a quarter (24 per cent) reporting that they were entering Year 9 pupils for fewer qualifications and only 6 per cent entering pupils for more
qualifications.
Figure 6: Have the accountability reforms for 2016 encouraged your school to enter some Year 9 pupils for a different number of qualifications than previously?
Source: Teacher Voice Omnibus Survey November 2015 and Senior Leader Booster November 2015
Secondary senior leaders were asked the same set of questions in the previous Omnibus Survey wave in June 2015. Interestingly, a slightly higher proportion of senior leaders in the previous wave reported that the accountability reforms had encouraged them to enter some Year 9 pupils for more EBacc qualifications (51 per cent as opposed to 44 per cent in this wave). In addition, a higher proportion reported being encouraged to enter some Year 9 pupils for more qualifications than previously (15 per cent as opposed to 9 per cent in this wave). In relation to non-GCSE qualifications, senior leaders in the previous wave were placing less emphasis on non-GCSE qualifications than the current wave, with 36 per cent as opposed to 24 per cent in the current wave entering pupils for fewer non-GCSE qualifications. Around the same proportions (7 per cent in the previous wave and 6 per cent in the current wave) were entering pupils for more non-GCSE
qualifications.
Careers and apprenticeships
Careers
There is a statutory duty on schools to secure independent careers guidance for all year 8-13 pupils (from 12/13 to 17/18 years). This includes:
• providing access to a range of activities that inspire young people, including employer talks, careers fairs, motivational speakers, college and university visits, coaches and mentors
• building strong links with employers and offering high-quality work experience
• access to advice on options post-16 such as apprenticeships and vocational routes
• face-to-face advice and guidance
Careers guidance in schools has long been criticised as being of variable quality and patchy and, as a result, Ofsted has been giving careers guidance a higher priority in school inspections since September 2013.
In September 2014, the Secretary of State for Education announced the creation of a new careers and enterprise company. The core purpose of this company is to broker relationships between employers and schools/colleges, in order to ensure that young people are provided with the inspiration and guidance they need for success in working life. Young people aged 13 years and over can also access information and advice about education, training and work support from the National Careers Service via a website, helpline and webchat. Further information can be found in the DfE guidance document Careers guidance and inspiration in schools.
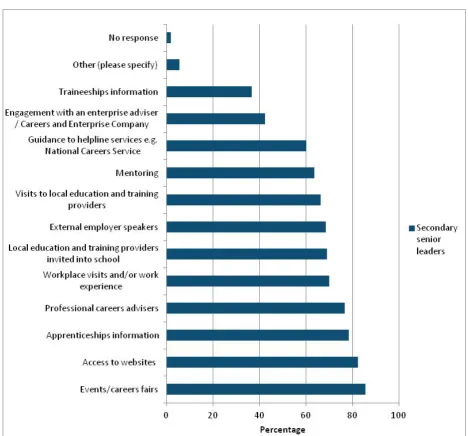
Senior leaders in secondary schools were asked what activities they provided as part of their careers programme to help young people make informed choices about their post-16 options. As Figure 7 shows, more than three-quarters of senior leaders reported that they provided:
• events/careers fairs (86 per cent)
• access to websites which show all the options available (82 per cent)
• apprenticeships information (78 per cent)
• support from professional careers advisers (77 per cent)
These activities were followed by visits into and out of school including:
• local education and training providers being invited into school (69 per cent)
• external employer speakers coming into school (68 per cent)
• visits to local education and training providers (66 per cent)
[image:26.595.55.524.247.683.2]Lower proportions of secondary senior leaders reported that they provided information on traineeships (37 per cent) or engaged with an enterprise adviser/Careers and Enterprise Company (42 per cent). ‘Other’ activities mentioned included internships and careers-related courses/programmes, interview practice and developing skills for employment (e.g. leadership).
Figure 7: Which of the following activities and services do you provide as part of your careers programme to help young people make informed choices about their post-16 options?
Source: Teacher Voice Omnibus Survey November 2015 and Senior Leader Booster November 2015
Apprenticeships
Apprenticeships provide young people with another route to continuing onto full-time study post-16 and combine practical training and work-experience with study. They are available in a wide range of vocational areas – around 170 industries covering over 1,500 job roles. Apprenticeships are available in four levels: Intermediate, Advanced, Higher and Degree and take between one and five years to complete. There has been a recent government commitment to reach three million new apprenticeship starts in England by 2020, and the government Guide to Apprenticeships contains further details.
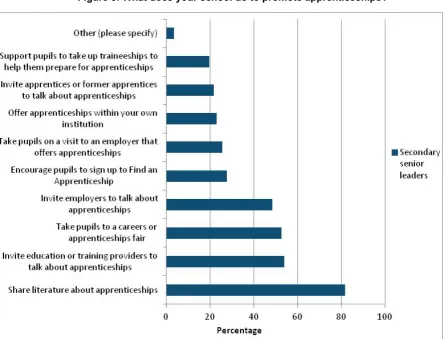
[image:27.595.61.505.335.674.2]Secondary senior leaders were asked what their school did to promote apprenticeships. As Figure 8 shows, the main way was sharing literature about apprenticeships, reported by more than four-fifths (82 per cent) of respondents. Around a half of senior leaders also reported inviting education or training providers into school to talk about apprenticeships (54 per cent), taking pupils to a careers or apprenticeships fair (53 per cent), and inviting employers into school to talk about apprenticeships (48 per cent).
Figure 8: What does your school do to promote apprenticeships?
Source: Teacher Voice Omnibus Survey November 2015 and Senior Leader Booster November 2015
When asked what would help their school to promote apprenticeships, the majority of secondary senior leaders reported that they would like a free online tool for pupils to
search and apply for apprenticeship vacancies (66 per cent) as well as a mechanism to match schools/colleges with employers offering apprenticeships and willing to speak to students (62 per cent). In addition, just over two-fifths of senior leaders (44 per cent) reported that they would like more online information for teachers about apprenticeships.
Building pupils’ character, resilience and active
learning
The government has a current focus on building character and resilience in pupils. This is part of its mission to give all children, regardless of background, the chance to fulfil their potential and achieve their high aspirations. This mission is to be achieved as children interact daily with teachers and staff, through the curriculum, and also through
participation in extra-curricular activities. Voluntary organisations and business are also seen as having key roles to play in building lasting partnerships with schools which support the development of the types of skills the modern economy needs. As part of its £3.5 million Character Grants scheme for 2015/16, the DfE is providing grants to expand initiatives that successfully improve the character of young people and expects to
improve the lives of 150,000 children in more than 1,100 schools.
In the context of this government focus, senior leaders in primary and secondary schools were asked about the number of extra-curricular activities they provided in a range of areas: ICT, sport/games/exercise, arts and crafts, academic subject-related clubs (e.g. science, history), music, drama/dance/film, homework and volunteering. They were also asked about their links and activities with employers and voluntary organisations. As might be expected considering their larger size and pupil roll, senior leaders in secondary schools reported offering a larger number of extra-curricular activities than their counterparts in primary schools in all areas of interest. The highest number of activities offered was in sport/games/exercise in both phases of education, with 83 per cent of senior leaders in secondary schools and 39 per cent of senior leaders in primary schools reporting that they offered ‘more than five’ activities in this curriculum area. Following sport/games/exercise, secondary schools offered the most activities in: academic subjects (such as science and history); music; and homework. The following proportions of senior leaders reported offering ‘more than five’ activities in these areas:
• academic subjects: 49 per cent
• music: 38 per cent
• homework: 32 per cent (with an additional 10 per cent offering ‘five’ activities) In terms of other extra-curricular provision in secondary schools, 45 per cent of senior leaders reported offering ‘two’ or ‘three’ activities in arts/crafts. In addition, around a half of secondary senior leaders reported offering ‘one’ or ‘two’ activities in ICT (60 per cent) and drama/dance/film (46 per cent). Regarding volunteering, there was a mixed picture across secondary schools. Twenty per cent of senior leaders reported that they offered ‘more than five’ volunteering activities whilst 16 per cent offered ‘none’ and 30 per cent
offered ‘one’ or ‘two’ activities. Another commonly mentioned club offered in secondary schools was outdoor learning/survival skills/Duke of Edinburgh/adventure.
Following sport/games/exercise, primary schools offered the most activities in music. Five per cent of senior leaders reported offering ‘more than five’ activities in music, whilst an additional 16 per cent offered ‘three’, ‘four’ or ‘five’ activities. However, the largest proportion (61 per cent) reported offering ‘one’ or ‘two’ activities in music. In the other curricular areas, the majority of senior leaders reported offering ‘one’ or ‘two’ activities: arts/crafts (66 per cent); ICT (62 per cent); drama/dance film (63 per cent); and academic subjects (53 per cent). Large proportions of senior leaders in primary schools reported that they did not offer any activities related to volunteering (67 per cent) and homework (40 per cent). Where homework activities were offered in primary schools, there tended to be just ‘one’ activity offered (35 per cent). Other commonly mentioned clubs offered in primary schools focused on cookery, gardening/nature/wildlife and chess.
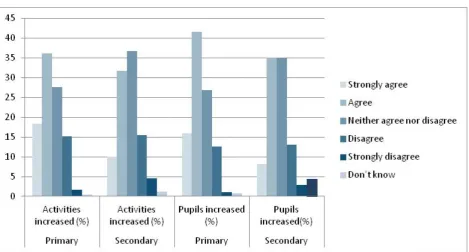
Senior leaders in primary and secondary schools were also asked to what extent the extra-curricular activities offered to pupils by their institution had increased in the last 12 months, as well as to what extent the number of pupils taking up activities had increased. Just under half of all senior leaders (48 per cent) ‘strongly agreed’ or ‘agreed’ that their range of extra-curricular activities had increased in the last 12 months. The proportion of primary senior leaders strongly agreeing and agreeing to this statement was higher than that of their counterparts in secondary schools (55 per cent as opposed to 42 per cent). Around a third of senior leaders across both phases of education (32 per cent) ‘neither agreed nor disagreed’ that the number of activities had increased, whilst 19 per cent ‘disagreed’ or ‘strongly disagreed’ with the statement.
As might be expected, there was a similar picture regarding the number of pupils taking up extra-curricular activities. Half of all senior leaders (50 per cent) ‘strongly agreed’ or ‘agreed’ that the number of pupils taking up extra-curricular activities had increased, with a higher proportion of primary than secondary senior leaders responding in this way (57 per cent as opposed to 43 per cent).
Figure 9 below shows the responses of senior leaders in primary and secondary schools to the two questions on extra-curricular activities.
Figure 9: To what extent do you agree that: the range of extra-curricular activities my institution offers pupils has increased in the last 12 months; and the number of pupils taking up
extra-curricular activities has increased
Source: Teacher Voice Omnibus Survey November 2015 and Senior Leader Booster November 2015
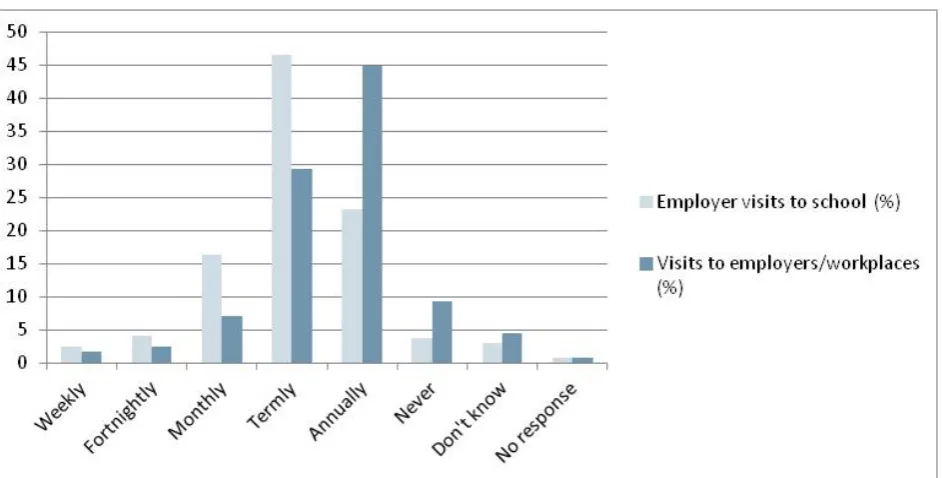
Senior leaders in secondary schools were asked about the frequency of visits to school by employers and pupil visits to employers/places of work over the last 12 months. The results are presented in Figure 10 below. In terms of employer visits into school to work with pupils, these tended to take place termly (with 47 per cent reporting this) or annually (23 per cent). Around a quarter of senior leaders (23 per cent) reported visits taking place on a weekly, fortnightly or monthly basis.
Regarding pupil visits out of school to employers/workplaces, these tended to take place annually (with 45 per cent reporting this) or termly (29 per cent). Nine per cent of senior leaders reported that these types of visits ‘never’ took place.
Figure 10: How often have the following taken place over the last 12 months: visits to your school by employers to work with pupils; and pupil visits to employers/places of work?
Source: Teacher Voice Omnibus Survey November 2015 and Senior Leader Booster November 2015
Secondary senior leaders were also asked about the frequency of visits to school by voluntary organisations to talk to pupils as well as pupils’ off-site visits to voluntary organisations over the last 12 months. The results are presented in Figure 11 below. In terms of visits into school by voluntary organisations to work with pupils, these tended to take place termly (with 48 per cent reporting this), with a fifth of senior leaders (20 per cent) reporting that they took place annually. Just over a quarter of senior leaders (26 per cent) reported visits taking place on a weekly, fortnightly or monthly basis. In terms of pupil visits out of school to voluntary organisations, these tended to take place termly (with 30 per cent reporting this) or annually (25 per cent). Eleven per cent of senior leaders reported that they ‘never’ took place and a further 15 per cent did not know.
Figure 11: How often have the following taken place over the last 12 months: visits to your school by voluntary organisations to work with pupils; and pupil visits to voluntary organisations?
Source: Teacher Voice Omnibus Survey November 2015 and Senior Leader Booster November 2015
In addition, secondary senior leaders were asked to think about the employer with which they had been working the longest with regards to visits and to say how long they had been working with this specific employer. The vast majority (70 per cent) reported that they had been working with this employer for a year or more. When asked the same question in terms of voluntary organisations, a similar response emerged. Two-thirds (66 per cent) of senior leaders reported that they had been working with a specific voluntary organisation for a year or more.
Alternative provision
Alternative provision (AP) is: education arranged by local authorities for pupils who, because of exclusion, illness or other reasons, would not otherwise receive suitable education; education arranged by schools for pupils on a fixed period exclusion; and off-site provision sought by schools to improve pupils’ behaviour. Any school that is
established or maintained by a local authority to discharge the above duty is called a Pupil Referral Unit (PRU). PRUs may now apply to become AP Academies. A range of other organisations such as FE colleges, training organisations, private organisations, independent schools, charities and individual specialists provide alternative provision. Independent, voluntary sector providers may apply to become AP Free Schools. According to the 2013 DfE statutory guidance document, the focus of alternative
provision is to ensure that the child continues to receive a good quality of education, on a par with the mainstream, whilst the needs which require intervention are addressed. Senior leaders in primary and secondary schools were asked how confident they were in commissioning alternative provision for pupils. The largest proportion (42 per cent) reported that they were ‘fairly confident’, with a fifth (21 per cent) being ‘very confident’. Fifteen per cent were ‘neither confident nor not confident’ with 14 per cent being ‘not very confident’ or ‘not at all confident’. Responses were fairly similar across primary and secondary respondents, although a higher proportion of senior leaders in secondary schools than in primary schools reported that they were ‘very confident’ (27 per cent as opposed to 15 per cent).
Senior leaders in both school phases were also asked where they commissioned alternative provision from. As Figure 12 shows, the largest proportion commissioned provision from their local authority Pupil Referral Unit (56 per cent), followed by private organisations/individuals (27 per cent) and FE colleges (20 per cent).
Primary schools tended to mainly rely on their local authority Pupil Referral Units, private organisations/individuals and ‘other’ provision which included other schools, local
authority provision and specific programmes/specialists based on individual need. Higher proportions of senior leaders in secondary schools reported using a wide range of
provision such as Alternative Provision Academies/Free Schools and charities. ‘Other’ provision most commonly sought by secondary schools included enhanced mainstream service/in-house alternative provision, other schools, specific programmes/specialists based on individual need and local authority provision.
Figure 12: From which of the following do you commission alternative provision?
Source: Teacher Voice Omnibus Survey November 2015 and Senior Leader Booster November 2015
Senior leaders in both phases of education were also asked if they had commissioned alternative providers to help them manage pupils with behavioural problems who could not be managed in school. Around a third reported doing this ‘occasionally’ (32 per cent), with about a quarter reporting ‘very rarely (24 per cent). Secondary schools were more likely to commission this type of provision than primary schools. A quarter of secondary schools (25 per cent) compared to 7 per cent of primary schools commissioned this type of provision ‘very frequently’ or ‘frequently’. In addition, two-fifths of secondary schools (39 per cent) as opposed to just over a quarter (26 per cent) of primary schools
commissioned it ‘occasionally’. A fifth of senior leaders in primary schools (19 per cent) reported that they ‘never’ commissioned this type of provision, with 45 per cent reporting that they commissioned it ‘very rarely’ or ‘rarely’.
In addition, primary and secondary senior leaders were asked if they were happy with the quality of alternative provision in their area. There were mixed views on this question with 36 per cent responding ‘strongly agree’ or ‘agree’, 31 per cent responding ‘disagree’ or ‘strongly disagree’ and just over a fifth (23 per cent) responding ‘neither agree nor disagree’. As Figure 13 shows, there were fairly similar levels of agreement and disagreement from senior leaders in primary and secondary schools.
Figure 13: To what extent would you agree with the following statement – I am happy with the quality of alternative provision providers in my area?
Source: Teacher Voice Omnibus Survey November 2015 and Senior Leader Booster November 2015
Finally, senior leaders in primary and secondary schools were also asked if they were involved in decisions about the organisation and commissioning of alternative provision for their school. Over half (54 per cent) ‘strongly agreed’ or ‘agreed’ that they were, with a fifth (24 per cent) reporting that they were not. Levels of agreement and disagreement were fairly similar across primary and secondary schools.
Prevent
Since 1 July 2015, all schools are now subject to a duty under section 26 of the Counter-Terrorism and Security Act 2015 to have “due regard to the need to prevent people from being drawn into terrorism”. This is known as the Prevent duty. Protecting children from radicalisation is seen as part of schools’ wider safeguarding duties. Schools can also build pupils’ resilience to radicalisation by promoting fundamental British values and enabling them to challenge extremist views. However, it is important that schools provide a safe space in which pupils can understand the risks associated with terrorism and develop the knowledge and skills to be able to challenge extremist arguments. In line with this new duty, Ofsted’s revised common inspection framework from September 2015 makes reference to the need for schools to have safeguarding arrangements to promote pupils’ welfare and clear procedures in place to prevent radicalisation and extremism. Further information about the duty can be found in the Departmental advice for schools and childcare providers.
Senior leaders and classroom teachers were asked how confident they were in
implementing the new duty on schools to ‘have regard to the need to prevent children and young people from being drawn into terrorism’. As Figure 14 shows, over four-fifths of senior leaders (83 per cent) were ‘very confident’ (30 per cent) or ‘fairly confident’ (53 per cent) in implementing the new duty. Only six per cent were ’not very confident’ (5 per cent) or ‘not at all confident’ (1 per cent). Almost no senior leaders were unaware of the new duty. Classroom teachers were less confident than senior leaders in implementing the new duty, with just over half (52 per cent) reporting that they were ‘very confident’ (17 per cent) or ‘fairly confident’ (35 per cent) in implementing it. Seventeen per cent were ‘not very confident’ (11 per cent) or ‘not at all confident’ (6 per cent) in implementing the new duty, with 7 per cent being unaware of it.
Secondary staff tended to be a little more confident than primary staff in implementing the new duty; 71 per cent of secondary staff reported that they were ‘very confident’ or ‘fairly confident’ as opposed to 63 per cent of primary staff. In addition, senior leaders in both secondary and primary schools were more confident than classroom teachers in
implementing this new duty. Thirty per cent of senior leaders as opposed 17 per cent of classroom teachers were ‘very confident’ and 53 per cent as opposed to 35 per cent were ‘fairly confident’ in implementing the new duty.
Figure 14: How confident are you in implementing the new duty on schools to ‘have regard to the need to prevent children and young people from being drawn into terrorism’?
Source: Teacher Voice Omnibus Survey November 2015 and Senior Leader Booster November 2015
Physical activity
As set out in the statutory guidance for the National Curriculum for physical education in England, ‘a high-quality physical education curriculum inspires all pupils to succeed and excel in competitive sport and other physically-demanding activities’. It should provide opportunities for pupils to become physically confident in a way which supports their health and fitness. The national curriculum for physical education (PE) aims to ensure that all pupils:
• develop competence to excel in a broad range of physical activities
• are physically active for sustained periods of time
• engage in competitive sports and activities
• lead healthy, active lives
In Ofsted’s 2013 report focusing on PE3, schools with the best PE provision were seen to
be those which enabled pupils to achieve well by providing ‘an ever increasing range of extra-curricular and traditional activities’.
Senior leaders in primary and secondary schools were asked how long most pupils in their school spent on a range of physical activities in a week. This included PE,
sport/active clubs, dance, and physical activity at lunch and break times. Figure 15 shows the responses for each activity by phase of education.
In relation to PE, the majority of senior leaders (65 per cent) reported that their pupils spent ‘more than an hour and up to two hours’ on this activity. However, a quarter (25 per cent) reported a longer time spent on PE - ‘more than two hours and up to three hours’. The picture was similar for primary and secondary schools.
Senior leaders in both phases of education were also asked how long most pupils spent on sport/active clubs in a typical week. Nearly half (46 per cent) reported that pupils spent ‘more than 30 minutes and up to an hour’ on these activities. However, a quarter (25 per cent) reported pupils spending longer on this activity - ‘more than an hour and up to two hours’. A higher proportion of senior leaders in secondary schools than in primary schools reported that their pupils spent a longer time on sport/active clubs i.e. ‘more than an hour and up to two hours’ (29 as opposed to 22 per cent).
In terms of time spent on dance activities in a typical week, a third of senior leaders (34 per cent) reported that pupils spent ‘more than 30 minutes and up to an hour’, whilst 27
3 Ofsted (2013). Beyond 2012 - Outstanding Physical Education for All. Physical Education in Schools 2008–12.
London: Ofsted.
per cent reported that pupils spent less time i.e. ‘up to 30 minutes’. However, 17 per cent reported that no time was spent on dance, with a higher proportion of senior leaders in secondary compared to primary schools reporting this (21 per cent as opposed to 12 per cent).
[image:40.595.58.496.322.671.2]Regarding time spent on physical activities during lunch and break, just over a third of senior leaders (34 per cent) reported that pupils spent ‘more than 30 minutes and up to an hour’. A fifth (22 per cent) reported pupils spending less time i.e. ‘up to 30 minutes’ and 15 per cent reported pupils spending more time i.e. ‘more than an hour and up to two hours’. Senior leaders in primary schools reported pupils spending more time on physical activities during lunch and break times than their counterparts in secondary schools. More than a quarter (27 per cent) of senior leaders in primary schools reported pupils spending more than two hours on this activity compared to 12 per cent in secondary schools.
Figure 15: How many hours in a typical week do pupils spend on: PE, sport/active clubs, dance and physical activity at lunch/break?
Source: Teacher Voice Omnibus Survey November 2015 and Senior Leader Booster November 2015
A small number of senior leaders reported running physical activity at other times of the day, such as ‘Wake up, shake up’ sessions before school.
English as an additional language (EAL)
English as an additional language (EAL) is a commonly used term in schools for pupils whose first language is not English. In 2015, around 19 per cent of primary school pupils and 15 per cent of secondary school pupils in England had a main language other than English, with this figure rising every year4. There has been a substantial increase in the
numbers of EAL pupils in schools in recent years, presenting challenges for educating children whose first language may be any one of a vast array of other languages. As laid out in the DfE’s Developing Quality Tuition guidance, schools are encouraged to offer specific learning provision for EAL pupils to ensure access to the curriculum content alongside the teaching of English.
Senior leaders were asked what specific learning provision they offered for English as an additional language (EAL) pupils. As Figure 16 shows, between a third and a half
reported that they undertook scaffolding in curriculum subjects (49 per cent), provided intensive catch up support on an individual basis (42 per cent), provided one-to-one tuition (34 per cent), and had an EAL coordinator (34 per cent). Some differences were seen by phase of education. A quarter of senior leaders in primary schools (24 per cent) reported that their school did not offer specific learning provision for EAL pupils; some of these schools did not have any EAL pupils. Higher proportions of senior leaders in
secondary schools than their counterparts in primary schools reported offering a range of different types of provision. A large number of primary schools drew on ‘Other’ provision such as local authority support, provided support to pupils in small groups and drew on EAL and other teaching assistants.
4Department for Education (2015). Schools, pupils and their characteristics: January 2015. [Online]
Figure 16: What specific learning provision, if any, does your school offer for English as an additional language (EAL) pupils?
Source: Teacher Voice Omnibus Survey November 2015 and Senior Leader Booster November 2015
Vocational programmes
The government is currently reforming the vocational qualification system to ensure more rigorous and responsive programmes which are endorsed by employers and universities. Advanced (Level 3) qualifications have been re-categorised as ‘Applied General’ and ‘Technical Levels’ are advanced level programmes preparing young people for specific jobs. The DfE Performance tables documentation contains further information on Applied General qualifications and on Technical levels. There is also the addition of the Technical Certificate (Level 2) and Technical Baccalaureate (Level 3), providing further vocational routes.
[image:43.595.56.518.397.708.2]Senior leaders in secondary schools were asked how employers were involved in the delivery of vocational programmes. As Figure 17 shows, the most common way was through providing work experience or work placements, reported by 70 per cent of respondents. This was followed by employers delivering training at the school or college (44 per cent) and employers providing mentoring to pupils (29 per cent). Other ways in which employers contributed included involving themselves in the governance or strategic planning of the school (reported by 17 per cent of respondents), providing specialist equipment (reported by 14 per cent) and contributing to the assessment of pupils (reported by 10 per cent).
Figure 17: How are employers involved in the delivery of vocational programmes?
Source: Teacher Voice Omnibus Survey November 2015 and Senior Leader Booster November 2015
Annex 1: Supporting information
How was the survey conducted?
This report is based on data from the November 2015 and autumn 2015 booster surveys. A total of 1,920 practising teachers from 1,549 schools in the maintained sector in
England completed the survey. Teachers completed the November survey online between 6th and 11th November 2015, and the booster survey online and on paper between 20th November and 11th December 2015.
What was the composition of the panel?
The panel included teachers from the full range of roles in primary and secondary schools, from headteachers to newly qualified class teachers. Forty eight per cent (917) of the respondents were teaching in primary schools and 52 per cent (1003) were teaching in secondary schools. In terms of roles, there was a fairly even spilt between senior leaders (defined as headteachers, deputy headteachers and assistant
headteachers) and classroom teachers. There were 965 senior leaders (just over 50 per cent) and 955 classroom teachers (just less than 50 per cent).
How representative of schools nationally were the schools
corresponding to the teachers panel?
There were no significant difference between the primary school sample and primary school population in terms of eligibility for free school meals. In the sample of secondary schools there was over-representation in the lowest and middle quintiles and under-representation in the other quintiles in terms of eligibility for free school meals. In the overall sample (primary and secondary schools) there was no significant difference
between the combined sample of primary and secondary schools and all schools in terms of eligibility for free school meals. To address the non-representativeness of the
secondary sample, weights were calculated using free school meals data and then applied to the secondary sample to create a more representative sample of schools.5
Tables S.1, S.2 and S.3 show the representation of the (weighted) achieved sample against the population. Tables S.4 and S.5 show the representation of the (weighted) teacher sample by role in non-academies and academies respectively.
5 We did not apply a weighting to schools for which free school meals data was unavailable in the Register of Schools.