1
Vocational and Technical
Qualifications: assessment
functioning of examinations in
performance table qualifications
performance table qualifications
2
Authors
performance table qualifications
3
Contents
1. Executive Summary ... 4
2. Introduction ... 4
3. Method ... 5
Sample of external assessments ... 5
3.1 Data and analysis ... 6
3.2 Capturing subject matter expert views ... 6
4. Analysis outcomes ... 8
4.1 Summary of profiles of item functioning within tests ... 8
4.2 Summary of test functioning ... 13
4.3 Subject matter expert findings ... 17
5. Discussion ... 17
6. Concluding comments ... 19
table qualifications
4
1. Executive Summary
This is the second tranche of analyses to establish the assessment functioning of a range of
examined units for vocational qualifications which appear on performance tables (for a summary of the first tranche see Ofqual, 2017).
This tranche focuses on 20 examinations from Level 3 qualifications in performance tables, specifically Applied Generals and Tech Levels. From 2017, external assessment became
mandatory in Applied General qualifications and in Tech Levels (40% and 30% respectively). This tranche focuses on particular subject areas (applied science, business, digital media, engineering, health and social care, IT and computing, and sport), and has also involved subject matter experts to consider the quality of the assessments alongside the test and item (question) functioning. As with the previous work in this area, it does not focus on a detailed consideration of the content of the specification, teaching time or delivery, or indeed the processes by which the assessments are constructed. The focus is very much on the quality of the functioning of the assessments.
The technical functioning of tests and items contained within a test is important because tests which categorise students (for example, distinction/merit/pass/fail) need to function in a way which ensures the categorisation is based upon trustworthy items and that will lead to valid interpretation of individual students’ marks and grades.
Overall, we found that the majority of tests (65%) functioned well or reasonably well. Compared to previous tranche of item and test functioning analyses, there were more tests in this sample which had a significant proportion of items which were classed as ‘difficult’ by the analyses. The input of the subject matter experts for these tests tended to suggest that for most of the assessments the nature of the items, their targeted level, and the sources of difficulty within the items and overall tests were broadly appropriate. This implies that in some cases the empirical item difficulties were a result of other factors such as candidates may not being not fully prepared at the point they took the assessment. The experts identified issues, however, in a small number of assessments
around the quality of the mark scheme, the question papers’ targeting at the appropriate level, the ability to discriminate across the target cohort of students and the percentage of content sampled from the specification.
2. Introduction
Any assessment is an activity to collect evidence from students in respect of their ability and attainment (knowledge, skills and understanding) with a particular subject domain and at a
particular level. Examinations are a particular form of assessment where the question paper as a whole and the individual questions or items within that should be inviting or eliciting from students the evidence that they can individually provide in respect of their own attainment within that
subject. As such, examinations are a very particular tool in the assessment toolbox.
table qualifications
5
Much research in the past has pointed to examinations (both item writing and test construction) as both a science and an art. In some countries, high-stakes tests and examinations are mainly or routinely pre-tested to ensure that each item and the test as a whole functions appropriately. Pre-testing helps to ensure that only those items are included which, as well as satisfying the coverage of the syllabus or specification content, display features of appropriate measurement
characteristics such as item difficulty and differentiating between students on the basis of their ability. However, in England, many high-stakes tests and items are not pre-tested. In this
scenario, understanding of the item and test functioning from one session can be used to enhance item writing and test construction for subsequent sessions. This feedback loop is important for AOs to undertake and the work presented here is intended to underline the importance of this. Furthermore, even where items are pre-tested, it is still necessary to keep a watching brief to understand whether items continue to function as originally intended. In this way, the science of item functioning can inform the art of item writing and test construction.
The previous work conducted by Ofqual looked at 49 external assessments from 27 qualifications. These qualifications represented predominantly Level 1 and 2 qualifications, but also some Level 3, across a range of subjects and 7 different AOs. Overall, we found that the majority of tests (over 70%) functioned well or reasonably well, but that there were some tests which had poor
functioning either because too many items within the test had poor functioning and/or because the test design was suboptimal (for example, too few items in the test). Each AO received individual
reports summarising how their units performed and had to have due regard to this evidence.1
Our intention is to conduct such work annually, on a sample of external assessments in the
vocational and technical area. This year, we focused on Level 3 qualifications since in the previous year these figured less prominently in the sample. The subject areas included in the sample were:
health and social care
applied science
sport
business
digital media
IT and computing
engineering
The qualifications and tests sampled represented the higher entry qualifications at Level 3 in these areas and more were in the Applied Generals category than in the Technical certificate category.
3. Method
Sample of external assessments
We focused the sample on Level 3 performance table qualifications. We drew the proposed sample of qualifications based on provisional entry data received ahead of the awards for Level 3 Applied General and Tech Level qualifications in summer 2017, many of which were new and being awarded for the first time. External assessment was mandatory in Applied General qualifications (40 per cent) and Tech Levels (30 per cent) from 2017.
table qualifications
6
3.1 Data and analysis
For each examined unit in the sample, we asked for anonymised candidate level data for 2017 at item level and at test level.
The item and test analyses used are well-established ways of evaluating test functioning, and described in some detail below in Table 1. Ideal values were the same as those in the previous cycle (Ofqual, 2017) and based upon the professional judgement of the Research and Analysis and the Standards teams in Ofqual, guided by the test construction literature (for example, Ebel and Frisbie, 1991, Haladyna and Rodriguez, 2013, Opposs and He, 2013). These ideal values are a guide for test and item functioning, rather than absolute thresholds that rigidly define the
difference between high quality and poor quality items or tests, without taking any other contextual information into account. In some contexts items with values (slightly) outside these ideal values may be acceptable. Also, these ideal values assume both the test is broadly appropriately targeted and the learners have been adequately prepared. Thus, use of such ideal values or benchmarks
provide a useful shorthand to begin to evaluate the test functioning.
3.2 Capturing subject matter expert views
We also recruited subject matter experts in each of the subjects to carry out a qualitative evaluation of the question papers and mark schemes. All subject matter experts attended a briefing meeting explaining the objective of the work as well as how to carry out the qualitative evaluations. For each of the units, the subject matter experts had to answer a series of questions on the content and construct of the assessment; the overall level of demand of the assessment and how well it discriminates; the quality of the question paper and mark scheme; and finally the pre-release arrangements, where available. Subject matter experts reviewed one or more units in their subject of expertise. Each unit was reviewed by 3 subject matter experts who came together in a meeting to discuss their evaluation. In the subsequent sections we will highlight some of the issues flagged by the subject matter experts. In order to be flagged as an issue for a unit, 2 or more subject matter experts had to agree that there was a problem with an aspect of the question paper or the mark scheme.
Table 1: Test and item analyses – a brief description of analyses in this report.
Analysis What does it tell us? What are ideal values?
Item functioning
Facility This is a summary of the ease or difficulty of an individual item for the students taking the test. Facility = mean item score / maximum possible item score.
Values range between 0 and 1; For a 10 mark item, 0 indicates that the average mark was 0 (0%) while 1 means that the average mark was 10 (100%).
Ideally, in a test which aims to differentiate between students, and has been appropriately targeted at both the right level and the cohort of learners have been adequately prepared, most item facility values should be between around 0.3 and 0.8.
Discrimination indices
These tell us how well an item has contributed to the test in terms of spreading out students of different abilities. It reflects the extent of the relationship
table qualifications
7
Analysis What does it tell us? What are ideal values?
between the score on the item and the score on the overall test.
R_Rest is the correlation between item mark and total test score minus the item score.
Possible values vary between -1 and +1.
The closer to 1, the greater the discrimination. A value of 0 indicates no discrimination as students of different abilities score the same. Items with
negative values should be inspected closely
because they may be measuring something different from the rest of the test.
Ideally, for tests which aim to differentiate between students of different abilities, values should be greater than +0.3 to indicate discrimination.
Test functioning
Mean mark On average, how well students have performed on this test
Around 50% of the maximum marks is generally considered appropriate for tests aiming to differentiate between students. For tests which are competency-based and ‘enter when ready’, it may be that a higher mean mark is appropriate.
However, as with facilities, the interplay between appropriate targeting, student preparedness and interpreting the mean mark. For example, if a test is at an appropriate level but students are under-prepared, there will be a low mean mark. Or, if a test has been targeted at the wrong level (eg below Level 3) the test may generate a very high mean mark. Standard
deviation (SD)
How well the test has spread out students in the available mark range.
Should be greater than ≈15% of the number of marks available.
Reliability coefficients
Reliability coefficients are measures of consistency of test results. The reliability measures reported here are derived based on the internal structure of the tests – internal reliability.
Cronbach’s Alpha – an estimate of reliability of a test derived based on the internal structure of the test (Cronbach, 1951). High values suggest the test is internally coherent – that the items are closely related as a group – and that test is measuring a common construct.
table qualifications
8
4. Analysis outcomes
4.1 Summary of profiles of item functioning within tests
The figures below present all 20 units (tests) from the qualifications in the sample, for each item and test analysis, grouped by subject area.
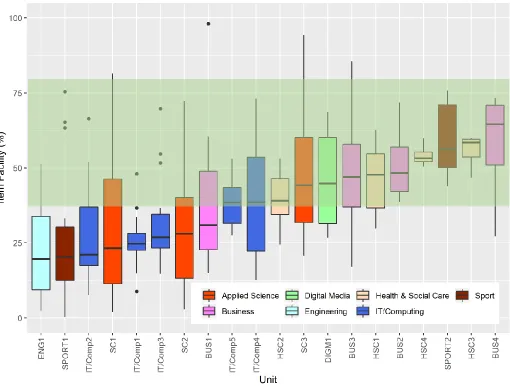
For the majority of tests, the item facilities fell within the ideal range of items. Figure 1 shows for each of the 20 units the distribution of item facilities. Each unit’s item facilities are displayed in a box and whisker plot where the box shows the middle 50% of item facilities (the interquartile range) and the whiskers represent the items outside of the interquartile range, extending 1.5 times the interquartile range above and below. The larger the box and whiskers, the greater the
variability in the item facilities within the test. Items with facilities that fall outside of the whiskers are shown as solid points and are considered to be outliers. The black line shows the median value – the midpoint of the item facilities within the unit (in other words, 50% of the items in the test fall above and 50% of items fall below). All the box plots have been ordered according to the median item facility.
[image:8.595.45.555.327.714.2]table qualifications
9
Not unusually, many tests have quite a wide range of item facility values – shown by the size (height) of the boxes, lengths of whiskers and presence of outliers.
Where a test overall has either predominantly easy items or predominantly difficult items, it is more likely that the tests will not have adequately differentiated between students of different levels of ability – they often lead to narrow mark distributions and the awarded grade boundaries are close together.
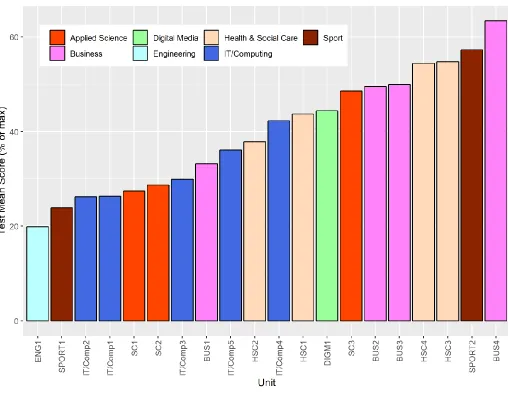
The mean mark of a test is a direct function of the range of item facilities. Figure 2 below shows mean mark as percentage of the overall mark total for each test. One test has a very low mean mark at just 20% of the total marks available (on the left-most side of the graph). None has very high mean marks.
[image:9.595.44.552.308.704.2]There are no particular subject patterns in that not all tests for one subject are grouped together or in the same ideal or not ideal category.
Figure 2: Bar chart showing the mean score for each of the tests (expressed as a percentage of overall
table qualifications
10
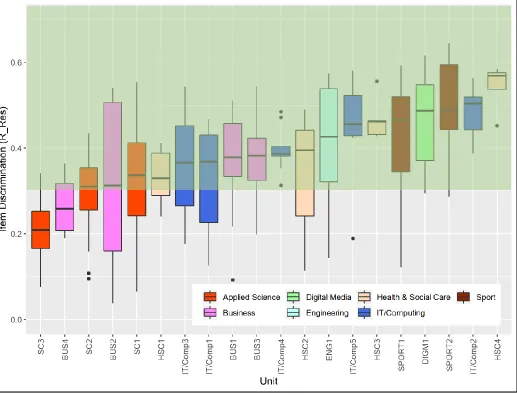
Tests which aim to differentiate between students of different ability (this might be indicated by having more than one passing grade) need items that in themselves discriminate (ie higher ability students do better than lower ability students on the individual items). If items do not discriminate, they are not contributing to the measurement properties of the test ie to spread out students according to their ability. Figure 3 displays, for each test, the distribution of item discrimination indices. As with figure 1, this uses box and whisker plots and is arranged in ascending order by median discrimination value.
Unlike facility indices, where there is an acceptable range, for discrimination indices the higher the
better; and there is no advantage to the measurement properties of a test to have a range of
discrimination values.2 In short, the more discriminating the better. Ebel and Frisbie (1991)
indicate that items with discrimination between 0.2 and 0.29 are ‘marginal items, usually needing and being subject to improvement’ before inclusion in a test; while items with discrimination indices less than 0.19 are poor items. Haladyna and Rodriguez (2013) indicate 0.15 or above as acceptable for test items which are objective (multiple choice or selected response) and which are contained within a test of reasonable length.
Again, the majority of tests have more than 50% of items with generally accepted levels of discrimination. Only 2 tests had items where fewer than half of the items had generally accepted levels of discrimination. For one of these tests, this was also an issue identified by the subject matter experts. These are on the far left side of the graph and the median line falls out of the green area (which indicates acceptable levels of discrimination). It might be possible for some items to be valuable in a test despite low levels of discrimination on the basis of testing important baseline knowledge or skills. In a test which is not a competency test, but instead aims to
differentiate and grade students according to their ability, tests with high proportions of non-discriminating items are likely to be suboptimal.
2 NB It is normal (and acceptable) practice to have one or two items at the beginning of the test which most students
table qualifications
[image:11.595.43.560.91.486.2]11
Figure 3: Box and whisker plots showing the distribution of discrimination indices (R_Rest) for each of the 20 tests. The green area indicates the ideal range of item discrimination indices. Tests arranged according to ascending order of median discrimination value (black horizontal line)
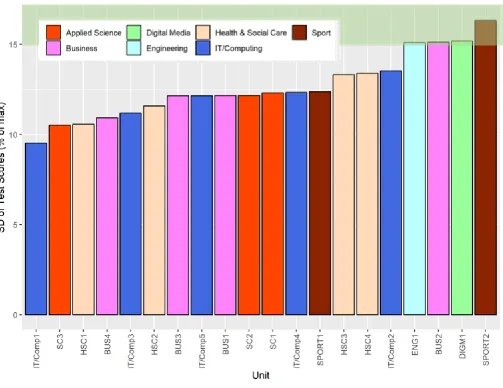
The standard deviation of a test indicates the range of marks awarded to students on any test. As a general rule of thumb, ideally tests should have standard deviation on or above 15% of the maximum mark; the larger the standard deviation, the better the test has spread students across the mark range.
table qualifications
[image:12.595.52.555.93.481.2]12 Figure 4: Bar chart showing the standard deviation for each of the tests (expressed as a percentage of maximum available mark); arranged in ascending order of standard deviation.
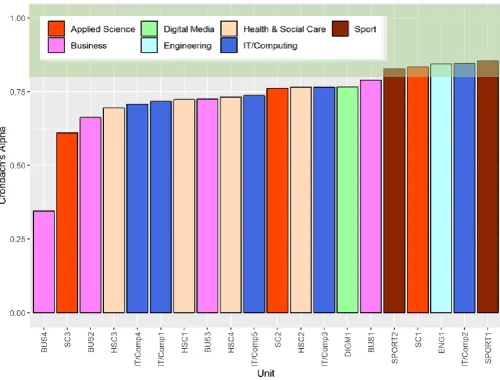
The reliability of the tests is presented in Figure 5 below. This presents the values of Cronbach’s alpha in ascending order. The green area indicates ‘normally acceptable’ values of Cronbach’s alpha, and indicates which tests are internally consistent (and thus provide a consistent measure of the construct). Of the 20 tests in the research, only 5 had values above 0.8 (ie acceptable). However, of the remaining 15, many had values relatively close to 0.8 (for example, above 0.75, but less than 0.8), and of these some had other measures of reliability (for example, McDonald’s
Omega T) which were above 0.8.3 Only one test had extremely low reliability. This may be
explained by the fact that the unit contained only 4 items and we know that Cronbach’s alpha values tend to be higher where there are many items (see Bramley and Dhawan, 2011). In
3 McDonald’s Omega T may be a more appropriate estimate of test reliability in some circumstances. See discussion
table qualifications
13
[image:13.595.48.548.129.509.2]general, low reliability of this sort is likely to undermine the value of the test and its ability to measure the stated construct.
Figure 5: Values of reliability – Cronbach’s Alpha – for each test, arranged in ascending order of value.
4.2 Summary of test functioning
table qualifications
14
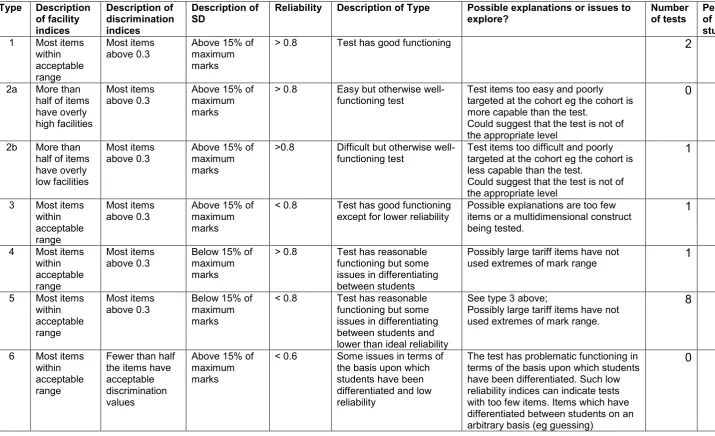
Table 2 below summarises different types of test in respect of each main dimension of functioning
according to the combination of the different dimensions.4
Given all the normal caveats above relating to ideal values in Table 1 and around applying some arbitrary standards, this seems to indicate that 13 tests in the sample (65%) had good or
reasonable functioning and that 7 had some issues in terms of test functioning. It is possible that, in some of these tests, the apparent lack of adequate functioning may rather be a reflection of the context in which they operate, the constructs being measured in relation to the stated purpose of the test or the level of preparation of the cohort.
A short note on Table 2 and how it was derived:
all 4 attributes of test functioning (profile of facilities, profile of discrimination indices, SD
and Cronbach’s alpha) have easy and clear to apply categories – for example, ‘most items’ means >50% of items
in exploring how to derive this table (see Ofqual 2017), we subdivided each attribute into 2
or 3 categories and balanced some decisions between the sensitivity of the sub-categorisation of the attributes against yielding a sensible (meaningful) overall number of test-types. As we acknowledged last time (ibid, p12), with different underlying data, it is possible that we might have made different decisions. In this second tranche of
assessments, most tests conformed to these test types but 2 sub-categories (‘2b’ and ‘8bii’) were added.
Overall, there is a different overall profile of types compared to previously. The key difference reflects the overall profile of test item difficulties, with many more tests in this round having the majority of items being difficult (item facilities less than 0.3). Without knowledge about the preparation of the overall candidature, this might be a result of either items being intrinsically too hard or the cohort being insufficiently able or prepared. There is some further discussion of this in Section 5 (page 17).
4
15 Table 2 : Some (arbitrary) standards for evaluation of test functioning – nine test types.
Type Description of facility indices Description of discrimination indices Description of
SD Reliability Description of Type Possible explanations or issues to explore? Number of tests Percentage of tests in study 1 Most items
within acceptable range
Most items
above 0.3 Above 15% of maximum marks
> 0.8 Test has good functioning 2 10%
2a More than half of items have overly high facilities
Most items
above 0.3 Above 15% of maximum marks
> 0.8 Easy but otherwise
well-functioning test Test items too easy and poorly targeted at the cohort eg the cohort is more capable than the test.
Could suggest that the test is not of the appropriate level
0 0%
2b More than half of items have overly low facilities
Most items
above 0.3 Above 15% of maximum marks
>0.8 Difficult but otherwise
well-functioning test Test items too difficult and poorly targeted at the cohort eg the cohort is less capable than the test.
Could suggest that the test is not of the appropriate level
1 5%
3 Most items within acceptable range
Most items
above 0.3 Above 15% of maximum marks
< 0.8 Test has good functioning
except for lower reliability Possible explanations are too few items or a multidimensional construct being tested.
1 5%
4 Most items within acceptable range
Most items
above 0.3 Below 15% of maximum marks
> 0.8 Test has reasonable functioning but some issues in differentiating between students
Possibly large tariff items have not
used extremes of mark range 1 5%
5 Most items within acceptable range
Most items above 0.3
Below 15% of maximum marks
< 0.8 Test has reasonable functioning but some issues in differentiating between students and lower than ideal reliability
See type 3 above;
Possibly large tariff items have not used extremes of mark range.
8 40%
6 Most items within acceptable range
Fewer than half the items have acceptable discrimination values
Above 15% of maximum marks
< 0.6 Some issues in terms of the basis upon which students have been differentiated and low reliability
The test has problematic functioning in terms of the basis upon which students have been differentiated. Such low reliability indices can indicate tests with too few items. Items which have differentiated between students on an arbitrary basis (eg guessing)
16
Type Description of facility indices Description of discrimination indices Description of
SD Reliability Description of Type Possible explanations or issues to explore? Number of tests Percentage of tests in study 7 Most items
within acceptable range
Fewer than half the items have acceptable discrimination values
Below 15% of maximum marks
< 0.8 Non-discriminating test. Items are appropriately pitched. However, the test has problematic functioning in that it has not succeeded in differentiating between students and in terms of the basis upon which students have been differentiated
1 5%
8a More than half of items have overly high facilities
Most items
above 0.3 Below 15% of maximum marks
> 0.8 Too easy and not
differentiating Test has reasonable functioning except poor item targeting has meant the test has not succeeded in
differentiating between students
0 0%
8b(i) More than half of items have overly low facilities
Most items above 0.3
Below 15% of maximum marks
> 0.8 Too difficult and not differentiating
Test has reasonable functioning except poor item targeting has meant the test has not succeeded in
differentiating between students
3 15%
8b(ii) More than half of items have overly low facilities
Most items above 0.3
Below 15% of maximum marks
Between 0.7 and 0.8
Too difficult and not differentiating with sub-optimal reliability
Test has reasonably functioning, but some poor item targeting has meant the test has not succeeded in differentiating between students and slightly lower than ideal reliability
3 15%
9a More than half of items have overly high facilities
Fewer than half the items have acceptable discrimination values
Below 15% of maximum marks
< 0.8 Too easy and poorly
performing on all fronts 0 0%
9b More than half of items have overly low facilities
Fewer than half the items have acceptable discrimination values
Below 15% of maximum marks
< 0.8 Too difficult and poorly
table qualifications
17
4.3 Subject matter expert findings
Overall, as might be expected from the data, subject matter experts identified a range of issues across the assessments. In general these issues were about individual questions and/or their mark schemes.
As previously mentioned, this section will focus on the issues that were raised by at least 2 of the 3 subject matter experts who evaluated each assessment.
In 5 of the units (2 units in IT, 2 units in health and social care and one unit in applied science), subject matter experts thought that the mark scheme was either not clear or could not be applied easily and consistently. Good mark schemes are those that can be internalised by markers. They are likely to be applied in the same way by different markers and by an individual marker across different candidates. Comments from the subject matter experts included a lack of sufficient guidance, a lack of clarity or confusing points which rendered the mark scheme difficult to be applied easily and consistently.
In 4 of the units (3 units in IT and one in sport) the subject matter experts concluded that percentage of content sampled was inadequate. An effective assessment will likely sample between 30% and 50% of the content in the specification such that most of the content will be sampled after 3 to 5 question papers. For the 3 units in IT the subject matter experts commented that the assessment did not sample enough of the specification content and could lead to a longer cycle in order to sample all the content from the specification. For the unit in sport the subject experts believed that the percentage of content sampled was higher than 50% potentially leading to too much predictability in the areas of the specification that will be assessed. For both the over sampling and under sampling of content there is a danger that the assessment will lack validity. In 4 of the units (2 units in IT, one unit in business and one unit in sport) subject matter experts thought that the level of difficulty was not adequate. For these units, subject matter experts commented that the level of difficulty for the assessment was closer to a Level 2 than a Level 3 qualification.
In 4 of the units (2 units in IT, one in business and one in sport) the subject matter experts stated that the question paper wasn’t likely to discriminate across the target population. For all 4 units, the subject matter experts commented that they believed that the question papers wouldn’t challenge the most able. These comments could also be linked to the perceived difficulty of the question papers as they were made in the same units where the level of difficulty was judged to be too low.
In 4 of the units (2 units in IT, one unit in digital and one unit in computing) the subject matter experts thought that where scenarios, case studies or contexts were provided, they were not required in order to answer the questions. This can be problematic if they are either unnecessary or distracting. If they are, they may create an inappropriate reading load.
Finally, the 2 assessments with most issues identified by subject matter experts were IT and sport assessments with 7 issues each.
5. Discussion
table qualifications
18
discriminate across the target audience and the percentage of content sampled from the specification.
As discussed in Ofqual, 2017, there are some potential issues regarding this type of analysis and the purpose of the tests, their items and categorisation thereof. The key issue is the purpose of the test. Traditionally, these sorts of test and item functioning analyses have been conducted upon
tests for which the main purpose is to rank students. One of the key underlying assumptions of the
functioning of A levels and GCSEs is that the assessments will reliably rank students according to their knowledge, skills and understanding in relation to a relatively broad proficiency domain (for example, ‘biology’ or ‘English literature’). A higher mark or grade should indicate a student with greater proficiency than one with a lower mark or grade. For such tests with the explicit purpose of ranking, the underlying test principles should focus particularly heavily upon item discrimination. This means that tests should generally avoid items which either most students would get right or most students would get wrong, as such items provide little information about how students differ from one another in relation to the construct being tested. In other words, items should not have extreme facility scores, and should show good item discrimination indices.
For tests within the vocational and technical sphere, some tests might have the purpose of ranking, while others may have a different purpose – that of identifying ‘mastery’ ie identifying those students who have gained mastery in a particular proficiency (versus those who have not). This implies a ‘binary’ categorisation, rather than ranking along a scale, and thus implies very different underlying principles for test design. This would mean that most students, if they have been entered appropriately, should get such items correct. Tests with many items with high facilities (and low discrimination) might indicate tests designed with this purpose in mind.
However, while this was a feature of a proportion of tests analysed and reported in Ofqual, 2017, this is not a feature of the tests in this round. Rather, the converse is the case, with no tests with overly high facilities, around two thirds of the tests with appropriate profiles of facilities (albeit sometimes with low mean marks) and around one third with a profile of low item facilities (and very low mean marks). There is no particular subject clustered in this group of tests which have been found to be particularly difficult (in test types 8b predominantly). This appears to indicate that many of these tests are either too intrinsically difficult for candidates, either because they are set beyond Level 3, or because the students entered were insufficiently capable of performing on the test, because they were insufficiently prepared, for example. This is where the subject matter expert views become useful. Interestingly, for a few of tests in the study which had been classed from the quantitative analyses as ‘most items within acceptable range’ for facility values, the subject matter experts identified issues with the difficulty of the papers but in the opposite direction ie they judged the papers to be more at Level 2 rather than Level 3. This seems to suggest that the candidates did reasonably well on the assessments, but (only because) they were at the wrong level. These assessments were across 3 different subjects but were all from one AO. This apparent mis-targeting of the papers may have given the appearance of adequate test functioning.
One thing to keep in mind is that for most of these qualifications, the summer 2017 was the first series where external assessments were introduced. Teachers and candidates may not have been very familiar with this form of assessment in the context of these qualifications and we know that for new specifications it takes a few series for performance to increase (Ofqual, 2016).
table qualifications
19
6. Concluding comments
This work indicates that the majority of tests which were analysed had good or reasonable test functioning. Compared to Ofqual 2017, this line of work has been enhanced by triangulating the item and test functioning statistics with subject matter experts’ inputs. This has given a greater understanding of the context, level of difficulty of items, appropriateness of level and consideration of particular item functioning features in relation to the quality of mark scheme, for example. This work has helped Ofqual engage with a number of AOs around the quality of external tests in school and college-based vocational and technical qualifications. This work represents the second tranche of this work; such analyses are becoming more routine with AOs, with the third tranche of this work already underway. AOs, as well as needing to have due regard to these specific
table qualifications
20
7. References
Bramley, T. and Dhawan, V. (2010). Estimates of Reliability of Qualifications. In: Ofqual Reliability
Compendium (Chapter 7). Coventry: Ofqual [online]. Available:
https://www.gov.uk/government/publications/reliability-of-assessment-compendium
Ebel, R. L. and Frisbie, D. A. (1991) Essentials of Educational Measurement, Prentice Hall, Engelwood Cliffs, New Jersey, US.
Haladyna, T.M. and Rodriguez, M.C. (2013) Developing and Validating Test Items. Routledge, Oxford, UK. Ofqual (2016) Investigation into the sawtooth effect in GCSEs, AS and A levels. Coventry, Ofqual [online]. Available: https://www.gov.uk/government/publications/investigation-into-the-sawtooth-effect-in-gcses-as-and-a-levels
Ofqual (2017) Vocational and Technical Qualifications: Assessment Functioning of external assessments. An overview of the functioning of assessments in 27 qualifications and 49 units. Ofqual, Coventry.
Available: https://www.gov.uk/government/publications/assessment-functioning-of-external-assessments Opposs, D. and He, Q. (2013) Introduction to the Concept of Reliability. In: Ofqual Reliability Compendium
(Chapter 7). Coventry: Ofqual [online]. Available:
21
1 Appendix
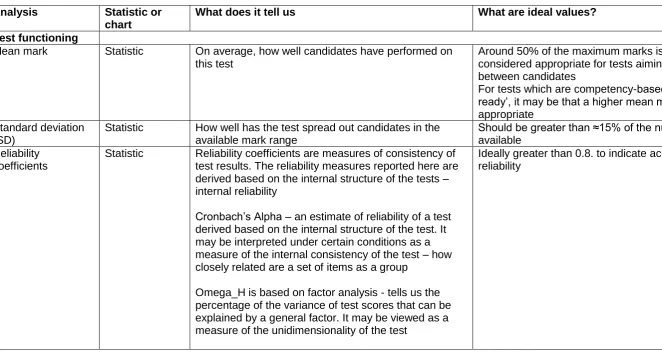
Table 3: Test and item analyses – a brief description of those provided to AOs for each test.
Analysis Statistic or
chart
What does it tell us What are ideal values?
Test functioning
Mean mark Statistic On average, how well candidates have performed on this test
Around 50% of the maximum marks is generally considered appropriate for tests aiming to differentiate between candidates
For tests which are competency-based and ‘enter when ready’, it may be that a higher mean mark is
appropriate Standard deviation
(SD)
Statistic How well has the test spread out candidates in the available mark range
Should be greater than ≈15% of the number of marks available
Reliability coefficients
Statistic Reliability coefficients are measures of consistency of test results. The reliability measures reported here are derived based on the internal structure of the tests – internal reliability
Cronbach’s Alpha – an estimate of reliability of a test derived based on the internal structure of the test. It may be interpreted under certain conditions as a measure of the internal consistency of the test – how closely related are a set of items as a group
Omega_H is based on factor analysis - tells us the percentage of the variance of test scores that can be explained by a general factor. It may be viewed as a measure of the unidimensionality of the test
22
Analysis Statistic or
chart
What does it tell us What are ideal values?
Omega_T is a measure of the total test score reliability estimated based on factor analysis, involving the use of a general factor and a set of factors associated with items grouped together according to their relatedness
Reliability measures tell us something about the quality of the test in that if the test is repeated, high reliability measures indicate there should be high similarity in the test results
Mark distribution Chart This displays the distribution of marks for the whole tests. It is possible to see the extent to which there is skewness
A good mark distribution should show a good distribution of marks, centrally located with little skewness and with most mark points used. For tests which are competency-based and ‘enter when ready’, it may be appropriate for the mark distribution to be more skewed towards the top end of the mark range
Item functioning
Facility Statistic, tabulated
This is a summary of the ease or difficulty of an individual item
Facility = mean item score / maximum possible item score
Values range between 0 and 1; For a 10 mark item, 0 indicates that the average mark was 0(%) while 1 means that the average mark was 10 (100%)
Ideally, in a test which aims to differentiate between candidates, most facility values should be between 0.3 and 0.8
Facility values plot. Chart This chart provides a visual summary of the range of facilities for all the items on the test
23
Analysis Statistic or
chart
What does it tell us What are ideal values?
It might be the case that for tests which do not aim to discriminate between candidates of different ability – those assessments which have a mastery or
competency model - that the profile may be different with a greater proportion of items having higher values Discrimination
indices
Statistic, tabulated
These tell us how well an item has contributed to the test in terms of spreading out candidates of different abilities. It reflects the extent of the relationship between the score on the item and the score on the overall test
R_Tot – correlation between the item mark and whole test score;
R_Rest – correlation between item mark and total test score minus the item score
Possible values vary between -1 and +1.
The closer to 1, the greater the discrimination. A value of 0 indicates no discrimination. Negative values should be treated with caution
Values should be positive. The higher the value, the more discriminating the item
Ideally, for tests which aim to differentiate between candidates of different abilities, values should be greater than +0.3 to indicate discrimination
Discrimination indices plot
Chart This plot provides a quick visual reference for the tabulated discrimination indices, both R_Rest and R_Tot. This helps to see the extent to which the items as a set have functioned
In general, discrimination values should be above 0.3
0 0.2 0.4 0.6 0.8 1
qA1a qA1b qA1c qB2a qB2b qB2c qB2d qB3a qB3b qB4a qB4b qC5a qC5b qC5c qC5d qD6a qD6b qD6cqD7
In
d
ex
24
Analysis Statistic or
chart
What does it tell us What are ideal values?
Most of the items have values above 0.3, and many above 0.5 – and so acceptable
Item Characteristic Curves (ICCs)
Charts ICCs depict both item facility with respect to ability and discrimination. ICCs plot facility (item mean score) by ability group split into ability quartiles
The slope of the graph indicates the overall
discrimination such that an incline indicates that the item has successfully discriminated between
candidates of differing ability, while a flatter line indicates that the item has failed to do so
Ideally, ICCs should display an even slope ranging from approximately 20% for the least able quartile to
approximately 80% for the most able quartile
0 25 50 75 100
1 2 3 4
Ability group, item qA2bi
It
e
m
m
e
a
n
s
c
o
re
(%
25
Analysis Statistic or
chart
What does it tell us What are ideal values?
Item mark distributions
Charts These show frequency of marks awarded. While less useful for one mark questions, we have included these as they also represent the facility and, when presented alongside the ICCs, can help aid understanding
ie Statistic,
tabulated
This tells us whether individual items contribute their intended weight towards the assessment unit as a whole. Each item has an intended weighting
represented by the assigned mark (eg a 5 mark item on a 50 mark test has an intended weighting of 10%). The achieved weighting takes into account the variability of the item marks in relation to the overall variability of the unit and how well they have discriminated candidates of different abilities
Achieved weight = R_Tot x SD_item x 100
SD_unit
- Where R_Tot is the correlation of item marks with total mark on the unit
- SD_item = standard deviation of item marks - SD_unit = standard deviation of unit marks
Ideally, the ratio of achieved weighting to intended weighting should be as close to 1 as possible – indicating close alignment between the intended weighting and achieved weighting. Between 0.5 and 1.5 is broadly acceptable
Wright map of item targeting
Chart This chart shows how well the range of item difficulties matches the range of candidate ability. This is based upon a statistical model called Rasch, which takes into account item difficulty when estimating the ability of test takers
26
Analysis Statistic or
chart
What does it tell us What are ideal values?
On the chart, the left hand side of the histogram shows the distribution of candidate ability
On the right hand side, each item is displayed along the x axis, and locations on the y axis indicate the
difficulties of the marks assigned (the ‘score
categories’) of the item (‘step difficulty’ or ‘threshold’)
The items with step difficulties at the bottom are easy in relation to the ability of the candidates, while the items with step difficulties at the top are difficult
Items -4 -2 0 2 St e p t h re s h o ld s (l o g it s ) T1 T1 T1 T1 T1 T1 T1 T1 T1 T1 T1 T1 T1 T1 T1 T1 T1 T1 T1 T1 T1 T1 T1 T1 T1 T1 T1 T1 T1 T1 T1 T1 T1 T1 T1
1 3 5 7 9 11 13 15 17 19 21 23 25 27 29 31 33 35 2 4 6 8 10 12 14 16 18 20 22 24 26 28 30 32 34
27 ©️ Crown Copyright 2019
This publication is licensed under the terms of the Open Government Licence v3.0 except where otherwise stated.
To view this license, visit
or write to
Published by:
Earlsdon Park 53-55 Butts Road Coventry
CV1 3BH
0300 303 3344
[email protected] www.gov.uk/ofqual
www.nationalarchives.gov.uk/doc/open-government-licence/
Information Policy Team, The National Archives, Kew, London TW9 4DU