1
The CIO Role Expectations Instrument: A Validation and Model Testing
Abstract
The validation of IS instruments has not been given the attention that it deserves. This study uses component-based structural equation modelling (PLS/SEM) to investigate the psychometric properties and possible modelling of the CIO role expectations instrument based on data obtained from 174 Australian CIOs. Results show that the CIO role expectation instrument has exhibited solid validity and reliability indices despite some minor weaknesses. The results also demonstrate the possibility to model the constructs of this instrument in different null and hierarchical models, and the validity of this instrument to measure the CIO role in different types of industries not just the healthcare sector in which it was developed. The results provide support for CIO role theory on two central issues: (1) CIOs are fulfilling a configuration of roles not just one specific role (2) the CIO roles can be grouped into two major categories: supply side roles and demand side roles.
Keywords
Chief information officer role, CIO Role Expectations Instrument, Partial Least Square (PLS), Psychometric Properties, Hierarchical Model.
INTRODUCTION
The arrival of the information age has made the role of the chief information office (CIO) more vital than other C-suite managers (Peppard, Edwards & Lambert 2011). Since the emergence of the CIO role in early 1980s , much has been written about it, however this role remains ambiguous (Peppard et al. 2011). This ambiguity indicates a lack of theory building regarding the CIO role in an organisation. Consequently, the lack of theory leads to a lack of rigorous measurements. A review of the literature revealed a handful of instruments that have been used to measure the role of the CIO (e.g. (Arthur Andersen & Co 1988; Gottschalk 2000; Karimi, Gupta & Somers 1996; McCall & Segrist 1980; Smaltz, Sambamurthy & Agarwal 2006; Wu, Chen & Sambamurthy 2008). IS management has been identified as one of the most researched topic in IS (Palvia, Pinjani & Sibley 2007), however the vast majority of literature is substantive rather than measurement oriented. Many scholars acknowledged that there is a lack of attention given to measurement validation in the IS field (Boudreau, Gefen & Straub 2001; Doll & Xia 1997; Gefen & Straub 2005; Klenke 1992; Straub 1989). Chau (1997) pointed out that the calls for methodological rigor and model testing in management information systems research and the proliferation of structural equation modelling (SEM) approaches in management science are growing. The last two decades has provided many attempts by IS scholars to validate previously developed measures (Chau 1997; Chin & Todd 1995; Doll & Xia 1997; Klenke 1992; Segars 1997; Segars & Grover 1993; Stewart & Segars 2002). Other studies have tried to provide guidelines for best checking of instrument validation (Boudreau et al. 2001; Gefen & Straub 2005; Straub, Boudreau & Gefen 2004; Straub 1989). Further examination of IS measurement is central to both theoretical and operational perspectives (Stewart & Segars 2002).
As far as the CIO roles’ expectations instrument is concerned from a theoretical perspective, the results of re-examination will assess the rigor and the extent of confidence in CIO role theory. Whereas, additional investigation from the operational point of view facilitates generalizability and consistency of measurements over time and context, avoids erroneous conclusions regarding the existence, magnitude, and direction of association between constructs (Stewart & Segars 2002). Smaltz et al. (2006) have encouraged IS researchers to validate the generalizability of their configuration of CIO roles in different industries beyond the healthcare sector in which it was developed.
In order to address this gap and responding to these calls for increased theoretical and methodological rigor, the purpose of this study is twofold. First, we will critically examine the psychometric properties of the CIO role expectations instrument (Smaltz et al. 2006) using component-based structural equation modelling (PLS/SEM ). Then, different types of null and hierarchical models using the constructs of the CIO role expectations instrument are assessed and compared for best modelling. The two research questions investigated in this study are:
1. Is the CIO role expectations instrument developed by valid and reliable?
2. How can we model the constructs of CIO role expectations instrument to gain best validity, reliability and model fit?
2
is described and justified. After that, the results of the analysis of the survey data are presented. Then, a discussion regarding the key results of this study are provided. Finally, conclusions, implications of the key findings for existing theory and practice are discussed and some suggestions for future research are provided.BACKGROUND
An extensive review of the CIO roles literature suggested that there are at least six survey instruments that have been used to identify the CIO roles to date e.g., (Arthur Andersen & Co 1988; Gottschalk 2000; Karimi et al. 1996; McCall & Segrist 1980; Smaltz et al. 2006; Wu et al. 2008). These measures are all developed specifically for the CIO except the instrument developed by McCall and Segrist (1980) which is based on Mintzberg’s ten general managerial roles . The CIO role expectations instrument was developed within the USA healthcare sector based on a wide base of knowledge regarding the CIO role integrated with a comprehensive CIO role inventory derived from the literature along with rich data obtained from CIOs and Top Management Team members interviewed.
This instrument was used to identify the perceived importance of six key CIO roles proposed as Strategist, Integrator, Relationship Architect, Educator, Utility Provider, and Information Steward. It is worth noting that these six roles have been classified by Smaltz et al. (2006) into two groups as follows : (1) Supply side roles: include the roles that are best described as operational or technical for the CIO as utility provider, information steward, and educator, and (2) Demand side roles: include the roles that are best described as strategic or business for the CIO as integrator, relationship architect, and strategist.
The final CIO role expectations instrument included 25 items identified to measure the CIO role. This instrument was operationalized using exploratory factor analysis/ principle component extraction in order to examine the dimensionality of its indicators. From the results, six-dimensional factors reflecting six roles for the CIOs emerged as follows: Strategist (5 items); Relationship Architect (4 items); Integrator (4 items); Educator (3 items); Information Steward (4 items); and Utility Provider (3 items). They found that the factor loadings for 23 out of 25 items analysed were in the range from 0.4 to 0.82. Two items were omitted due to lower factor loadings (St1 and Ut.Prov4). This study aims to use a confirmatory approach to validate this instrument and confirm that the CIO is indeed fluffing a configuration of roles can be grouped in two major areas ( supply and demand) as prior CIO role theory stated .
METHODOLOGY
Data Collection
Data for this research were collected through a large scale cross-sectional survey carried out in Australia in early and mid-2012. The survey was administrated in three waves, two postal mail outs followed by online emails survey. The target population for this research was Australian private sector IT executives. A list of postal addresses for 954 senior IT executives in Australian private sector firms was purchased from Dun & Bradstreet Australia (2011) provided the sampling frame. A cover letter along with a copy of the questionnaire and pre-paid reply envelope was sent to all of the 954 Australian senior IT executives listed in the sampling frame in late February 2012 for the first mail out and in late March 2012 for the second mail out. To increase the response rate, follow-up phone calls were conducted in early July 2012 to motivate more responses after the second mail out. Through these phone calls the IT leaders willing to respond were asked to provide their personal emails in order to send an electronic copy via the internet as they found the online survey more convenient. Next, emails were sent to all IT leaders who were willing to participate. These emails carried an URL link to the online survey developed using the Qualitrics online survey software.
A total of 113 questionnaires were returned as undeliverable due to invalid addresses, and emails were received from 19 firms who indicated that they were not willing to participate in this survey for different reasons. With 174 complete and usable responses the response rate of this study was calculated at 20.68 per cent (174/ (954 -113) = 20.68 %) which is considered to be a reasonable response rate for survey research compared to similar studies involving CIOs where response rates have ranged from 7 to 22.5 per cent (Chen & Wu 2011; Gerow 2012; Kearns & Lederer 2003; Oh & Pinsonneault 2007; Preston, Karahanna & Rowe 2006; Wu et al. 2008). It is recognised that the targeted respondents were senior IT executives who are busy people and tend to be over-surveyed.
Data Analysis
3
distributional free, and able to treat reflective and formative constructs within highly complex structural models (Chin & Newsted 1999).RESEARCH RESULTS
The survey data were prepared for main data analysis by correcting errors, checking and treating outliers, checking for normal distribution, and multicollinarity based on the guidelines provided by (Tabachnick & Fidell 2007). Next, an assessment of non-response bias was carried out following the guidelines presented in Sivo, Saunders, Chang and Jiang (2006) and Armstrong and Overton (1977). A comparison was conducted between the early respondents (N=21) and late respondents (N=13) in terms of the six CIO roles included in this instrument. The results of the Mann-Whitney U test conducted on the 25 items of this instrument found statistically significant differences in only one item (Re.Arch1). This means that there are no major differences between early and late respondent CIOs, and that non-response bias does not appear to be an issue in this research.
The Psychometric Properties of the CIO Role Expectations
The six CIO roles included in this instrument were modelled by Smaltz et al. (2006) as reflective constructs, hence five major areas should be tested to ensure measurement validity (Henseler, Ringle & Sinkovics 2009) : reliability at the construct level; reliability at the indicators level; convergent validity; discriminant validity at the construct level; and discriminant validity at the indicators level.
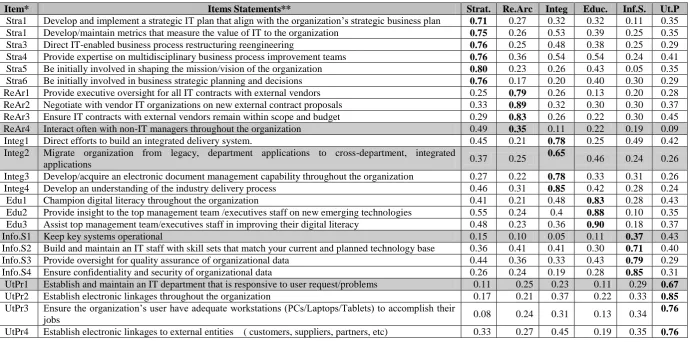
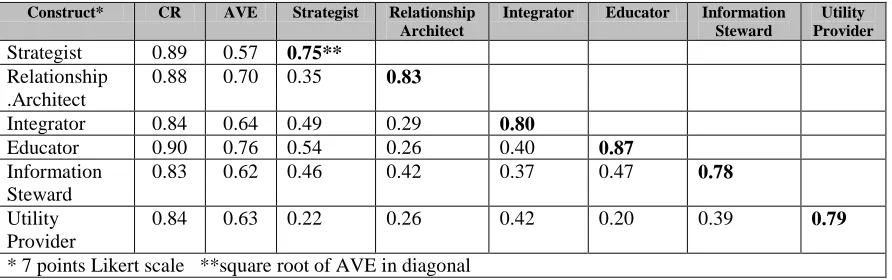
Following common criteria suggested by Chin (2010) and Henseler et al. (2009) we examine the inter-construct correlations, composite reliabilities, average variance extracted for each construct, items loadings on their constructs and items cross loadings on other constructs. These statistics are presented in Table 1 and Table 2. As can be seen from Table 2, the composite reliability (CR) for all constructs exceeds the satisfactory level of 0.7 which supports internal consistency reliability(Werts, Linn & Jöreskog 1974). Reliability at the indicators level can be checked by examining the items loading on their respective constructs (see Table 2). Chin (1998) and Henseler et al. (2009) suggested 0.7 as a rule of thumb as a standardized outer loading to ensure that the indicator has captured at least half of the variance. The factor loading of all items exceed the standardized cut off except for four items. Two items are over 0.6 which is still acceptable according to Henseler et al. (2009). Two items are below 0.4 which is not acceptable. The average variance extracted (AVE) proposed by Fornell and Larcker (1981) for all research constructs as shown in Error! Reference source not found. exceed the acceptable cut off of 0.5 (Fornell & Larcker 1981) which indicates sufficient convergent validity.
4
Table 1 CIO Role Expectations Items Loadings and Cross LoadingsItem* Items Statements** Strat. Re.Arc Integ Educ. Inf.S. Ut.P
Stra1 Develop and implement a strategic IT plan that align with the organization’s strategic business plan 0.71 0.27 0.32 0.32 0.11 0.35 Stra1 Develop/maintain metrics that measure the value of IT to the organization 0.75 0.26 0.53 0.39 0.25 0.35
Stra3 Direct IT-enabled business process restructuring reengineering 0.76 0.25 0.48 0.38 0.25 0.29
Stra4 Provide expertise on multidisciplinary business process improvement teams 0.76 0.36 0.54 0.54 0.24 0.41 Stra5 Be initially involved in shaping the mission/vision of the organization 0.80 0.23 0.26 0.43 0.05 0.35
Stra6 Be initially involved in business strategic planning and decisions 0.76 0.17 0.20 0.40 0.30 0.29
ReAr1 Provide executive oversight for all IT contracts with external vendors 0.25 0.79 0.26 0.13 0.20 0.28 ReAr2 Negotiate with vendor IT organizations on new external contract proposals 0.33 0.89 0.32 0.30 0.30 0.37 ReAr3 Ensure IT contracts with external vendors remain within scope and budget 0.29 0.83 0.26 0.22 0.30 0.45
ReAr4 Interact often with non-IT managers throughout the organization 0.49 0.35 0.11 0.22 0.19 0.09
Integ1 Direct efforts to build an integrated delivery system. 0.45 0.21 0.78 0.25 0.49 0.42
Integ2 Migrate organization from legacy, department applications to cross-department, integrated
applications 0.37 0.25
0.65
0.46 0.24 0.26 Integ3 Develop/acquire an electronic document management capability throughout the organization 0.27 0.22 0.78 0.33 0.31 0.26
Integ4 Develop an understanding of the industry delivery process 0.46 0.31 0.85 0.42 0.28 0.24
Edu1 Champion digital literacy throughout the organization 0.41 0.21 0.48 0.83 0.28 0.43
Edu2 Provide insight to the top management team /executives staff on new emerging technologies 0.55 0.24 0.4 0.88 0.10 0.35 Edu3 Assist top management team/executives staff in improving their digital literacy 0.48 0.23 0.36 0.90 0.18 0.37
Info.S1 Keep key systems operational 0.15 0.10 0.05 0.11 0.37 0.43
Info.S2 Build and maintain an IT staff with skill sets that match your current and planned technology base 0.36 0.41 0.41 0.30 0.71 0.40
Info.S3 Provide oversight for quality assurance of organizational data 0.44 0.36 0.33 0.43 0.79 0.29
Info.S4 Ensure confidentiality and security of organizational data 0.26 0.24 0.19 0.28 0.85 0.31
UtPr1 Establish and maintain an IT department that is responsive to user request/problems 0.11 0.25 0.23 0.11 0.29 0.67
UtPr2 Establish electronic linkages throughout the organization 0.17 0.21 0.37 0.22 0.33 0.85
UtPr3 Ensure the organization’s user have adequate workstations (PCs/Laptops/Tablets) to accomplish their
jobs 0.08 0.24 0.31 0.13 0.34
0.76
UtPr4 Establish electronic linkages to external entities ( customers, suppliers, partners, etc) 0.33 0.27 0.45 0.19 0.35 0.76
*Measured with 7 point Likert scale
5
Table 2 Inter-construct correlation and reliability measuresOverall, these results indicate two important facts: (1) the psychometric properties of the CIO role expectations instrument exhibit adequate reliability and validity which increases confidence in this instrument and CIO role theory; and (2) this instrument is valid for a range of industries rather than the healthcare sector as the data for this research were collected from senior IT leaders from a range of different Australian industries and reflects the perceptions of practitioners from wide range industries.
Alternative models for the CIO role expectations instrument based on theory
Alternative null models
As we mentioned earlier the CIO role expectations instrument has been developed based on CIO role theory and the 25 items included have grouped into six roles based on the results of factor analysis. According to CIO role theory e.g., (Broadbent & Kitzis 2005; Mark & Monnoyer 2004) these 25 items can be grouped into two major factors : supply side roles which comprises three operational side roles (utility provider; information steward; and educator) and demand side role which includes three business or strategic side roles (strategist; relationship architect; and integrator). Also, these 25 items can be grouped in one major factor (e.g., CIO role expectations) in Smaltz et al. (2006).
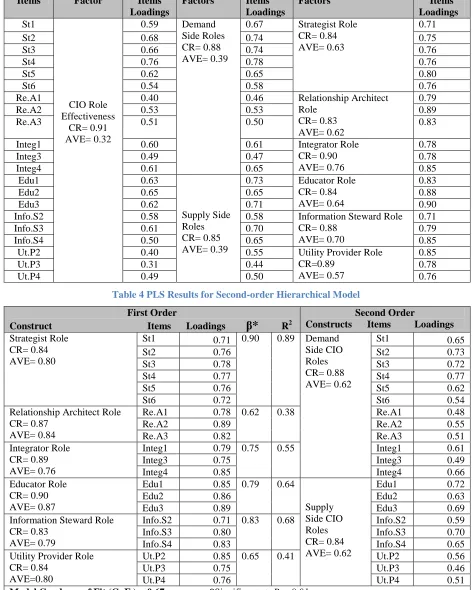
Table 3 presented a comparison between the psychometric properties for the suggested three null models above. The results show that the properties of six factors (roles) are better than two factors and one factor modelling of CIO roles, and the properties of two factors models are better than the one factor model.
Alternative Hierarchical models
By applying the repeated indicators approach suggested by Lohmöller (1989) and following the guidelines provided by Wetzels, Odekerken-Schröder and Van Oppen (2009), this study also examines the hierarchical model which are also supported by CIO role theory in terms of the psychometric properties and model goodness of fit (GoF) as proposed by (Tenenhaus, Vinzi, Chatelin & Lauro 2005) . As we used a hierarchical approach, the manifest variables will be used twice: for the firstorder latent variables (e.g., six CIO roles), for the second -order latent variables (e.g., supply side and demand side CIO roles in the first second--order hierarchical model and CIO role effectiveness in the second second-order hierarchical model). Edwards (2001) argued that the examination of the hierarchical models might allow: (1) more theoretical parsimony; (2) reduce model complexity; (3) matching the level of abstraction for predictor and criterion variables; and (4) assessment of the reliability and the validity of measures of multidimensional constructs. Furthermore, Stewart and Segars (2002) emphasizes the importance of testing higher order models rather than examining just a set of correlated first- order factors:
“The theoretical implication of higher-order models is that each first-order factor and the implied second-order factor is important in capturing the domain of the construct. Further, the second order factor may be a more important mediator between a consequent and predictor variable than the first order construct”.
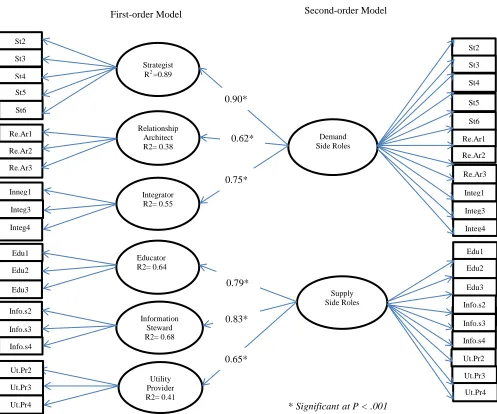
Table 4 present the path estimates, predictive power (R2), and model goodness of fit (GoF) for the second-orders, reflective, hierarchical CIO role model. As we can see the second-order hierarchical model shows acceptable properties in terms of reliability (CR), convergent validity (AVE), path coefficients (β), substantial explained variance (R2), and a large model fitting (GoF). Figure 1 depicts the structure and estimated parameters of the CIO role expectations as a second-order hierarchical model.
Construct* CR AVE Strategist Relationship Architect
Integrator Educator Information Steward
Utility Provider Strategist 0.89 0.57 0.75**
Relationship .Architect
0.88 0.70 0.35 0.83
Integrator 0.84 0.64 0.49 0.29 0.80
Educator 0.90 0.76 0.54 0.26 0.40 0.87
Information Steward
0.83 0.62 0.46 0.42 0.37 0.47 0.78
Utility Provider
0.84 0.63 0.22 0.26 0.42 0.20 0.39 0.79
6
Table 3 Null Models Psychometric PropertiesTable 4 PLS Results for Second-order Hierarchical Model
One Factor Null Model Two Factors Null Model Six Factors Null Model
Items Factor Items
Loadings
Factors Items Loadings
Factors Items
Loadings St1 CIO Role Effectiveness CR= 0.91 AVE= 0.32
0.59 Demand Side Roles CR= 0.88 AVE= 0.39
0.67 Strategist Role CR= 0.84 AVE= 0.63
0.71
St2 0.68 0.74 0.75
St3 0.66 0.74 0.76
St4 0.76 0.78 0.76
St5 0.62 0.65 0.80
St6 0.54 0.58 0.76
Re.A1 0.40 0.46 Relationship Architect
Role CR= 0.83 AVE= 0.62
0.79
Re.A2 0.53 0.53 0.89
Re.A3 0.51 0.50 0.83
Integ1 0.60 0.61 Integrator Role
CR= 0.90 AVE= 0.76
0.78
Integ3 0.49 0.47 0.78
Integ4 0.61 0.65 0.85
Edu1 0.63
Supply Side Roles CR= 0.85 AVE= 0.39
0.73 Educator Role CR= 0.84 AVE= 0.64
0.83
Edu2 0.65 0.65 0.88
Edu3 0.62 0.71 0.90
Info.S2 0.58 0.58 Information Steward Role
CR= 0.88 AVE= 0.70
0.71
Info.S3 0.61 0.70 0.79
Info.S4 0.50 0.65 0.85
Ut.P2 0.40 0.55 Utility Provider Role
CR=0.89 AVE= 0.57
0.85
Ut.P3 0.31 0.44 0.78
Ut.P4 0.49 0.50 0.76
First Order
Construct Items Loadings
β*
R2Second Order
Constructs Items Loadings Strategist Role
CR= 0.84 AVE= 0.80
St1 0.71 0.90 0.89 Demand
Side CIO Roles CR= 0.88 AVE= 0.62
St1 0.65
St2 0.76 St2 0.73
St3 0.78 St3 0.72
St4 0.77 St4 0.77
St5 0.76 St5 0.62
St6 0.72 St6 0.54
Relationship Architect Role CR= 0.87
AVE= 0.84
Re.A1 0.78 0.62 0.38 Re.A1 0.48
Re.A2 0.89 Re.A2 0.55
Re.A3 0.82 Re.A3 0.51
Integrator Role CR= 0.89 AVE= 0.76
Integ1 0.79 0.75 0.55 Integ1 0.61
Integ3 0.75 Integ3 0.49
Integ4 0.85 Integ4 0.66
Educator Role CR= 0.90 AVE= 0.87
Edu1 0.85 0.79 0.64
Supply Side CIO Roles CR= 0.84 AVE= 0.62
Edu1 0.72
Edu2 0.86 Edu2 0.63
Edu3 0.89 Edu3 0.69
Information Steward Role CR= 0.83
AVE= 0.79
Info.S2 0.71 0.83 0.68 Info.S2 0.59
Info.S3 0.80 Info.S3 0.70
Info.S4 0.83 Info.S4 0.65
Utility Provider Role CR= 0.84
AVE=0.80
Ut.P2 0.85 0.65 0.41 Ut.P2 0.56
Ut.P3 0.75 Ut.P3 0.46
Ut.P4 0.76 Ut.P4 0.51
7
Figure 1
Figure 1 Hierarchical second-order model of CIO role expectations
DISCUSSION
The results of this study demonstrated several important issues. First, overall, the CIO role expectations instrument has exhibited solid psychometric properties and therefore researchers can use this instrument with confidence in future. Second, two items have represented the weaknesses of this instrument (Re. Arch 4 and Info.Stew1) which indicate the need to pay more attention to verifying these two roles and suggesting some other relevant items that can measure them precisely. Recall that the exploratory factorial validity for this instrument conducted by the developers (Smaltz et al. 2006) has led also to omitting two items, yet they are different ( was St1 and Ut.Prov4).
Furthermore, there is a possibility to model the constructs of this instrument in different way (six factors; two factors; and one factor null model) as the CIO role theory suggested, yet the three null models have exhibited different psychometric properties. The factor loadings for some items and consequently the AVEs of the constructs of the two- and one-factor null models have decreased to be below the acceptable cut off (0.50) which indicates questionable convergent validity and that give preference to the six factors null model against the two and one- factor null models. One can order these three null models according to their quality as follows: six-factors then the two-six-factors and then one-factor.
Moreover, as far as the hierarchical modelling is concerned, the results also support the possibility to model the constructs of this instrument as a second-order model. The second order model presented in this study exhibited
Strategist R2 =0.89
Relationship Architect R2= 0.38 Integrator R2= 0.55 Educator R2= 0.64 Information Steward R2= 0.68 Utility Provider R2= 0.41 Supply Side Roles Demand Side Roles
First-order Model Second-order Model
St1 St2 St3 St4 St5 St6 Re.Ar1 1 Re.Ar2 Re.Ar3 Inneg1 Integ3 Integ4 Edu1 Edu2 Edu3 Info.s2 Info.s3 Info.s4 Ut.Pr2 Ut.Pr3 Ut.Pr4 0.90* 0.62* 0.75* 0.79* 0.83* 0.65* St1 St2 St3 St4 St5 St6 Re.Ar1 1 Re.Ar2 Re.Ar3 Integ1 Integ3 Integ4 Edu1 Edu2 Edu3 Info.s2 Info.s3 Info.s4 Ut.Pr2 Ut.Pr3 Ut.Pr4
8
good estimates for CR, AVE, β, R2, and GoF. What is more, the results confirmed the validity of this instrument (after minor changes were made in the wording of some of its items) to measure the CIO role in different types of industries not just the healthcare sector in which it was developed. That is consistent with the results found by Seddon, Walker, Reynolds and Willcocks (2008).In addition, The results provide support for the CIO role theory in two central issues: (1) the CIOs is fulfilling a configuration of roles not just one specific role (Chen & Wu 2011; Peppard et al. 2011) and that confirms that the CIO role is a multidimensional variable; (2) the CIO roles can be grouped into two major categories: supply side roles and demand side role (Broadbent & Kitzis 2005; Mark & Monnoyer 2004).
This study has contributed some empirical evidence to the CIO role theory and practice. From the theoretical perspective, this study has validated a recent CIO role measure, so that IS researchers can use this instrument in different context with confidence. This study has also add another example on how to use SEM as a contemporary methods to validate and test the hierarchical models of IS instruments. In addition, the results of this study provides evidence on the configuration of roles that the CIO perform and the nature of this roles (technical vs. strategic) which is consistent with prior CIO literature. Some gaps on the literature also have been identified by this study in terms of clarifying the information steward and the relationship architect roles of the CIO.
The findings of this study as well have some implications for practitioners. The results have confirmed that 23 out of 25 CIO role expectations are significant from the practitioner’s perspective in different industries, which indicates the need for the CIOs to give their attention to fulfil those expectations to be effective. Findings also reflects the importance of both supply and demand side CIO roles, therefore CIO should consider the duality of their role in the modern firms.
CONCLUSION, LIMITATIONS, AND FUTURE RESEARCH
To conclude, the analysis proves that the CIO role expectation instrument has exhibited solid validity and reliability despite some minor weaknesses. The results also demonstrate the possibility to model the constructs of this instrument in different null and hierarchical models, and the validity of this instrument to measure the CIO role in different types of industries not just the healthcare sector in which it was developed.
Despite the key findings reported in this study, some limitations should be acknowledged. The findings of this study represent the perceptions of Australian CIOs which might not match the perceptions of CIOs in other countries. In addition, the nomological validity (Cronbach & Meehl 1956) of the CIO role expectations instrument which requires linking the constructs of this instrument with other constructs in a nomological network and then assessing its construct validity within the structural model has not been done due to a lack of data regarding another construct which can be used to test the relationship between the two constructs .
This study has identified some gaps that warrant further research. More studies are required to re-examine the two roles of the CIO as a relationship architect and the information steward as that could help to improve the CIO role measurement in regard to those two specific CIO roles. Also, there is a need for studies that examine the construct validity for the constructs included in the models tested in this study by linking them with a nomological network with other personal and/or organisational factors such as the CIO’s compensation, productivity, firm performance, and firm profitability using structural equation modelling.
COPYRIGHT
[] © 2013. The authors assign to ACIS and educational and non-profit institutions a non-exclusive licence to use this document for personal use and in courses of instruction provided that the article is used in full and this copyright statement is reproduced. The authors also grant a non-exclusive licence to ACIS to publish this document in full in the Conference Papers and Proceedings. Those documents may be published on the World Wide Web, CD-ROM, in printed form, and on mirror sites on the World Wide Web. Any other usage is prohibited without the express permission of the authors.
REFERENCES
Armstrong, JS & Overton, TS 1977, 'Estimating Nonresponse Bias in Mail Surveys', Journal of Marketing Research (JMR), vol. 14, no. 3, pp. 396-402.
Arthur Andersen & Co 1988, The Changing Shape of MIS: A Second Look, Chicago, IL.
9
Broadbent, M & Kitzis, E 2005, The new CIO leader: setting the agenda and delivering results, Harvard Business School Press.Chau, PYK 1997, 'Reexamining a Model for Evaluating Information Center Success Using a Structural Equation Modeling Approach', Decision Sciences, vol. 28, no. 2, pp. 309-34.
Chen, Y-C & Wu, J-H 2011, 'IT management capability and its impact on the performance of a CIO',
Information & Management, vol. 48, no. 4–5, pp. 145-56.
Chin, WW 1998, 'The partial least squares approach for structural equation modeling', in GA Marcoulides (ed.),
Modern Methods for Business Research, Mahwah, NJ, pp. 295-336.
Chin, WW & Todd, PA 1995, 'On the use, usefulness, and ease of use of structural equation modeling in MIS research: a note of caution', MIS Quarterly, pp. 237-46.
Chin, WW & Newsted, PR 1999, 'Structural equation modeling analysis with small samples using partial least squares', in R Hoyle (ed.), Statistical strategies for small sample research, Sage Publications, pp. 307-41. Chin, WW (ed.) 2010, How to write up and report PLS analyse. In V.E. Vinzi, W.W. Chin, J. Hen & H. Wang (Eds.), Handbook of Partial Least Squares: Concepts, methods and applications: 655-690. Berlin Heilderberg: Springer, Verlad.
Cronbach, LJ & Meehl, P 1956, 'Construct validity in psychological tests', Minnesota studies in the philosophy of science, vol. 1, pp. 174-204.
Doll, WJ & Xia, W 1997, 'Confirmatory factor analysis of the end-user computing satisfaction instrument: A replication', Journal of Organizational and End User Computing (JOEUC), vol. 9, no. 2, pp. 24-31.
Edwards, JR 2001, 'Multidimensional constructs in organizational behavior research: An integrative analytical framework', Organizational Research Methods, vol. 4, no. 2, pp. 144-92.
Fornell, C & Larcker, DF 1981, 'Evaluating structural equation models with unobservable variables and measurement error', Journal of marketing research, pp. 39-50.
Gefen, D & Straub, D 2005, 'A practical guide to factorial validity using PLS-Graph: Tutorial and annotated example', Communications of the Association for Information Systems, vol. 16, no. 5, pp. 91-109.
Gerow, JE 2012, 'What Should Firms Look for in a CIO? SAIS proceedings, paper 14,
http://aisel.aisnet.org/sais2012/14'.
Gottschalk, P 2000, 'Information systems executives: the changing role of new IS/IT leaders', Informing Science, vol. 3, no. 2, pp. 31-40.
Henseler, J, Ringle, CM & Sinkovics, RR 2009, 'The use of partial least squares path modelling in international marketing', Advances in international marketing, vol. 20, no. 1, pp. 277-319.
Karimi, J, Gupta, Y & Somers, T 1996, 'The congruence between a firm's competitive strategy and information technology leader's rank and role', Journal of Management Information Systems, vol. 13, no. 1, p. 88.
Kearns, GS & Lederer, AL 2003, 'A Resource‐Based View of Strategic IT Alignment: How Knowledge Sharing Creates Competitive Advantage', Decision Sciences, vol. 34, no. 1, pp. 1-29.
Klenke, K 1992, 'Construct measurement in management information systems: A review and critique of user satisfaction and user involvement instruments', INFORM, vol. 30, no. 4, pp. 325-48.
10
McCall, MW & Segrist, CA 1980, In pursuit of the manager's job: Building on Mintzberg, Center for Creative Leadership.Oh, W & Pinsonneault, A 2007, 'On the assessment of the strategic value of information technologies: conceptual and analytical approaches', MIS Quarterly, vol. 31, no. 2, p. 239.
Palvia, P, Pinjani, P & Sibley, EH 2007, 'A profile of information systems research published in Information & Management', Information & Management, vol. 44, no. 1, pp. 1-11.
Peppard, J, Edwards, C & Lambert, R 2011, 'Clarifying the ambiguous role of the CIO', MIS Quarterly Executive, vol. 10, no. 1, pp. 31-44.
Preston, DS, Karahanna, E & Rowe, F 2006, 'Development of shared understanding between the Chief Information officer and top management team in U.S. and French Organizations: a cross-cultural comparison',
Engineering Management, IEEE Transactions on, vol. 53, no. 2, pp. 191-206.
Seddon, P, Walker, D, Reynolds, P & Willcocks, L 2008, 'A Case-Based Assessment of the Descriptiveness of Three CIO Typologies and Validity of Two CIO-Effectiveness Models" (2008). ACIS 2008 Proceedings. Paper 90.http://aisel.aisnet.org/acis2008/90'.
Segars, AH 1997, 'Assessing the unidimensionality of measurement: a paradigm and illustration within the context of information systems research', Omega, vol. 25, no. 1, pp. 107-21.
Segars, AH & Grover, V 1993, 'Re-examining perceived ease of use and usefulness', Mis Quarterly, vol. 17, no. 4, pp. 517-25.
Sivo, SA, Saunders, C, Chang, Q & Jiang, JJ 2006, 'How low should you go? Low response rates and the validity of inference in IS questionnaire research', Journal of the Association for Information Systems, vol. 7, no. 6, p. 17.
Smaltz, D, Sambamurthy, V & Agarwal, R 2006, 'The antecedents of CIO role effectiveness in organizations: An empirical study in the healthcare sector', IEEE Transactions on Engineering Management, vol. 53, no. 2, pp. 207-22.
Stewart, KA & Segars, AH 2002, 'An Empirical Examination of the Concern for Information Privacy Instrument', Information systems research, vol. 13, no. 1, pp. 36-49.
Straub, D, Boudreau, MC & Gefen, D 2004, 'Validation guidelines for IS positivist research', Communications of the Association for Information Systems, vol. 13, no. 24, pp. 380-427.
Straub, DW 1989, 'Validating Instruments in MIS Research', MIS Quarterly, vol. 13, no. 2, pp. 147-69. Tabachnick, B & Fidell, L 2007, Using Multivariate Statistics, 5 edn, Allyn and Bacon, Boston.
Tenenhaus, M, Vinzi, VE, Chatelin, Y-M & Lauro, C 2005, 'PLS path modeling', Computational Statistics & Data Analysis, vol. 48, no. 1, pp. 159-205.
Werts, CE, Linn, RL & Jöreskog, KG 1974, 'Intraclass reliability estimates: testing structural assumptions',
EDUCATIONAL AND PSYCHOLOGICAL MEASUREMENT, vol. 34, no. 1, pp. 25-33.
Wetzels, M, Odekerken-Schröder, G & Van Oppen, C 2009, 'Using PLS path modeling for assessing hierarchical construct models: guidelines and empirical illustration', MIS Quarterly, vol. 33, no. 1, pp. 177-95. Wu, J, Chen, Y & Sambamurthy, V 2008, 'The Impacts of BTM Capability and CIO Role Effectiveness on Firms' Information Technology Assimilation: An Empirical Study.', ICIS 2008 Proceedings. Paper 76.