Faculty of Engineering and Surveying
Hydroelectric Generators for Third World Countries
A Dissertation submitted by Mr Nicholas Burton-Ree
In fulfilment of the requirements of Mechanical Engineering
November 2013
Abstract
Today‟s society is becoming more pressured to produce renewable energy,as some of the world‟s resources are becoming scarcer and the population is increasing. The push to find a new reliable eco-friendly energy source is becoming ever so relevant. Due to the high demand of electricity, the cost of power is expensive and the ability to access the resource is difficult for many poorer areas in the world. These third world areas are in desperate need of power to allow food and medical supplies to be stored, and as a result, distributed in the needed areas.
Papua New Guinea which is located just north of Australia has some of the toughest terrain in the world and is rated high in the top 50 third world nations. It is the perfect location for a hydroelectric system. Micro hydroelectric generators are becoming more and more common in remote locations. The disadvantage to these systems is that specifically designed turbines are expensive and time consuming to design for the location. A solution to this problem is to implement an already designed centrifugal pump as a turbine. At the small cost of efficiency the use of a pump can produce a low cost and reliable energy source.
Disclaimer Page
University of Southern Queensland Faculty of Engineering and Surveying
Limitations of Use
The Council of the University of Queensland, its faculty of Engineering and Surveying, and the staff of the University of Queensland, do not accept any responsibility for the truth, accuracy or completeness of the material within or associated with this dissertation.
Persons using this material do at their own risk and not of The Council of the University of Queensland, its staff of The University of Southern Queensland and the faculty of Engineering and Surveying.
This dissertation is an educational designed critique only to satisfy the scope of this exercise and has no validity beyond what is required. This project is to satisfy the pair courses “Research Project” and is to contribute to the completion to the educational requirement of the student‟s degree. This Dissertation, the drawings, mechanical components and any other material are set in the appendices and should not be used for any other purpose. If so, they do at their own risk.
Candidates Certification
I certify that the ideas, designs and experimental work, results, analysis and conclusions set out in the dissertation are entirely my own efforts, except where otherwise indicated and acknowledged.
I further certify that the work is original and has not been previously submitted for assessment in any other course or institution, except where specifically stated.
Student Name: Nicholas Burton-Ree Student Number: 0050101614
Signature
Acknowledgements
It is with great pleasure to have the opportunity to thank everyone who helped and supported me throughout the year of working on my project.
I would firstly like to sincerely thank my co-supervisors Les Bowtell and Malcom Gillies. I would not have been able to complete such work without their guidance, knowledge and support throughout this project. They were always there when I had a question or needed help and they were always willing to take the time for me.
On a personal note I would like to thank all of my family and friends who gave me the confidence and strong support to complete the thesis.
Nicholas Burton-Ree
Contents
Hydroelectric Generators for Third World Countries ... 1
Abstract ... 2
Disclaimer Page ... 3
Limitations of Use ... 3
Candidates Certification ... 4
Acknowledgements ... 5
Contents ... 6
List of Tables ... 12
List of figures ... 12
Abbreviations ... 14
Overview of the Dissertation ... 16
Risk Assessments ... 17
Chapter 1 ... 18
1.1 Introduction ... 18
1.2 Project Aim ... 20
1.3 Assessment of Consequential effects ... 21
1.3.1 Consequential effects and Responsibility ... 22
1.4 Background ... 22
1.5 Target Area ... 23
Chapter 2 ... 25
2.1 Introduction ... 25
2.2 Third World Countries ... 25
2.3 Papua New Guinea ... 26
2.4 Small Hydroelectric Generation ... 27
2.5.2 Energy Output ... 31
2.5.3 Turbines... 31
2.5.4 Efficiencies ... 33
2.5.5 Economics ... 34
2.5.6 Sustainability and Ecological Impacts ... 34
2.5.7 Social Benefits ... 35
2.5.8 Environmental Benefits ... 36
2.6 Pump as a Turbine (PAT) ... 36
2.6.1 How Does a PAT Operate ... 38
2.6.2 Cavitation ... 40
2.6.3 Who has done this before ... 40
2.7 Mathematical Relationship ... 41
2.7.1 Understanding pump performance curves ... 41
2.7.2 Pumps as Turbines performance Curves ... 43
2.7.3 Generator Selection ... 44
2.7.4 Experimental Setup ... 48
Chapter 3 ... 50
3.1 Methodologies, Timelines and Resources ... 50
3.1.1 Methodology ... 50
3.1.2 Research ... 50
3.1.3 Analysed Approach... 51
3.1.4 Resources ... 52
3.1.4.1 High Volume Centrifugal Pump ... 52
3.1.4.2 1kW Single phase generator (Prototype) ... 52
3.1.4.3 Access to the Hydraulic Labs ... 53
3.1.4.5 Flow and Torque Meters ... 53
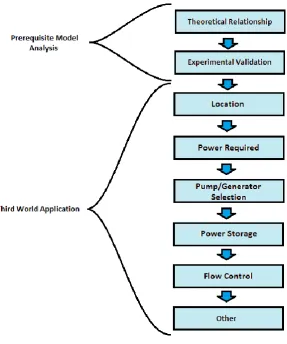
3.1.5 Prerequisite Model Analysis ... 53
3.1.5.1 Theoretical Relationship ... 53
3.1.5.2 Experimental Validation ... 53
3.1.6 Third World Application ... 54
3.1.6.1 Location... 54
3.1.6.2 Power Required ... 54
3.1.6.3 Pump and Generator Selection ... 54
3.1.6.4 Power Storage ... 54
3.1.6.5 Flow Control ... 55
3.1.6.6 Other ... 55
3.2 Analytical and Experimental Analysis ... 56
3.2.1 Selecting the PAT ... 56
Chapter 4 ... 57
4.1 Prerequisite Modal Analysis ... 57
4.2 Theoretical Relationship ... 57
4.2.1 Power Generation ... 58
4.2.2 Calculations at 15m ... 59
4.3 First Test ... 59
4.4 Pump as a Turbine Prototype ... 61
4.5 Previous Prototypes and Experiments ... 61
4.6 Resources Available ... 62
4.7 Prototype ... 62
4.7.1 Load Simulation ... 64
4.7.2 Testing procedure ... 65
4.8.1 Results ... 66
4.9 Testing Validation Results and Discussion ... 67
4.9.1 Test One ... 67
Chapter 5 ... 69
5.1 Location ... 69
5.1.1 General Geographical analysis ... 70
5.1.2 Area ... 71
5.1.3 Runoff Coefficient ... 72
5.1.4 Rainfall Intensity ... 72
5.2 Peak Discharge ... 73
5.3 Power Required ... 74
5.3.1 Type of Generator ... 74
5.3.2 DC power source ... 76
5.3.3 DC appliances ... 77
5.3.4 Refrigerator ... 77
5.3.5 Lighting ... 78
5.3.6 Ceiling fan ... 78
5.4 Total power ... 79
5.5 Battery Sizing and Selection ... 79
5.5.1 Battery Charging and Selection ... 82
5.5.2 Regulator Sizing and Selection ... 82
5.5.3 Fuse Control ... 82
5.6 Schematics ... 83
5.7 Transmission Lines ... 83
5.8 Efficiency Losses ... 84
5.10 System Analysis ... 86
5.10.1 Weir and intake ... 86
5.10.2 Pipe inlet ... 88
5.10.3 Piping ... 89
5.10.4 Pipe Materials... 89
5.10.5 Flow Control ... 91
5.10.5 Flow control valves ... 92
5.11 Pump as a Turbine Selection ... 96
5.11.1 Matlab Analysis ... 96
5.12 Results ... 99
Efficiencies of PAT performance ... 102
Characteristics of the selected PAT ... 103
5.12.1 Cost ... 104
Chapter 6 ... 105
6.1 Conclusion and further work ... 105
6.2 Further Work ... 107
6.2.1 PAT performance prediction ... 107
6.2.2 Torque available as a PAT ... 108
6.2.3 Pump as a Turbine information readily available ... 108
Appendix A ... 109
Project Specification ... 109
Appendix B ... 112
Pump Performance Sheets ... 112
Appendix C ... 120
Matlab Code for Simulations ... 120
Risk Assessment ... 130
Appendix E ... 144
Tables ... 144
Appendix F ... 150
Stormwater Runoff ... 150
Appendix G ... 155
Battery Requirements ... 155
List of Tables
Table 1 Test one results ... 66
Table 2 Error between theoretical and experiment ... 68
Table 3Advantages and disadvantages of AC ... 74
Table 4Advantages and disadvantages of DC ... 75
Table 5 DC Storage system advantage and disadvantages ... 76
Table 6Real power required (W) ... 79
Table 7 Pipe Materials ... 90
Table 8 Weighted Pipe Selection process ... 91
Table 9 Valve Analysis ... 93
Table 10 Percentage Head Loss ... 94
Table 11 Valve Decision Matrix ... 95
Table 12 Head Required for Pump Model ... 99
Table 13 Required Flow Rate ... 101
Table 15 Pump Analysis... 103
Table 16 Gantt Chart ... 145
Table 17 - Deadlines ... 146
Table 18 Average Ceiling fan consumption... 147
Table 19 Average Refrigerator consumption ... 147
Table 20 Pump Model BEP's... 148
Table 21 Recommended Manning's Value ... 152
Table 22 Surface Description ... 153
Table 23 Channel Flow Pattern ... 154
Table 24 Australian Standards - Autonomy ... 156
Table 25 Battery Specification Guide ... 156
List of figures
Figure 2: Targeted Site Location (Google Maps, Papua New Guinea 2013) ... 24Figure 3 Flow Rate and Head (Google Images 2013)... 29
Figure 4Turbine Efficiencies... 33
Figure 5Finding the Balance between Objectives ... 35
Figure 6Cost vs. Efficiency ... 37
Figure 7PAT Operation ... 39
Figure 8Forces within a PAT ... 39
Figure 9Performance for Specific Speeds ... 41
Figure 10Pump Head vs. Flow and Efficiency Curve ... 42
Figure 12PAT Head and flow and Site and Turbine Curve ... 44
Figure 13Test Experiment (Derakhshan, Anourbakhsh, 2007) ... 48
Figure 14Dimensionless BEP of tested PATs (Derakhshan, Anourbakhsh, 2007) ... 49
Figure 15Analysis Approach ... 51
Figure 1 Hydroelectric Generator Prototype ... 52
Figure 16 50-32-160 performance data ... 59
Figure 17Simulation Code for Prototype Pump ... 60
Figure 18Matlab Output ... 60
Figure 19Prototype Schematics... 63
Figure 20Prototype PAT Generator ... 64
Figure 21Simulation Setup ... 65
Figure 22Test vs. Theoretical ... 67
Figure 23Site Location ... 69
Figure 24Catchment Area ... 72
Figure 25Average power required ... 76
Figure 26Starting behaviour of electric motors ... 77
Figure 27Available Battery arrangements ... 81
Figure 28Battery Schematics ... 83
Figure 29Transmission line ... 84
Figure 30Weir Design ... 87
Figure 31Weir Concept ... 87
Figure 32Suction Filter ... 88
Figure 33 Matlab Process ... 98
Figure 34 Head Required for Pump Models ... 100
Figure 35 PAT efficiencies ... 102
Figure 36 PAT Efficiency ... 103
Abbreviations
PAT Pump as a Turbine BEP Best Efficiency Point HEC Hydroelectricity η Efficiency
H Head, m
N Rotational Speed, rpm
g Gravitational acceleration, 𝑚/𝑠2 P Power, W, kW
Q Volumetric Flow Rate, 𝑚3/𝑠
𝑄𝑡 The flow rate of the turbine at best efficiency point
𝑁𝑡 The turbine running speed 𝑁𝑝 The rated pump speed
𝑄𝑏𝑒𝑝 The pumps flow rate at the best efficiency point 𝜂𝑚𝑎𝑥 The pumps maximum efficiency
𝐻𝑡 The head of the turbine at best efficiency point 𝑁𝑡 The turbine running speed
𝐻𝑏𝑒𝑝 The pumps Head at the best efficiency point
AC Alternating Current DC Direct Current
W Watts
𝐶𝑥 Battery capacity, specified for an appropriate discharge rate x, (AH)
Overview of the Dissertation
This dissertation is as organised:
Chapter 1 defines the purpose of the proposed idea of a Small Hydroelectric generator and explains in detail of where the system will be installed. This chapter also investigates the capacity of the generator and briefly outlines the dissertation content.
Chapter 2 is the review of literature relevant to the project. This chapter discusses in detail the information found on topics required for this dissertation and how the information will prove to be beneficial to the design and application of a small hydroelectric generator.
Chapter 3 defines the suitable methodologies for the research and development in designing the hydroelectric generator. This chapter also examines the risks involved with operating the generator. The resources required for this project are also identified.
Chapter 4 details the design of the hydroelectric system. It shows the justification and functions of each component. This chapter contains the theoretical calculations obtained from the literature review and summarises the finalised chosen design. This includes validating the theoretical calculations with the prototype.
Chapter 5 isthe summation of the results found from the test and theoretical calculations. The outcomes of the results are used to finalise the design.
Risk Assessments
All of the risks involved in the project were evaluated and taken into serious consideration. To comply with the standards of the University of Southern Queensland, risk assessments were completed for both the physical and theoretical risks. A physical risk was defined as the ability to cause physical harm or damage to a body or object. Theoretical risks were defined as the risks that could damage the dissertation or work produced.
Chapter 1
1.1
Introduction
Many of the remote locations in Papua New Guinea use fuel powered generators to gain access to power. Thus, as a result, they have high costs due to poor fuel efficiency, low consistency of power production and the inability to get fuel to many particular locations (Chalapan, Kaluwin 2000). Consistent power production is extremely important for the storage of food and medical supplies. Consequently, if this is not available, then often the site will have to go without because of the inconsistent power supply from fuel generators. The emissions, common fuel and oil spills from each generator are also detrimental to the environment, therefore resulting in a need for a new electrical source.
Hydroelectricity (HEC) is an established energy generation technology that has been used successfully for over one hundred years. HEC is the generation of electricity by harnessing the potential energy of flowing water using a turbine of some sort and converting it into rotational energy. It currently makes up 17% of the world‟s power production (British Hydropower Association 2011)and is growing due to advancements in technology and availability of parts. Australia has over one hundred hydroelectric plants located in NSW and Tasmania alone (Clean Energy Council 2012).
Small hydroelectric generators became a strong focus after the oil crisis that occurred in the 1970‟s as an alternative power source(World Intellectual Property Organization 2011). The costs per kWhr of energy produced by these systems were higher than when compared to a large scale plant and as a result this is a major obstacle for small hydro- electric generators. Components for the micro-hydro plants are relatively expensive and are only supplied from a few companies. Nevertheless, this can be overcome by sourcing equipment from other suppliers who may not be traditionally used for the direct purpose of micro-hydro generation. Therefore, an applied conceptis using a common commercial centrifugal pump as a turbine also known as a PAT.
Using a pump as a turbine is an attractive and feasible alternative to the commercial Pelton wheel. Furthermore, pumps are relatively reliable machines with quite a simple function and operation. Centrifugal pumps are also one of the most common mechanical machines and are readily available 'off the shelf' in many countries. From an economical point of view, it is often stated that the capital payback period of PATs is in the range of 5-500kW over two years or less (Louvian, 1992). However, the decision in using a PAT is influenced by many factors such as, efficiency, cost, availability and potential energy from the site location.
Hence, a small hydroelectric generator using a pump as a turbine should be applicable for the remote locations in Papua New Guinea. The generator could be created using commonly sourced parts.
1.2 Project Aim
The dissertation will highlight the cost effective aspect of using a PAT instead of a purposely designed turbine. The reader should also be able to use the material in this dissertation to gain an understanding of how to select an appropriate pump for varying head and flow rates.
This project involved theoretically testing the use of a centrifugal pump as a turbine and compared the findings to actual testing on the application. The system was designed as a whole and each component was researched in order to justify its use. The dissertation clearly and accurately demonstrates how and why each component was chosen.
The Small hydroelectric generator was to power a small hospital room in a remote location consisting of:
1 Medicines Refrigerator 5 Lights
1 Ceiling Fan
The generator should be able to produce approximately around 6-10kW.hr per day depending on the specific equipment selection. It was expected that the appliances used in the area were not efficient and they had a high power draw.
The hypothesis was firstly, that the use of a pump as a turbine must be proven to be an appropriate application in both cost and power generation.
1.3
Assessment of Consequential effects
1.3.1 Consequential effects and Responsibility
During the design process and analysis of the dissertation, the engineer‟s code of ethics must always be followed. This section contains the basic practices of the code that were applied to the completion of this work.
The Institution of Engineers Australia has a strong practice of the four following practices.
1. Demonstrate Integrity 2. Practise Competently 3. Exercise Leadership 4. Promote Sustainability
By following the guidelines on professional conduct as set by engineers Australia 2013, they were not intended by engineers Australia to be interoperated as a full or exhaustive list of the situations and circumstances which may compromise compliance and noncompliance of the code of ethics. The dissertation was completed using judgement, interpretation and balanced decision-making in content.
1.4
Background
A survey taken in 2010 showed that Papua New Guinea had a population of around 6.7 million in habitants(Australian Department Of Foreign Affairs 013). 87.5% of the population were located in rural areas while the other 12.5% were urban.
Studies have also shown that the annual growth in population for rural areas in PNG is 2.4%, which is .2% greater than the urban growth and was expected to double every 30yrs (Health Service Delivery Profile Papua New Guinea 2012). As a result, demand for power would increase in remote locations as time progresses due to higher population growth.
Although the population is growing at a remarkable rate, the technological advancements and medical supplies struggle to keep up with the ever so increasing population. Medical supplies are only able to be given to villagers in the remote locations on very few occasions and must be used immediately as there are few electric fridges. Consequently, the lack of power throughout the highlands has had many detrimental effects on the country.
PNG has an average rainfall of around 2700mm in the wet season. This had varied by only 15% since 1973 and has had a higher consistency in the highland's central location. Thus fortunately, the rural locations have access to fresh flowing water all year round (Papua New Guinea Initial National Communication 2000).
1.5
Target Area
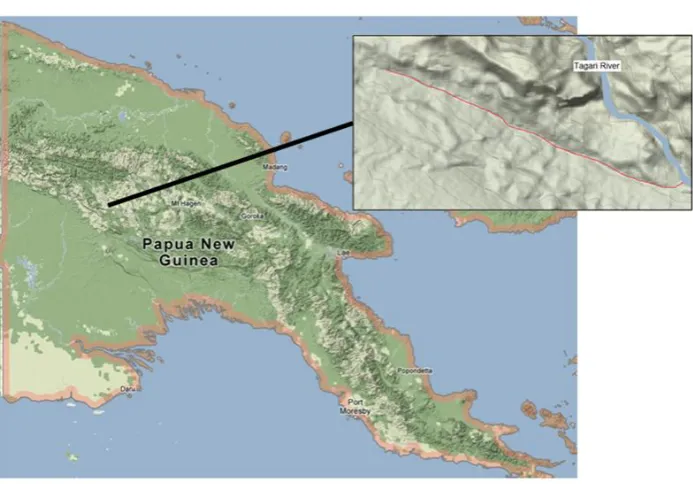
Figure 1: Targeted Site Location (Google Maps, Papua New Guinea 2013)
Figure 1 shows a small gully that is located in the central highlands in Papua New Guinea,this is on the Tagari River. The gully is approximately 6km and has a drop of 600m from the head of the gully to the Tagari River, thus, easily producing the required volume flow and head to power the small hydro electric generator (Google Maps Terrain 2013).
The generator will be designed to be installed on the creek and power a small hospital room located near the gully. Due to the length of the gully, a positive feature would be that it leaves a sufficient amount of room to choose where on the gully the small hydroelectric generator would be installed.
This will be depending on the following factors: Village location
Gully creek flow
Access to hydro electric generator Losses of power transmission lines
Chapter 2
2.1 Introduction
The concept of using a centrifugal pump as a turbine is not an original idea. It has been attempted in the past as an alternative application for a turbine. The concept has been deemed successful and under the correct condition, proving to be effective. The global energy demand is rapidly increasing, particularly in developing countries over the world due to both an increase in population and industrialisation. In order to meet the ever growing demand in power production, new energy sources are required and quickly (Alexandratos,2005), (Bradshaw, 2013),(Fischer, Schrattenholzer, 2001), (Hans-Holger, Popescu, 2000). The purpose of this chapter is to review the literature relating to small scale hydroelectric power and pumps as turbines.
2.2 Third World Countries
Third world is a terminology that arose during the cold war to help define countries that both sided with America and allied states or with the communist bloc (for example the Soviet Union)(Gaddis, 1992),(Haass, 1997). This terminology was then recognised as a way to categorize nations based on three groups:
Social Political Economical
The 1.5 billion is seen as an improvement over the years, but this is not due to the improvement of power supply to people. The improvement is due to the urbanization of areas based at power supply locations. No improvements have been made to develop the infrastructure of power transmission to remote locations, and hence many have moved to the power source. Therefore, the density in specific targeted areas has increased rapidly (Papua New Guinea, Initial National
Communication,2000).
This dilemma has two detrimental impacts on the nations affected by this phenomenon:
1. The over-population of the area results in damage to the eco-system. This is due to both pollution and using up the resource available for that specific location. Erosion is also a large problem that causes damage to land, structures and can result in heavy costs. Often erosion occurs when the soil is overloaded or as a consequence of flowing water. Furthermore, poor urbanization frequently results in deficient water control which can be attributed to lack of funding, thus causing the ground to become unstable (Blaikie,1985).
2. The rest of the county is not being used to its possible potential. The resources and space available for society are not used because of the lack of access to electrical power at the location. Subsequently, using the land and space allows less strain on the environmental eco system due to the inhabitants and density of man (Loffler,1977).
2.3 Papua New Guinea
At the same time, population growth in the country is increasing but economic growth is negligible, and hence the country is stagnating as a nation. (Windybank, Manning, 2003). However, the only growth seen by the nation has been in the mining and petroleum sectors due to their large export of their resources.
The greatest concern for Papua New Guinea is the imbalance of the economy, and this has been in existence since independence. The condition of Papua New Guinea has been the result of several different factors. Policies which were implemented were not all beneficial and the governments had failed to correct them. The rural sectors of the country have been restricted, thus this was largely due to the lack of infrastructure and low availability of resources. Consequently, as far as rural villagers were concerned, anecdotal evidence suggested that many believed that their quality of life was now worse than it was 20 years ago (Windybank, Manning, 2003). It is apparent that funding will go into other sectors before the electrical infrastructure is addressed. Therefore, with the lack of government budgets and the continuous action of urbanisation, the country will continue to struggle. Accordingly, the living conditions of individuals will need to improve instead of declining.
2.4 Small Hydroelectric Generation
There are a number of advantages and disadvantages of small scale hydroelectric generation systems.
2.4.1 Advantages
Efficient energy source. It only takes a small amount of flowing water to acquire generation from a correctly installed hydro system.
Reliable. The supply of energy continues compared to other remote power generation systems such as a fuel generator. The greatest draw (peak) is in the winter months when large amounts of energy are being used.
Reservoir is not required. If the system is small enough, the flowing water can be directed into the turbine without any reservoir required. This improves overall cost and results in less impact to the environment.
Cost effective. Once the initial cost of installation is completed, maintenance is relatively cheap and easy. The overall cost will depend on the size and material.
Generation into the power grid. If applicable the generation of power can be transmitted into the power grid. Large power generation companies will buy back the power. This is governed by how much power is generated from the system, what power is being used and on the location in relation to the grid.
Power for Third World Countries. Due to the system being a low cost power generation it is applicable to developing countries where access to power is impractical or impossible (U.S Department of Energy 2001).
2.4.2 Disadvantages
Poor generation in the dry season. The system relies on water flow for generation. During the dry periods of the year, power generation will be more difficult. Planning and research into the location beforehand is extremely important.
Size limitation. The generator cannot be expanded in the future due to the restrictions of the creek size. Although the water system might be able to be dammed, it is still limited with the floe rate and the incline of the creek. Environmental impact. Although ecological damage will be minimal due to
the small scale of the generator, it still must be considered. Factors such as where and how much of the water will be diverted are important. The smallest possible environmental impact must be taken into account each time (Baxter,1977).
2.5 Basic hydraulic power concepts
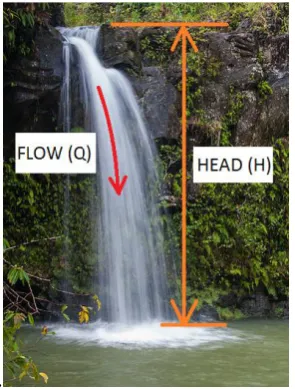
Power can be captured whenever a flow of water moves from a high location to a lower location. This change in level is known as the „head‟ and it is crucial to the ability to produce power with hydro-generation. A flowing creek with a high flow rate does not alone have the ability to produce enough potential energy to power a site. The two conditions that are required for hydroelectric is the flow rate Q, and the head H as seen in Figure 2 below (Wikicommons,2013).
[image:29.595.115.263.525.720.2].
Head represents the total energy available to the turbine. In hydrology it can be defined as the maximum available fall in the vertical direction from upstream to downstream. When a system is installed it is often defined as the distance from the inlet of the system to the turbine. The actual head seen by the turbine will always be less than the maximum head of the site due to losses in the system. This lower measure of head is known as the net head (Hamil,2011). The turbine may also be unable to extract the entire head and therefore a residual head may remain after the water leaves the turbine.
Flow rate (Q)is defined as the volume of water passing per unit of time. The unit may vary from litres per second to 1𝑚2/𝑠𝑒𝑐 (Engineering Fundamentals, 2011). Power is defined as the amount of energy consumed per unit of time which is measured in watts (W) (Engineering Fundamentals, 2011).
Hydro generation is the process of turning potential energy into electricity. Through this process it converts the potential energy of water to an equivalent amount of kinetic energy. The water‟s height which is measure in potential energy is partly converted into kinetic energy which is the speed of the flowing water (Hamil,2011). By balancing the amount of potential and kinetic energy an efficient power generation is plausible. Potential and Kinetic energy are given by:
Kinetic energy (joules) = 1
2𝑚𝑣 2
Potential energy (joules) = mgh Where:
m is the mass of the water (kg)
g is acceleration due to gravity (9.81m/𝑠2) H is the effective head available (m)
v is the velocity of the water at the intake of the turbine (m/s)
The intake velocity can be found by 𝑣 = (2𝑔𝐻)
product of the head and flow rate (Hamil,2011). Therefore, the power output of hydroelectric systems can be estimated from:
𝑃 = ƞ𝜌𝑔𝑄
Where:
P is the mechanical power in watts (W) produced at the turbines shaft Ƞ is the hydraulic efficiency of the turbine
ρ is the density of the water (1000kg/𝑚3)
g is acceleration due to gravity (9.81m/𝑠2)
Q is the volume flow rate passing through the turbine (𝑚3/𝑠)
H is the effective head available
2.5.1 Capacity factor
Often turbines can be summarized by a capacity factor. This factor is a rating of how hard the system is working.
𝐶𝑎𝑝𝑎𝑐𝑖𝑡𝑦 𝑓𝑎𝑐𝑡𝑜𝑟 % =
𝐸𝑛𝑒𝑟𝑔𝑦 𝑔𝑒𝑛𝑒𝑟𝑎𝑡𝑒𝑑 𝑝𝑒𝑟 𝑦𝑒𝑎𝑟 (𝑘𝑊𝑟
𝑦𝑟 )
𝐼𝑛𝑠𝑡𝑎𝑙𝑙𝑒𝑑 𝑐𝑎𝑝𝑎𝑐𝑖𝑡𝑦 𝑘𝑊 ∗ 8760𝑟𝑠/𝑦𝑟
2.5.2 Energy Output
Energy is defined as work done in a given time (joules)(Engineering Fundamentals, 2011). One form of energy is electricity which has its own set of units (kWhr) where one kWhr is defined as 3600 joules or the electrical supply of 1kW for a period on 1 hour. By using the capacity factor, the estimated energy output can be calculated𝐸𝑛𝑒𝑟𝑔𝑦 𝑘𝑊𝑟
𝑦𝑟 = 𝑃 𝑘𝑊 ∗ 𝐶𝑎𝑝𝑎𝑐𝑖𝑡𝑦 𝑓𝑎𝑐𝑡𝑜𝑟 ∗ 8760
2.5.3 Turbines
Turbines are classified under three main categories which also have two sub groups. They are high head, medium head and low head machines. These categories are based on the shape and design of the turbine. The two sub groups are Impulse and Reaction turbines (School of Engineering, 2010).
head micro hydro-generation systems (U.S Department of Energy,2001). Types of impulse turbines are:
Pelton Turbine consists of a wheel with split buckets around its rim to catch the water jet.
Turgo Turbine which is similar to a Pelton wheel but the water is aimed at the blades on an angle to help improve the minimum water needed to run the system.
Cross flow turbine uses direction blades to ensure that the flow is efficiently directed at the blades. The direction aids also allow the turbine to be hit twice with water jets (U.S Department of Energy,2001).
Reaction Turbines use the oncoming water to generate hydraulic lift forces to create rotation. Reaction turbines are highly efficient and rely greatly on pressure. Often reaction turbines are used for large power generation sites. The distinguishable difference between the reaction and the impulse is that the reaction encases the entire propeller system in water. All reaction turbines also have a draft tube which is the tube where the water is discharged. The draft tube also causes a pressure drop at the discharge area resulting in an improved head and overall efficiency(U.S Department of Energy,2001).
Types of Reaction turbines are:
Propeller based turbine which is similar to a ship‟s drive propeller but under operation in reverse. This style of turbine varies and the design is known to need a high flow rate to ensure the entire propeller is submerged.
Snail shell turbine directs the flow around the propellers and forces the water to pass through the system. This design is also quite similar to the Kaplan turbine.
Small hydroelectric generators have certain advantages and disadvantages that govern the practicality of the hydro system.
2.5.4 Efficiencies
The most significant way to compare turbines is by their relative efficiency. The efficiency is the rating of what power is predicted to get out of a system (Castronuovo, Peas Lopes,). In turbines the value of efficiency is effected by:
The flow rate Head of the water
Size and design of the turbine
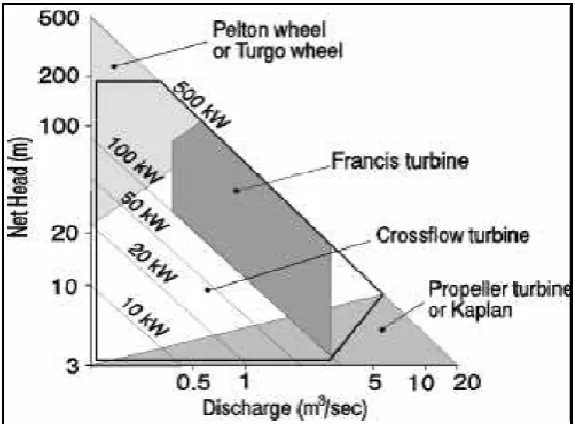
[image:33.595.118.406.400.612.2]In figure 3 it can be observed what the expected efficiencies would be with certain types of turbines. The Pelton, Kaplan and Cross flow turbines have high efficiency when it is running at low flow. The efficiency of these turbines will be used as a base line of what a normal turbine will produce.
Figure 3Turbine Efficiencies
2.5.5 Economics
With small hydroelectric generation, high head is the most cost effective for projects. High head means that a smaller volume of water is required to produce the given power. It also means that a smaller turbine and overall equipment will be used resulting in a lower cost. These conditions are often found where mountain ranges and steep gullies are good locations to produce high head (U.S Department of Energy,2001).
Due to the high capital costs of the generation system in today‟s economic system (University of Moratuwa, 2002) a new hydro electric generator system can seem expensive as it can take up to 15yrs before the capital costs can be written off. A system that can last around 50yrs without reinstalment or much maintenance is quite cost effective. However, with the short term quality and product life it is difficult to ensure that the hydroelectric system will have a long running life.
Small hydroelectric generators are often close to the consumer and have more of an effect on the consumer than a coal plant which could be located 200km‟s away (Schwaiger,K. Pfaundler, M, 2011). As a result, the „local‟ benefits are influential to the design and also the losses due to transmission lines are relatively low.
2.5.6 Sustainability and Ecological Impacts
It is important that the hydroelectric generation system when installed fits in with the location and is not detrimental to the community of the environment. This is very important as the most successful designs always look at the areas it will affect and are created to suit the particular environment. Although producing and installing the hydroelectric system can easily be carried out, the proper authorities must look at the proposed project and deem it acceptable. In order to ensure this is done the guidelines from previous hydropower projects have been reviewed.
Help Develop a common understanding on the topic hydropower.
Contribute to increase the efficiencies of the facilities and lessen their impact on the aquatic environment and the landscape.
Support the competent authorities to help accelerate the approval time. Help preserve river stretch.
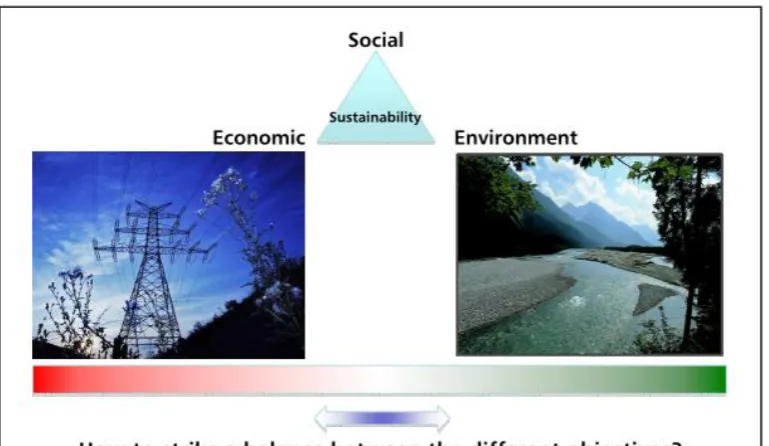
[image:35.595.115.500.249.472.2] Strike a strong balance between economic requirements and ecological and landscape needs whilst taking into accounts the social terms.
Figure 4Finding the Balance between Objectives
Figure 4 above (Situation Report on Hydropower Generation in the Alpine Region Focusing on Small Hydropower, 2011) demonstrations the area where balance must be found.
2.5.7 Social Benefits
2.5.8 Environmental Benefits
The most known benefit to the environment is the positive contribution to climate change. The system produces renewable energy and has virtually no emissions. The system must also not affect the landscape and wildlife. Papua New Guinea has a high flooding rate and the system must be designed appropriately. The inlet catchment area for the system must ensure that no downstream damage occurs (Schwaiger,K. Pfaundler, 2011).
Although looking into the ecological and economic effects is not the ultimate goal within the scope of this project, it must be noted that the design must abide by these conditions to be deemed successful. The impact on the environment must always be minimal. Once a system is installed the location must be in a better condition than before the Hydro power was installed (Schwaiger,K. Pfaundler, 2011).
2.6 Pump as a Turbine (PAT)
PAT is the operation of a centrifugal pump being used as a turbine. A small pump as a turbine can be more economical than traditional systems and therefore, when operated in reverse, can have many advantages over the traditional turbine power generation. By using a pump as a turbine costs can be decreased but at the same time, there is the downfall of efficiency. For this concept to prove viable the advantages must out way the losses (Williams, 1995).
Figure 5Cost vs. Efficiency (Burton-Ree, 2013)
The change in the cost of the hydroelectric generation system must make the project worthwhile. There are more factors that affect the overall analysis of the project. These variables are discussed in more detail in chapter three.
The main focus of cost is on the pump as a turbine compared to a conventional turbine because regardless of what system is chosen, the same piping, weir and pipe inlet will be used.
Some of the advantages of PAT are:
A wide range of flows and heads available Available standards and sizes
Easy Installation
Spare parts easy to source Fast delivery time
One of the benefits of using a pump as a turbine is the direct drive instead of a pulley system or gearing.
As a result further advantages are: Lower Friction losses
A turbine that is designed for the specific location is fitted with a vane that allows the machine to operate with a large variation of flow rates at a high efficiency. However, when a centrifugal pump is used and run backwards, it is only suitable within a very small range. The pump must be appropriately selected to ensure that it is operating within its optimal efficiency rate. The mathematical relationship used in this dissertation shows how to correctly select the right size pump to ensure it operates in its best efficiency point (BEP) and as a result produces power efficiently (William, 1995).
Pumps have been used for many different operations for many years, but the first use as a turbine is not known. It was not until Thoma and Kittredge (1931) were in the process of evaluating the characteristics of pumps, did they accidentally learn that pumps could very well be used as turbines. From this important discovery, it became a strong interest to many manufacturers. The characteristics of how the pumps operated had been under investigation.
Many different researches investigated the characteristics and predicted the behaviour but only a few examined in detail what would occur. Some of the papers that had been written on the research of pumps, as turbine operations include those, written by Williams (1995), Alatrorre-Frank (1994), Chors(1997) and Paish(2002). Although all of these papers proved to be very informative, they were showing an inconsistency of results when they were compared to each other. One theory is the difference is due to different pump designs tested. This was due mainly to the fact that each test was completed on a different type and size of pump. To ensure the validity of the papers, tests were conducted on a specific prototype. This is covered in more detail in chapter four.
2.6.1 How Does a PAT Operate
Figure 6 PAT Operation (Burton-Ree, 2013)
The two different operations both rely on two different actions to cause rotation and transferral of energy. When under normal operating conditions, the pumps use its velocity to push the water to the outer casing using the centrifugal force. It then allows the water to exit the casing via the outlet. During PAT operation, however it is quite different. The water is shot in at the outlet and uses its kinetic energy to force the impellor in a rotational manner. The centrifugal force actually disadvantages its operation as a PAT. Furthermore, the water entering with a velocity, in fact wants to stay on the outer casing due to the centrifugal phenomena. Only the increase in pressure makes the water force its way to the centre.
Figure 7 demonstrations that the waters actions are due to these different forces and pressures.
It can be seen in figure 7 that in order for the system to work and rotate the impellor, the following statement must be satisfied.
Equation 1
𝐹1+ 𝐹𝑃 > 𝐹𝑐 + 𝐹2
Equation one states that the forces caused by the pressure build up on the edge of the casing, must be greater that the centrifugal force and the force caused by the mass of water flowing into the pump must cause 𝐹1 to be greater than𝐹2 . This is only the very basic concept of what occurs is a centrifugal pump as a turbine. Turbulence within the pump causes many more in balances.
2.6.2 Cavitation
Cavitation is the process of the formation of water vapours forming in the liquid due to the change of pressures (Hamil, 2011). These phenomena results in small bubbles of vapour forming that gradually get bigger in the system. The problem is when these large air bubbles are introduced to an increased pressure and as a result the bubbles implode under the pressures. The implosion results in extremely high velocities of water trying to fill the void that had been created by the implosion. These velocities and pressure changes can result in damage to the pump casing and impellor (Hamil, 2011).
To minimise cavitation:
A generously sized inlet pipe is to be used to minimise velocity. Minimise turbulence at the inlet of the pump.
Use an impellor material that is resistant to cavitation.
2.6.3 Who has done this before
2007).The higher the operating speed the better the pump will operate as a turbine. Figure 9 displays the PAT‟s performance for specific speeds.
Figure 8Performance for Specific Speeds
It can be seen from figure 8 that it if the head remains the same, it takes a large increase in discharge to reach the increased rpm and vice versa. Currently pumps are built extremely well and have less mechanical resistance, thus allowing a high rpm to be reached. This means that the latest pumps can be acquired and the PAT generation will operate at its best possible efficiency (Rawal and Kshirsager, 2007).
2.7
Mathematical Relationship
2.7.1 Understanding pump performance curves
Before analysing a pump as a turbine, an understanding must first be gained of a pump‟s normal performance. When examining a pump, as the flow is increased the head produced decreases (Cotton CRC Water Team, 2008). This phenomena means that a relationship can be found between flow rate and head produced. With this relationship a best efficiency point can be found where the greatest flow delivery at the greatest head can be found (Merkley, 2004).
Figure 9 Pump Head vs. Flow and Efficiency Curve (Burton-Ree, 2013)
The BEP is defined as the value when the pump is operating at the maximum efficiency and is known as the best efficiency (Merkley, 2004). These BEP points also exist when using the pump as a turbine. The PAT is to operate under the optimal head and flow rate for the pump modal to be the chosen size. The best efficiency points for pumps under normal operation can be sourced from the pumps manufacturer. The BEPs given in the data sheets are affected by the pump size, not by the flow rate and head (Cotton CRC Water Team, 2008).
Figure 10 Pump Data Sheet (Southern Cross, 2010)
2.7.2 Pumps as Turbines performance Curves
Figure 11 PAT Head and flow and Site and Turbine Curve (Burton-Ree, 2013)
It can be seen from figure 11 that the greater the head and flow the greater the pump will operate as a turbine. But the pump will always be limited to the Head available at the site minus friction losses (Hf) (Williams, 1995). This available head is known as the net head. The speed of the PAT will vary due to the load from the power generation. Therefore as a result, the load is changed and this will affect the PAT curve in relation to head and flow.
2.7.3 Generator Selection
An electric generator uses the concept of turning mechanical power into electrical power. Permanent magnet generation is the most common used power generation system used today (Williams, 1995). It uses the natural phenomena of two magnetic fields passing each other and creating a charge. There are two main types of generator systems that can be chosen. They are:
Synchronous motor Induction motor
Induction motors are often used to drive pumps. This is because of their ability to handle sudden changes in speed and they are cheaper than synchronous motors (Williams, 1995). However, the disadvantage of using induction motors is that slip occurs (Electrical Technology, 2011). Synchronous motors run at a fixed speed which is defined as the synchronous speed but induction motors do not. Induction motors run at a slightly lower speed which is known as the slip speed (USQ, 2012). Equation two and three below show how to calculate the rpm for both types of motor generator speeds are required.
Equation 2
For synchronous generators:
𝑁
𝑠= 120 ∗𝑓𝑃
where P= Number of Poles f = Frequency (Hz)
𝑁𝑠 =Synchronous speed (rpm) Equation 3
For Induction generators:
𝑁𝑖𝑛𝑑 = 240 ∗𝑓 𝑃 −
120
𝑃 ∗𝑓(1−𝑠)
where 𝑁𝑖𝑛𝑑=Induction as a generator speed
f = Frequency (Hz) P= Number of Poles
In 1995 Williams released an academic paper titled „Pumps as turbines, A users guide‟. Within this paper the selection process for a pump as a turbine was discussed mathematically. The relationship of its operation was found that a PAT could operate similar under normal conditions but require a slightly increased flow rate (Q) and head (H).
The steps taken in the user‟s guide to selecting a pump covered the following sections:
1. Selecting a pump as a turbine for a particular site 2. Practical operation of a pump as a turbine
3. Design of electrical system
The three sections within the paper were based on the testing and theoretical application. Through the completion of the theoretical testing of a pumps operation, a mathematical relationship was found to allow an accurate selection of a pump to particular site conditions (Williams, 1995).
The paper stated that the calculations were based on the affinity laws. This related to the following factors:
Flow (Q) is proportional to the speed (N) Head (H) is proportional to 𝑁2
Power (P) is proportional to 𝑁3
Equation 4
𝑄𝑡 =
𝑁𝑡 𝑁𝑝
∗𝑄𝑏𝑒𝑝 𝜂𝑚𝑎𝑧0.8
Where:
𝑄𝑡 = The flow rate of the turbine at best efficiency point 𝑁𝑡 = The turbine running speed
𝑁𝑝 = The rated pump speed
𝑄𝑏𝑒𝑝= The pumps flow rate at the best efficiency point 𝜂𝑚𝑎𝑥 = The pumps maximum efficiency
And Equation 5
𝐻𝑡 = 𝑁𝑡 𝑁𝑝
2
∗𝐻𝑏𝑒𝑝 𝜂𝑚𝑎𝑧1.2
Where:
𝐻𝑡 = The head of the turbine at best efficiency point 𝑁𝑡 = The turbine running speed
𝑁𝑝 = The rated pump speed
𝐻𝑏𝑒𝑝 = The pumps Head at the best efficiency point 𝜂𝑚𝑎𝑥 = The pumps maximum efficiency
When ensuring accuracy of mathematical relationships within papers it was noted that each source had completed an experimental verification. To ensure accurate results were maintained within this dissertation an experimental test was completed. 2.7.4 Experimental Setup
An accurate experimental setup of a centrifugal pump as a turbine test was completed in 2007 by Derakhshan and Nourbakhsh. Their test procedure as seen in Figure 12 was to simulate a flow rate and head by using a normal operational pump and circulating water through a centrifugal pump in reverse and collecting data.
Figure 12Test Experiment (Derakhshan, Anourbakhsh, 2007)
Figure 13Dimensionless BEP of tested PATs (Derakhshan, Anourbakhsh, 2007)
Figure 13 shows the dimensionless results plotted variables with the specific speed. The results confirm that the application of a PAT is possible and that there are many varying conditions that affect the Best efficiency point of a turbine (Derakhshan, Anourbakhsh, 2007). To verify the finding of this dissertation and to support the mathematics used for the results an experiment has been conducted with a prototype centrifugal pump. More detail of the prototype is in chapter four.
Chapter 3
3.1
Methodologies, Timelines and Resources
To complete this dissertation to an appropriate professional level, resources, deadlines and ways of methodology must be defined. By doing so, it will ensure that each component within this dissertation is completed with appropriate time and attention. It will also ensure that no time was wasted on topics that could be seen as irrelevant or outside of the required scope of this project. Important components or milestones of the topic will be analysed and time restrictions was set accordingly. Hence, a plan of action must always be devised in case of tasks not being completed on time due to unforseen conditions that could hinder the progress. Refer to chapter one and appendix E to review resources required and deadlines set.
3.1.1 Methodology
Methodology is the way in which the project is be undertaken and what steps will be required. By understanding methodology and strategy a plan of action can be created and executed. This allows progress to be taken in the project and still be able to see if the required work is remaining within the scope that was set out in the project aim. Within this project there are two major components:
1. Appropriate project research and theoretical analysis. 2. Physical testing and practical implementation.
Hence, by following the two major components, it minimises the risk of a lack of understanding within the dissertation and as a result improves the quality of the dissertation. The following outlines the method for the project
3.1.2 Research
3.1.3 Analysed Approach
[image:51.595.137.425.201.546.2]Once research has been completed and a strong understanding of the topic is apparent, an analysed approach can be devised. Thus, this will ensure that what is to be executed is all still within the scope of the project and will help to minimise time wasted on irrelevant sections.
Figure 14Analysis Approach
Figure 14 shows the analysed approach that is used in this dissertation to ensure that the scope is met and to ensure that all appropriate aspects of the project are researched, designed and validated.The Progress map is broken down into two main groups:
3.1.4 Resources
Acquiring resources can often take a long period of time depending on the importance and the original location. To ensure that there was no time wasted over the duration of this project all resources were to be identified early. The resources required would have time frames and deadlines stated to ensure the overall methodology was followed.
The following resources were required:
3.1.4.1 High Volume Centrifugal Pump
This project was based on the operation of a centrifugal pump as a turbine. For the tested prototype a Southern Cross50x32-160 pump, Serial Number 54477 with direct coupling was used. It was connected up to the water system in the Hydraulic labs to simulate head and flow rate. The mechanical operation of the pump was of a responsible manner and all of the operation manuals were to be followed when under normal operation. The operations manual for the Southern Cross 50 x 32-160 model can be found in appendix B.
3.1.4.2 1kW Single phase generator (Prototype)
[image:52.595.113.468.514.725.2]The single phase 933Watt generator was connected directly to the coupling of the centrifugal pump. Figure 1 shows the centrifugal pump, coupled straight to the Direct Circuit permanent magnet motor. (Southern Cross pump and DC motor sources directly from the University of Southern Queensland).
3.1.4.3 Access to the Hydraulic Labs
The Hydraulic labs located on the NE end of z Block at USQ Toowoomba, was needed to complete testing of the PAT generator system. Access to this resource also included operation of the 15m head tanks and equipment contained in the lab. Appropriate risk assessments for the laboratory use were completed and they can be found in appendix D.
3.1.4.4 Piping and connections (Flanges)
To connect the PAT to the pumping system located in the lab the correct connection was required. The centrifugal pump should have been able to be connected up to the lab system and have sufficient flow. All plumbing were sourced externally to ensure quality under operation.
3.1.4.5 Flow and Torque Meters
To record all findings in detail, the flow of the water at all times should have been able to be recorded. To measure the rotational energy of the centrifugal pumps a torque meter may have been required. It is possible to calculate the torque using calculation but to avoid human error a meter is preferred.
3.1.5 Prerequisite Model Analysis
Prerequisite Model Analysis contains the theoretical relationship and the experimental validation. This section of the dissertation is to be completed before any application to the site could be made. Consequently, this ensures that applied analysis of the site is based on validate mathematical relationships.
3.1.5.1 Theoretical Relationship
The modified mathematical relationships from chapter two must be analysed and applied to the PAT application. Any modifications made to the calculations are noted and justified.
3.1.5.2 Experimental Validation
3.1.6 Third World Application
Once the mathematical background is deemed acceptable, it then can be applied to the site in Papua New Guinea. By following the structure, it ensures that the work applied is completed efficiently and that no sections of the hydroelectric system are missed.
3.1.6.1 Location
This section looks into the specifics of the particular location. The available resources, terrain, population and environmental conditions are looked at in great depth.All environmental conditions must be analysed for the particular location and the hydro electric generator must be designed accordingly. This gives the design of the PAT a base condition and a limitation to operate under. The pump as a turbine must always meet the requirement of the location.
3.1.6.2 Power Required
The power requirement for the small hospital room must be specified. The equipment to be powered and its use must be justified. All equipment must be up to date and be expected to be found in such locations. This section also takes into consideration the transport of the power to specific locations and its losses.
3.1.6.3 Pump and Generator Selection
This section is of extreme importance for the dissertation. If the mathematical relationship is not accurate and not completed in a professional manner, then the whole basis of the dissertation will be incorrect. In order to produce to specific power requirements, an appropriate generator and pump must be used. A cost effective and efficient relationship between the two components must be found. In this section, three main components will be analysed and a justified relationship will be found.
1. Pump as a turbine relationship (PAT)
2. Power Generation and power produced from the flowing water 3. Cost/power production efficiency
3.1.6.4 Power Storage
will be based on generator selection which is also covered in this section. An automatic voltage regulator system will also be studied in more detail. The power storage and output must allow operation of regular appliances. Furthermore, an automated power regulation component will also accommodate for operation error. 3.1.6.5 Flow Control
In order to control the power generation the simplest way is to control the flow. Where the control system is put in place and how it is controlled will be discussed in more detail. All head losses must be accounted for.
3.1.6.6 Other
3.2 Analytical and Experimental Analysis
Before the system can be designed, the mathematical relationship between a centrifugal pump operating under normal conditions and as a turbine must be found and analysed. When a centrifugal pump is run backwards it operates at a lower efficiency and as a result lowers the power production capability. This percentage is to be calculated and applied mathematically to the specific pumps chosen. Therefore, the mathematical relationship must be validated to prove accurate in order to be used for the project‟s scope.
To validate the theoretical calculations made, an experiment was conducted on a hydroelectric generator using a centrifugal pump as a turbine. The generator system was built specifically for the purpose of this experiment only. The power production under the head and flow rate was not the specific scope of the experiment but the rpm, torque, flow rate and head were closely monitored and compared to the theoretical calculations. This is discussed in great detail in chapter four.
3.2.1 Selecting the PAT
As an understanding of the performance curves for pumps as turbines is comprehended, the mathematical relationship can now be analysed showing how to select the appropriate pump model to operate as a turbine.
When selecting the site, it is limited to a particular head and flow rate and often the minimal value would be selected, for example, the minimal flow rate throughout the entire year. By doing so, the designed hydro electric generator would operate at its maximum efficiency annually. This section examines the calculations required to select the best pump to operate under the particular conditions
The calculations can give the running conditions in terms of head and flow. They also show how to plot the efficiency of a PAT when the running conditions change and how the torque from the load can affect the operating capabilities of the generator. Thus, all of these factors must be taken into consideration when selecting the appropriate pump model.
Chapter 4
4.1
Prerequisite Modal Analysis
This chapter contains the investigation into the mathematical and experimental aspects of using a centrifugal pump as a turbine. It discusses the applied mathematics found in chapter two and the relationships that have not been analysed in past papers. By doing so, it allows this dissertation to be an improvement on previous analysis. It also discusses the experimental process using the built prototype to validate the findings.
4.2
Theoretical Relationship
In reviewing past papers it was found that the most predominant and accurate relationship between PAT operation and normal operation was by Williams (as discussed in chapter two) who produced a paper called „Pumps as turbines, A users guide‟ in 1992. This paper discussed how to select a pump according to the available head (H) and flow rate (Q). Williams discussed how pumps and PAT‟s both have BEP operating points.
Equation 6Turbine Flow Rate
𝑄𝑡 =
𝑁𝑡 𝑁𝑝
∗𝑄𝑏𝑒𝑝 𝜂𝑚𝑎𝑧0.8
Where:
𝑄𝑡 = The flow rate of the turbine at best efficiency point 𝑁𝑡 = The turbine running speed
𝑁𝑝 = The rated pump speed
Equation 6 demonstrates that the flow rate of the turbine equals the ratio of the speed of the turbine and the pump multiplied by the flow rate of the pump under normal operation divided by the pumps efficiency. Equation 6can be used to find the required flow rate to operate the PAT at its BEP.
Equation 7 Turbine Head
𝐻𝑡 =
𝑁𝑡 𝑁𝑝
2
∗𝐻𝑏𝑒𝑝 𝜂𝑚𝑎𝑧1.2
𝐻𝑡 = The head of the turbine at best efficiency point 𝑁𝑡 = The turbine running speed
𝑁𝑝 = The rated pump speed
𝐻𝑏𝑒𝑝 = The pumps Head at the best efficiency point 𝜂𝑚𝑎𝑥 = The pumps maximum efficiency
Equation 7 gives the head required to have the PAT operate at the best efficiency point. By using the two calculations with the given data of the pump it can deduce if the PAT will operate efficiently for the specific location conditions (Head and Flow rate). These formulas can be rearranged to show the characteristics if you use a PAT far off its best efficiency points.
If the operation speed of the pump as a turbine is known, then the above equations can be used with data easily accessible from the pump manufacturing company. To find the RPM required by the PAT the power generation must be briefly examined. 4.2.1 Power Generation
4.2.2 Calculations at 15m
To allow validation, the theoretical calculations at the 15m head must be calculated. Knowing that the pump as a turbine operates at 1410 RPM when the system is completely open, is the starting rpm value.
4.3 First Test
Matlab 2013 was used to simulate the head (H) and Flow rates (Q). In Figure 16 the underlined sections are where the different operation specs for the pump were put in. Using the data tables sourced from the pumps manufacturers, the data spec sheet shown in figure 16 below highlights the chosen pumps best efficiency points under normal operation. Documents are also attached in appendix B.
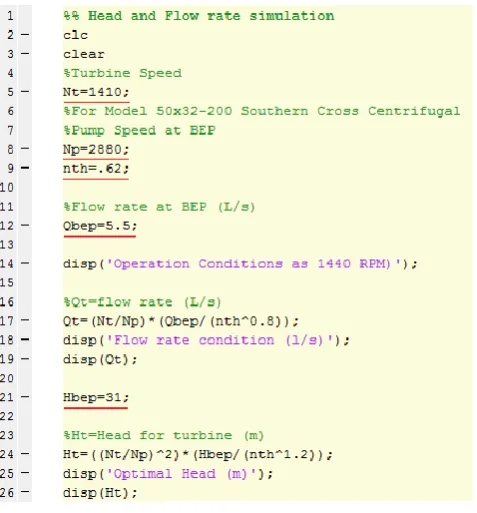
[image:59.595.116.432.417.626.2]Knowing the pumps nominal diameter of 6.375 inch or 162mm the red performance line was used. It can be seen that at 2880 RPM the pump can operate at a maximum efficiency of 62% with a head flow of 31 meter and a flow rate of 5.5 L/second.
To compare to the experimental prototype, the maximum RPM gained from the experiment was plugged into the Matlab program. This RPM is the speed that the turbine operated at in the experiment. More detail on the experiment is further in this chapter. By doing so, the code then calculates what flow and head is required to reach that speed. If the mathematical relationship is correct then the head and flow rate for both the experiment and code should be similar. The head and flow rate to reach the 62% maximum efficiency was used.
Figure 17Simulation Code for Prototype Pump
The code shown in figure 17 output for the following conditions in figure 18:
This code was then run for a total of three times at the following different turbine RPM‟s:
1410 RPM 1000 RPM 700 RPM
The results from the simulation are plotted further, under section 4.8.1.
4.4
Pump as a Turbine Prototype
This chapter contains the testing of the prototype that was purpose built for this dissertation. Before analysis can begin, the mathematical relationships described in chapter two must be validated. If not, the results and system design would prove to be inaccurate and deem this dissertation invalid. This chapter describes the testing set up based on previous prototypes and shows the overall results of how the mathematics are accurate and viable. All testing was completed at the University Of Southern Queensland (USQ) under the guidance and supervision of Malcolm Gillies and Les Bowetell.
4.5
Previous Prototypes and Experiments
In previous prototypes (described in chapter two) a complete setup of a mini hydro power plant had been installed. The systems contained the three basic components of a hydro plant:
Pump as a turbine
Generator (Power Production) Flow Control
In these previous studies, to simulate the head (H) and flow rate (Q) the system was connected up to another separate pump. This separate pump was able to change speed and as a result was able to simulate multiple heights. The pump as a turbine was a centrifugal pump driving an alternating current permanent magnet motor. The flow control was achieved using a series of valves and barometer to ensure accurate readings. The specific type of centrifugal pump used was not specified and as a result the mathematical relationship in this dissertation could not be validated without a relative error.
4.6
Resources Available
The prototype can only be designed to the limitation of the resources on hand. The goal of the prototype is to validate mathematical relationships whilst remaining in the budget of the dissertation. The USQ‟s hydraulics labs have a 15m head tank that can produce a flow rate up to 17m/s. The system flows through a 10 inch piping system before it is reduced down to 2 inch gate valve. The tank is hooked up to a recirculating system that pumps the water back into the 15m head tank. This allows testing to be completed without a time restraint due to lack of water.
4.7
Prototype