BIS RESEARCH PAPER NUMBER 229
Understanding progression into higher
education for disadvantaged and
under-represented groups
A report by CFE Research for the Department for Business, Innovation and Skills (BIS)
Authors:
Lindsey Bowes, Research Director, CFE Research Dr James Evans, Research Manager, CFE Research Tej Nathwani, Economist, CFE Research
Dr Guy Birkin, Senior Research Executive
Andy Boyd, ALSPAC Data Linkage & Information Security Manager, University of Bristol Dr Craig Holmes, CFE Associate / Research Fellow SKOPE
Professor Liz Thomas, CFE Associate Dr Stephen Jones, CFE Associate
Prepared by: CFE Research
Phoenix Yard, Upper Brown Street, Leicester LE1 5TE 0116 229 3300
www.cfe.org.uk
Avon Longitudinal Study of Parents and Children (also known as ‘Children of the 90s’) School of Social and Community Medicine
University of Bristol, Oakfield House, Oakfield Grove, Bristol, BR8 2BN 0117 331 0033
http://www.bristol.ac.uk/alspac
Acknowledgements
This research was commissioned by the Department for Business, Innovation and Skills (BIS) and was undertaken by CFE Research and Associates in partnership with the Avon Longitudinal Study of Parents and Children.
The authors are grateful to the following for their ongoing support and guidance:
Jane Carr, BIS
Susanna Greenwood, BIS Charles Ritchie, BIS Shabbir Zavery, BIS Paul Rasch, BIS
Victoria Chapman, BIS Helen Evans, DfE
Contents
Executive Summary ... 9
About this Report ... 9
Background to the research ... 9
Method ... 10
(i) Literature Review ... 10
(ii) Secondary data analysis ... 10
(iii) Primary Qualitative Research ... 10
Key findings ... 10
Role of attitudes and aspirations in the decision making process ... 11
When decisions about participation in higher education are made ... 11
Key influencing factors on decision making ... 13
Conclusion ... 15
1 Introduction ... 17
1.1 Project Background ... 17
1.2 Research Aims and Objectives ... 18
1.3 Methodology ... 19
1.3.1 Review of existing literature ... 19
1.3.2 Secondary data analysis ... 19
1.3.3 Primary Qualitative Research ... 20
1.4 Structure of this Report ... 22
2 Trends in Higher Education Participation ... 23
2.1 Current Patterns of Participation and Progression ... 23
2.3 Gender ... 25
2.4 Ethnicity ... 26
2.5 Intersection between socioeconomic status, gender and ethnicity ... 28
2.5.1 Gender and socioeconomic status ... 28
2.5.2 Ethnicity and socioeconomic status ... 28
2.5.3 Ethnicity and Gender ... 28
2.5.4 Gender, socioeconomic status and ethnicity ... 29
2.6 Factors affecting Progression to Higher Education ... 29
3 Analysis of the Longitudinal Study of Young People in England ... 31
3.1 The Longitudinal Study of Young People in England ... 31
3.2 Our Measure of Disadvantage... 32
3.3 Descriptive statistics ... 33
3.3.1 The dependent variable ... 33
3.3.2 Pupil attainment ... 34
3.3.3 The attitude and aspirations of young people... 35
3.3.4 The activities of young people at age 16-17 ... 43
3.3.5 Aspirations and attitudes of disadvantaged White young people who applied to university ... 45
3.3.6 The attitude and aspirations of parents ... 45
3.4 Econometric analysis ... 47
3.4.1 Model One: Demographic and Family Characteristics Only ... 49
3.4.2 Model 2: The Introduction of Schools Characteristics ... 49
3.4.3 Model 3: The Introduction of Attitude and Aspiration Variables ... 49
3.4.4 Model 4: The Introduction of Key Stage 2 and Key Stage 4 Attainment ... 50
4 Avon Longitudinal Study of Parents and Children ... 52
4.1 Background to the study... 52
4.2 Measure of Disadvantage ... 53
4.3 Descriptive Statistics ... 53
4.3.1 The aspirations and attitudes of young people in Avon ... 54
4.3.2 The aspirations and attitudes of parents of young people in Avon ... 56
4.4 Summary ... 59
5 Primary research findings: The decision making process ... 61
5.1 When decision making takes place ... 61
5.2 Pre-GCSE ... 62
5.2.1 Enjoyment ... 62
5.3 At school (GCSE choices) ... 63
5.3.1 Identifying careers and personal goals ... 63
5.3.2 The influence of Family at this time ... 64
5.4 At college or 6th form (when making A-level choices/college choices) ... 66
5.4.1 Subject choices ... 66
5.4.2 Expectations of higher education ... 66
5.5 Final year of college or 6th form (applying to HEIs) ... 68
5.5.1 Increased employability and financial security ... 68
5.6 Summary ... 68
6 Primary research findings: Key influences on decision-making ... 70
6.1 Introduction ... 70
6.2 Support networks and the role of parents, peers and education professionals ... 71
6.2.1 Family support networks ... 71
6.2.3 Education professional support networks ... 75
6.3 Institutional Habitus ... 76
6.4 Economic and financial influences and the role of risk ... 77
6.5 Making decisions about higher education participation: Does it feel right? ... 80
6.6 Summary ... 84
7 Conclusion ... 86
7.1 Challenges for policymakers ... 87
7.1.1 Age and stage appropriate interventions ... 89
7.1.2 Outreach by higher education institutions at all school ages ... 89
7.1.3 Changing the status quo ... 89
7.1.4 Framing participation in higher education ... 90
7.2 Ensuring the right choices for the right people ... 91
Appendix 1: Literature Search Terms ... 93
Appendix 2: Additional literature regarding gender and higher education participation ... 95
Perceptions and Expectations of HE ... 97
Wider Social Trends, Gender and Subject of Study ... 98
Habitus ... 98
Ethnicity ... 99
Gender Identities ... 100
Appendix 3: Avon Longitudinal Study of Parents and Children ... 102
Recruitment ... 102
Standard assessments of educational attainment in the ALSPAC Cohort ... 102
Education Data Collection in the ALSPAC Cohort ... 104
Ethical approval ... 104
Appendix 4: Longitudinal Study of Young People in England and National Pupil Database
data used in the analysis ... 106
The measure of disadvantage used in this analysis ... 106
Data used ... 108
Longitudinal Study of Young People in England ... 108
National Pupil Database ... 112
Appendix 5: Marginal effects ... 114
Appendix 6: Interpreting the variable coefficients in the final model which shows marginal effects ... 115
Appendix 7: Avon Longitudinal Study of Parents and Children data used in the analysis . 119 Young People ... 119
Parent (child based) ... 120
Mother ... 120
Executive Summary
About this Report
This report presents the findings from a study commissioned by the Department for Business, Innovation and Skills and carried out by CFE Research and its Associates with support from the Avon Longitudinal Study of Parents and Children (also known as the ‘Children of the 90s’ study), University of Bristol. The research was undertaken between March 2014 and January 2015 and explores the reasons, beyond educational attainment, for differential rates of participation in higher education by gender and ethnicity, particularly among lower socioeconomic groups.
Background to the research
The expansion of higher education has become a notable feature of the education system in England in recent years as the number of young people entering higher education has steadily increased since the early 1990s. However, the likelihood of participation varies significantly by age, gender, ethnicity, socioeconomic status and attainment. Successive governments have adopted policies for widening participation that have sought to raise aspirations and remove barriers to higher education for under-represented groups. Although the gaps in participation are narrowing, some groups continue to be
under-represented, and significant gaps between groups remain that are not yet fully understood.
Prior attainment has been identified as a key determinant of whether or not an individual will progress into higher education; however this does not explain all the differences that exist by key groups, and in particular, by ethnicity and disadvantage. This research adds to existing evidence by investigating what other factors might determine progression to
higher education, with particular attention paid to the role of aspirations, attitudes and behaviours displayed by young people and their parents. The objectives of this research are to:
• identify gaps in current understanding of the reasons why some groups are less likely to progress into higher education than others;
• establish the key points in a young person’s life when their learning and career aspirations are shaped and the factors that influence this process at each stage;
• explore the individual factors, including hidden influences and motivations that determine the likelihood that an individual will successfully progress into higher education; and
Method
This research was designed primarily as a qualitative study to explore in-depth the factors that influence progression to higher education amongst different groups. The research was undertaken in three inter-related stages and drew on existing research literature and
secondary data analysis of national and regional longitudinal datasets in addition to primary qualitative research.
(i) Literature Review
Two inter-related literature reviews were completed at the outset of the project. The first specifically examined factors that influence gender participation in higher education; the second was broader and took account of the wider personal, dispositional and situational factors impacting on progression. The purpose was to identify any gaps or potential ambiguities in the existing evidence and to inform our approach to the secondary data analysis and primary research.
(ii) Secondary data analysis
Data from the Longitudinal Study of Young People in England and Avon Longitudinal Study of Parents and Children was analysed to explore the role of aspirations and attitudes towards education amongst young people and their parents in influencing the likelihood of progression to higher education. The disparities in aspirations and attitudes exhibited by different groups were initially explored through summary statistics and cross tabulations. Econometric modelling was then used to further investigate the role of
aspirations and attitudes, which enabled a number of potential determinants to be controlled for jointly.
(iii) Primary Qualitative Research
A sample of young people and parents was selected from the Avon Longitudinal Study of Parents and Children for the primary qualitative research. The young people were aged 22-23 and had achieved a minimum of 5 GCSEs at grades A*-C. The young people were from the lowest tertile of the Index of Multiple Deprivation in the Survey sample. The parents included those with as well as those without experience of higher education. A total of 43 depth interviews were conducted with young people to explore in detail the individual circumstances, situations, and experiences that impacted upon and influenced decisions about higher education. Three focus groups were conducted with parents. Participants were encouraged to reflect on their experiences of and attitudes towards higher education, the importance attached to higher level study and their aspirations for their children. This qualitative research was not longitudinal, however, participants were explicitly asked to reflect retrospectively on their decisions about higher education at certain time points, and the factors that impacted upon these decisions.
Key findings
There is an extensive existing literature that examines the factors that influence
gender, ethnicity and socioeconomic status and wider social, cultural, personal and economic factors and the intersectionality of influences.
Role of attitudes and aspirations in the decision making process
The results from our analysis of the Longitudinal Study of Young People in England add to our understanding of the reasons why White disadvantaged young people and boys in particular, are less likely to progress into higher education than disadvantaged individuals from Black and Minority Ethnic groups. Our analysis revealed that White disadvantaged young people were more likely than Black and Minority Ethnic disadvantaged individuals to:
• state that they did not intend to apply for higher education during Key Stage 3;
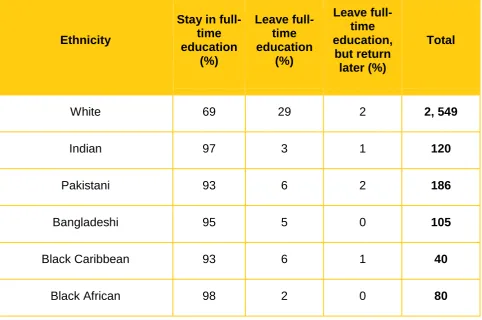
• aspire to leave full-time education at the end of Year 111;
• have poorer attitudes towards school and their academic work;
• indicate that the best jobs did not necessarily go to those who had been to university; and
• believe that university wasn’t for people like them and that it was harder for them to improve things for themselves when compared to their parents
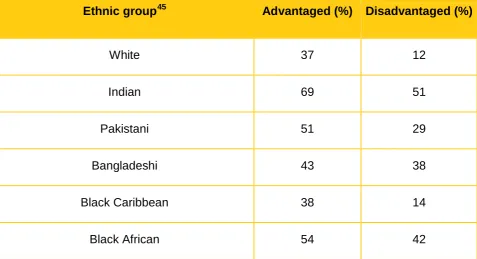
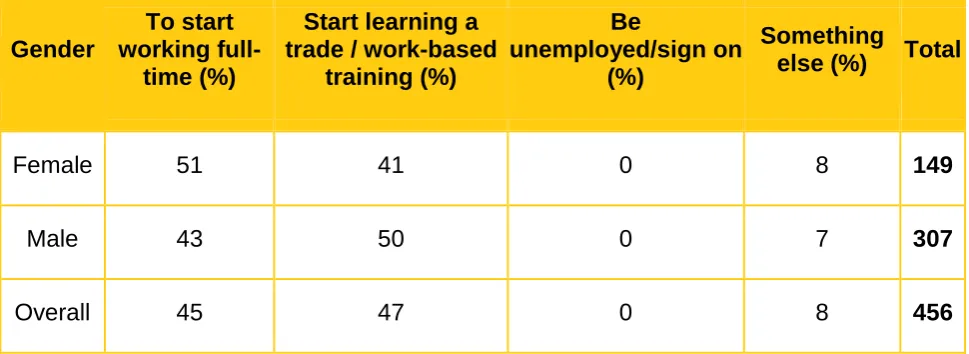
Parents of White disadvantaged pupils were also more likely to believe that leaving school at 16 did not necessarily limit an individual’s career opportunities and aimed for their child to begin an apprenticeship or full-time work at the end of Year 11.
Our analysis of the Avon Longitudinal Study of Parents and Children also found that disadvantaged White individuals and their parents generally displayed less desire to continue with their education after compulsory schooling and enter higher education than their advantaged peers.
The findings from our econometric model indicated that aspirations and attitudes do have a significant impact on whether one applies to university and they play a part in explaining gaps in application levels by gender, ethnicity and disadvantage. The major determinant of higher education applications is attainment at Key Stage 4. In the final model, significant gaps by ethnicity still remain even after controlling for school effects, aspirations and attitudes, as well as prior attainment.
When decisions about participation in higher education are made
The qualitative research explored the key points in time when decisions about education and future careers come in and out of focus for disadvantaged young people. The findings suggest that from a very young age individuals begin to explore their interests and
motivations about a wide range of activities, and that these have the potential to develop
1
into career and education aspirations over time in complex, situated ways. The table below outlines the timeline for and the process of decision-making about higher education.
Timeframe Decision making process
Pre-GCSE
Secondary data analysis suggests that even by Year 9, young people were already engaging with ideas about their chosen career path. At this point, participants in our research suggested that motivations and
aspirations associated with education and careers took the form of expressing enjoyment or an aspiration to explore an area of particular interest in more detail.
At School (GCSE choices)
At school, and when making choices about their GCSEs, participants started to move from concepts of interest and enjoyment into potential concrete educational and career opportunities.
Findings from our qualitative research suggested that those individuals with strong career aspirations and self-motivation tended to progress into higher education, whilst others tended to leave education post GCSEs. Those who chose to leave formal education aged 16 were more interested in gaining employment than more qualifications. These decisions were, however, sometimes the result of a lack of clarity about the opportunities available and the possible benefits of higher education, rather than an active choice.
College or 6th form
At this stage, participants suggested that they had formulated general views about their plans for when they left formal education. This does not necessarily mean that an individual followed this pathway, but it is the point where decisions about whether to participate in higher education or not came into sharp focus. Those who did go to college or 6th form had more deeply engaged with longer-term career planning and viewed participation in higher education as providing increased career
opportunities, the acquisition of useful, employability skills, and valuable life experiences.
Final year of college or 6th
form
Key influencing factors on decision making
The barriers facing young people entering higher education are well-defined in existing research. In contrast, less is known about the success factors, beyond educational attainment, that help young people to realise their educational ambitions, including
progression to higher education. Our research highlights that despite the apparent barriers experienced by disadvantaged groups, many do progress to higher education. This
suggests that the removal of barriers alone does not facilitate progression. According to our findings, the key drivers of success include the support of family, peer and education networks, positive attitudes toward education, the provision of relevant and timely
information, advice and guidance and an appreciation of the cost and benefits of a chosen pathway. These drivers provide the conditions necessary for an individual to attain and achieve as well as to progress and are in many ways of equal importance.
Support networks: Family, friends, education professionals
Respondents consistently spoke about the influence of support networks in making active decisions about higher education participation. Support networks were among the most influential factors in establishing specific choices made by young people we interviewed. Parental involvement in particular, often led to changes in the attitudes and behaviour of their children, which had a positive (and negative) impact on their chances of participating in higher education. A number of factors were important in shaping parental attitudes towards higher education. It was common amongst the young people interviewed who had progressed to higher education to report:
• one or more parent was in an occupation where a university education was the norm (even if this particular occupation did not historically require a degree);
• one or more parent had higher education experience and felt it was valuable for their children to study at this level; or
• although neither parent had higher education experience they strongly encouraged their children to take up the opportunity they never had.
In contrast, it was common for the parents, or wider family networks, of the young people who did not go to university to have little or no higher education experience. Although these young people still had the support of their families (and parents in particular), they were more often encouraged to make decisions based on what they felt they wanted to do, rather than being encouraged down a particular path.
Participants also stated that their peer network was an important influence on their
decisions about higher education. For example, most who went had peer groups who also went. However, it is important to note that young people can also go against their peers if their motivation and aspirations are strong enough.
Institutional Habitus
The concept of institutional habitus, or the ways in which an institution (in this instance schools and colleges) exhibit expectations of who and what its students are expected to be, is also an important influence on higher education decision-making. For the majority of participants in the research, the school or college they attended gave them a sense of what might be expected of them. While some schools were perceived to exhibit little in the way of expectations of education and career progression for their pupils, others were perceived to view university attendance as an expectation for their students and the academically able in particular. Respondents suggested that schools had a broad (although not completely pervasive) view that educational success broadly related to higher education participation. This was reinforced by a lack of formal information about alternative pathways including vocational education and training.
Economic and financial influences
Participants stated that while economic and financial factors were two of a range of influences that informed their decisions regarding participation in higher education, they were not always critical or defining factors. Those who went into higher education were not deterred by paying tuition fees and the associated costs (living expenses for example). However, they were concerned by whether a university offered value for money and whether they would achieve a return on their investment.
In contrast, the majority of respondents who did not enter higher education reported that they had been deterred by the cost. They suggested that the financial impact of
participation was ‘not worth the risk’ if there was not a job guaranteed at the end of it, or (more frequently) if they were not exactly sure of what they wanted to study or achieve by entering higher education.
The majority of participants interviewed in the depth, including those who attended higher education, had remained local to where they grew up. This was partly due to the positive associations many had about Bristol and the South West in general (and how it formed part of their cultural identity), but for many it also provided a financial safety net – this may be understandable given the socio-economic background of respondents.
Making decisions about higher education: Does it feel right?
Within higher education decision-making, prospective students, whatever their
background, deal with varying degrees of uncertainty as neither the costs nor the benefits of various options can be entirely known, and depend on many factors outside the
individual’s control. This often means that satisfying one requirement (studying at a particular university because of its reputation, or geographic location for example) can bring other issues into focus (such as the expense of moving away from home or the debts incurred).
across personal support networks. The young people we spoke to were often more likely to give information provided by ‘someone who knows them’ or their own information searches more authority than more formal sources of support from ‘someone who knows’. Where personal support networks lack cultural capital, then decisions can be made on misinformation, or a lack of understanding about the benefits of taking part in higher
education. Helping young people and their support networks to understand what is needed in order to make an informed decision about whether to participate in higher education would seem to be a critical issue.
Conclusion
The findings in this report offer some challenges for policymakers seeking to identify interventions to help support young people to progress in their chosen pathways. The intersectionality of factors means that it is impossible to determine the extent and relative influence of the range of factors affecting a young person at a given point in time with any certainty. As it is unlikely that lack of progression can be attributed to a single barrier (beyond lack of attainment) it is not possible to develop a corresponding intervention to address it. Therefore, potential interventions which look to widen access to higher education are likely to be most effective if developed within a coherent framework or programme. Such a programme would look to incorporate interventions that have both ‘push and pull’ features, addressing barriers while simultaneously promoting the benefits for different groups of individuals. This can be achieved by:
• Understanding that different young people will have different requirements at different times in their lives and that support should be tailored accordingly.
• Raising awareness of the financial and non-financial benefits of higher education and the opportunities available to people with higher level qualifications amongst young people and their support networks particularly during the transition from Key Stage 3 to Key Stage 4.
• Supporting young people to access and make effective use of information, advice and guidance in order for them and their families to build a relevant choice
architecture for their career and education preferences.
• Empowering young people and equipping them with the skills to make their own decisions, acknowledging that participation in higher education may not be the right pathway for everyone.
• Recognising that interventions will be required across the entire student lifecycle, from an early age right through to the point at which decisions about higher education participation are made. Strategies will necessarily cross government departmental boundaries, with higher education institutions playing a vital role
While further research is needed to evaluate specific approaches for widening
Age and stage appropriate interventions
Young people’s interests, attitudes, motivations and aspirations start to form at a relatively young age and these along with the views of their parents have an impact on whether or not an individual eventually applies to university. Whilst disadvantaged White individuals do not have the lowest attainment levels at Key Stage 2, by Year 9, they are far more likely than any other ethnic group to be aspiring towards leaving full-time education and finding an apprenticeship or full-time job. Interventions which engage young people, and
particularly White disadvantaged boys during early stages in their lives, could help to break down the negative norms associated with higher education and provide the conditions needed to normalise participation. Alongside this, better quality information from a young age on the types of jobs available in today’s labour market, as well as the qualifications required for such positions, may be needed to support progression into higher education amongst under-represented groups.
Outreach by higher education institutions at all school ages
Ensuring that higher education institutions play a stronger role earlier in the decision making process and establish a pervasive and positive presence in local communities, particularly in areas of disadvantage, is key. For those young people and their parents who have had very limited or no contact with higher education, the impact of these activities has the potential to be transformative and challenge entrenched family views and perceptions that higher education is not for ‘people like them’.
Changing the status quo
The more habitual a behavioural pattern is, the less likely a young person is to weigh up the costs and benefits of alternatives in a rational way. For potential higher education students from non-traditional backgrounds, non-participation is potentially more likely to be taken as the default position and many of the young people in our study who did not attend higher education describe their educational choices as going with the flow. Many young people describe their decision not to attend university in terms of being unsure about what they want to do and the longer term benefits of a higher education. Making a commitment to a long-term goal or activity can therefore be powerful in helping young people from non-traditional backgrounds plan and come to terms with career and educational choices that may differ from their immediate support networks or personal experiences.
Framing participation in higher education
1 Introduction
This report presents the findings from a study commissioned by the Department for Business, Innovation and Skills and carried out by CFE Research and its Associates with support from the Avon Longitudinal Study of Parents and Children (also known as the ‘Children of the 90s’ study), University of Bristol. The research was undertaken between March 2014 and January 2015 and explores the reasons, beyond educational attainment, for differential rates of participation in higher education by gender and ethnicity, particularly among lower socio-economic groups.
1.1
Project Background
Following the expansion of the UK higher education system, the Robbins report
established the principle that “courses of higher education should be available for all those who are qualified by ability and attainment to pursue them and who wish to do so.” 2
Subsequent governments have sought to implement Robbins’ vision through reforms to UK higher education, including most recently lifting the cap on student numbers and a new system for student finance.3 The number of young people overall entering higher
education has been steadily increasing; however, some groups have been and continue to be under-represented. Widening as well as increasing access to higher education remains a critical issue, particularly in the context of government policy priorities around social justice and social mobility.
Economic theory highlights social mobility as being vital to the growth prospects of an economy. Economic growth is boosted when individuals are able to work in those industries where they are most productive.4 Low levels of mobility can inhibit growth through a misallocation of human resources, that is where individuals are not able to access the opportunities and jobs that would make best use of their skills and abilities. Conversely, high levels of mobility can enable those with the most promise to become entrepreneurs, resulting in faster technological progress, and consequently, stronger levels of growth. Additionally, in instances where individuals believe there is minimal chance of them entering certain career paths, there is likely to be an adverse impact on labour supply, as motivation and effort levels fall. The knock-on effect of this is reduced productivity amongst workers. Higher education can play a key role in improving social mobility. Over recent decades, the UK economy has become increasingly service based, with a growing number of jobs in the service industries requiring higher level qualifications. Hence, attending university can enable those from less affluent backgrounds to enter the professions that make best use of their skills and talents. Furthermore, there appears to be a rising number of graduates today who begin their own businesses5, with such
2
The Robbins Report. (1963). Higher Education: Report of the Committee appointed by the Prime Minister under the Chairmanship of Lord Robbins. London: Her Majesty's Stationery Office, p8
http://www.educationengland.org.uk/documents/robbins/robbins1963.html
3
BIS (2015). Grant letter to HEFCE. http://www.hefce.ac.uk/media/hefce/content/news/news/2015/Higher Education Funding Letter 2015-16.pdf
4
Murphy K, Scheifer A & Vishny R. (1991). The Allocation of Talent: Implications for Growth. Quarterly Journal of Economics, Volume 106(2): 503-530
5
http://www.independent.co.uk/student/career-planning/getting-job/the-rise-of-the-graduate-entrepreneur-8598949.html
entrepreneurial activity likely to have a positive impact on economic growth and job creation. The Government’s current strategy, Improving social mobility to create a fairer society,6 aims to “make it easier for young people to successfully move from school to work” by:
• improving the quality of further education and skills training;
• reforming qualifications and the curriculum to better prepare pupils for life after school;
• increasing opportunities for young people and helping them to achieve their potential; and
• making the higher education system more efficient and diverse.
In order to address under-representation and support the diversification of higher education, the Government has allocated funding for institutions to help meet the additional costs associated with recruiting and retaining students from disadvantaged groups through the Student Opportunity Fund and previous initiatives, such as Aimhigher and the National Scholarship Programme, which have delivered direct benefits to students. In addition, institutions are now required to utilise a proportion of their fee income to
enhance access and improve retention and success. Although these initiatives appear to be having a positive impact as the participation gaps between the most and least
advantaged groups are narrowing, access to higher education remains inequitable and some groups continue to be under-represented, particularly in high-tariff institutions and in certain subject disciplines.7
1.2
Research Aims and Objectives
Prior attainment has already been identified as a key determinant of whether or not an individual will progress into higher education, however this cannot explain all the differences that exist by key characteristics, such as ethnicity and disadvantage. This research adds to existing evidence by investigating what other factors might determine higher education progression, aside from attainment, with particular attention paid to the aspirations, attitudes and behaviours displayed by young people and their parents. The objectives of this research are to:
• identify gaps in current understanding of the reasons why some groups are less likely to progress into higher education than others;
• establish the key points in a young person’s life when their learning and career aspirations are shaped and the factors that influence this process at each stage;
• explore the individual factors, including hidden influences and motivations that determine the likelihood that an individual will successfully progress into higher education; and
6
See https://www.gov.uk/government/policies/improving-social-mobility-to-create-a-fairer-society
7
Milburn, A. (2012). University Challenge: How Higher Education Can Advance Social Mobility, pp 1-2. https://www.gov.uk/government/publications/independent-reviewer-s-report-on-higher-education
• explore barriers that inhibit and enablers that facilitate progression into higher education in order to identify issues for consideration in the development of strategies for
addressing under-representation by certain groups of individuals.
1.3
Methodology
The method employed for this study used secondary data analysis of national and regional longitudinal datasets with primary in-depth qualitative research. The research was
undertaken in three inter-related stages as set out below.
1.3.1 Review of existing literature
The research team completed two inter-related literature reviews as part of this project. The first examined personal, dispositional and situational factors impacting on participation in higher education; the second specifically took account of factors that influence gender participation. The reviews draw on material from a range of sources including published academic and applied research, policy documentation and unpublished/grey literature. The literature was gathered using a hierarchical set of search terms (see Appendix 1) which returned more than 300 individual sources. These were then subject to a process of summary and review, with sources classified by subject, and ranked by relevance and methodological quality. The purpose of the analysis was to identify any gaps or potential ambiguities in the existing evidence and to inform our approach to the quantitative data analysis. The literature review also informed the primary research by helping to refine the research instruments and the topics for investigation. We draw on this evidence from both the gender and wider literature review throughout the report in order to contextualise the findings. Appendix 2 provides an overview of the key findings from the gender specific literature review. This should be read with the main report in mind.
1.3.2 Secondary data analysis
Longitudinal Study of Young People in England
The Longitudinal Study of Young People in England, which began in 2004, followed a sample of young people born between September 1989 and August 1990. Young people in England were asked to complete a questionnaire annually up until 2010, resulting in a panel dataset consisting of seven ‘waves’. Parents were also interviewed as part of the study; however data was collected from them in the first four waves only.
The Longitudinal Study of Young People in England dataset was utilised to produce
summary statistics and cross-tabulations that highlighted the differences in aspirations and attitudes which existed by gender and ethnicity amongst disadvantaged groups of young people and their parents. An econometric model was then developed to ascertain the role of aspirations and attitudes in decisions about higher education, when other variables known to have an impact were controlled for.
Avon Longitudinal Study of Parents and Children
that could be used to investigate influences on health, development and wellbeing.8 The study families were recruited during the pregnancy of the index child in the early 1990s. The variables relating to aspirations and attitudes in the databank are similar to those contained within the Longitudinal Study of Young People in England. The data were
analysed to identify whether patterns emerging from the analysis of the Longitudinal Study of Young People in England were evident in the Avon9 region specifically.
A more detailed description of our approach to analysing these datasets is presented in Chapters 3 and 4. More information about the Avon Longitudinal Survey of Parents and Children, its history and use, can be found in Appendix 3.
1.3.3 Primary Qualitative Research
This project was primarily designed to explore the reasons for differential rates of
participation between different groups of young people and in particular to understand how different factors intersect to influence the likelihood of a young person progressing to higher education. The fieldwork comprised in-depth one-to-one interviews with young people and focus groups with parents to explore:
• the key points in a young person’s life when their learning and career aspirations are shaped and the factors that influence this process at each stage;
• the individual factors, including hidden influences and motivations, that determine the likelihood that an individual will successfully progress into higher education;
• the barriers that inhibit and the enablers that can facilitate successful progression to higher education in order to identify issues for consideration in the development of strategies for addressing under-representation by certain groups of individuals.
The Avon Longitudinal Study of Parents and Children provided the sample frame for the primary qualitative work which comprised young people aged 22 to 23 with a minimum of 5 GCSEs (or equivalent) at grades A*-C and their parents living in households located in the most deprived neighbourhoods10 in Avon. It is acknowledged that the characteristics of the panel members are not necessarily representative of the population as a whole - typically the Avon area is less ethnically diverse and exhibits lower levels of deprivation than England as a whole. To counter these issues recruitment was stratified and participants were only selected from those living in the third most deprived English neighbourhoods, rather than the third most deprived in the Avon area. Utilising the panel for the qualitative as well as the quantitative aspects of the project provided a unique opportunity to identify
8
Boyd, A, et al. (2012) Cohort profile: the ‘Children of the 90s’—the index offspring of the Avon Longitudinal Study of Parents and Children. International journal of epidemiology: dys064.
9
Throughout this report we use the term ‘Avon’ as shorthand for the areas of the four counties (Bath & North East Somerset, the City of Bristol, North Somerset and South Gloucestershire) which used to comprise the County of Avon.
10
Neighbourhoods were classified as ‘deprived’ if they were in the most deprived third of UK neighbourhoods as indicated by the Index of Multiple Deprivation 2007 (IMD). Neighbourhood IMD score was linked to participants household using their ALSPAC held residential postcode on the 1st September of the ‘Year 9’ (age 12/13) academic year and 1st June of the ‘Year 11’.
which factors are influencing decisions about higher education and explore the reasons why.
Depth Interviews with Young People
Participants were recruited by Children of the 90s using a postal and telephone campaign and gave their full and informed consent to take part11. The majority of interviews were conducted at the Avon Longitudinal Study of Parents and Children study centre and lasted approximately 45 minutes. In total, 43 depth interviews were conducted. Figure 1
describes the breakdown of these interviews by:
• Those that participated in higher education, by male and female, and White and Black or Minority Ethnic respondents.
• Those that did not participate in higher education by male and female and White and Black or Minority Ethnic respondents.
Figure 1: Breakdown of interviews conducted
Focus Groups with Parents
The participants were recruited in the same way as the young people and gave their full and informed consent to take part. The group discussions also took place at the Avon
11
Both the in-depth interviews and focus groups were recorded onto an encrypted device and transcribed by a University of Bristol vetted transcription company whose employment contract included confidentiality commitments. Young people taking part in depth interviews and parents taking part in focus groups received £10 in compensation for the time spent providing data and travel costs were reimbursed.
Longitudinal Study of Parents and Children study centre and lasted 90 minutes. The groups comprised a total of 16 participants (all white, 12 female and four male). The participants had a mix of higher education and non-higher education experience, and had children with a mix of experience as well. Participants were encouraged to explore their own experiences of higher education, their attitudes towards higher education, including the importance they attach to higher level study, and their aspirations for their children.
1.4
Structure of this Report
Following this introduction, Chapter 2 presents an overview of current trends in higher education participation, comparing participation rates overall by socio-economic status, gender and ethnicity. The remainder of the report looks to build an understanding of why there might be differences in participation within these groups, beyond educational attainment. Chapters 3 and 4 present analysis of secondary data from the Longitudinal Study of Young People in England and the Avon Longitudinal Study of Parents and Children. These chapters illustrate the variations in attitudes and aspirations that exist by gender, ethnicity and socioeconomic status, with Chapter 3 also presenting an
econometric model highlighting the impact of aspirations and attitudes towards education on university application decisions, once we control for other key determinants. Chapters 5-7 outline the main findings from the in-depth qualitative study of young people and parents in the Avon area. Chapter 5 concentrates on how decision-making regarding participation in higher education takes place and specifically identifying key points in young people’s lives and how these key moments manifest themselves. Chapter 6 looks to
2 Trends in Higher Education
Participation
This chapter draws on existing research and national data on higher education participation rates in order to identify trends in participation by socioeconomic status, gender and ethnicity. The wider literature on the specific factors that have been shown to influence progression to higher education is referenced throughout the remainder of the report in order to contextualise the findings from the primary research and secondary analysis undertaken as part of this project.
2.1
Current Patterns of Participation and Progression
The official measure of participation of English students is the Higher Education Initial Participation Rate.12 The measure is an estimate of the actual entry rate in the current year of people who had not previously entered higher education at each age from 17 to 30, based on the current entry rate of previous non-entrants. Overall participation in higher education has been steadily increasing since the 1990s reaching a peak of 49.5 per cent in 2011/12. The latest provisional estimate of the Higher Education Initial Participation Rate for 2012/2013 is 43 per cent, a 6.5 percentage point drop from the previous year and the lowest level since 2006/7 (Figure 2 overleaf). Higher level fees were introduced in 2012/13 and the drop in the initial participation rate is largely explained by a higher
proportion of applicants in 2011/12 choosing to progress immediately into higher education rather than deferring entry and thus avoiding the higher level fees.13 Deferral rates have since returned to more typical levels and the latest data from UCAS indicates that the HEIPR figure is likely to show an increase in the next 2013/14 data.
The UCAS data shows that application rates for 18 year-olds have increased, reaching a record high of 35 per cent for the 2013/14 academic year (from 23.9% in 2012/13).14 Participation amongst disadvantaged groups has grown in line with this overall increase and the gap between the most and least advantaged has narrowed. However, the likelihood that a young person will participate in higher education continues to vary significantly between these groups.
This report is commissioned to explore the reasons for the differential rates of participation between different socioeconomic and ethnic groups as well as between men and women. The following sections in this chapter, therefore, examine higher education participation rates by socioeconomic status, gender and ethnicity.
12
The statistic covers English domiciled first-time entrants to UK Higher Education Institutions and English, Welsh and Scottish Further Education Colleges who remain in higher education for at least six months
13
BIS (2014). Participation Rates in Higher Education: Academic Years 2006/2006 – 2012/2013 (Provisional).
14
UCAS (2015). January Deadline Analysis: Sex and age. https://www.ucas.com/corporate/news-and-key-documents/news/2015-cycle-applicant-figures-january-deadline-2015
Figure 2: Participation rates (per cent, HEIPR). [Data source: BIS, 201415]
2.2
Socioeconomic Status
Socioeconomic status indicates an individual’s position within a social structure defined in terms of access to resources including money, materials, power, social networks, free time and educational opportunities. As such, categories of socioeconomic status are often based on measures of income, professional status, education and deprivation. A range of measures of socioeconomic status are commonly used based on, for example, household income16 or free school meal status17 and although there are subtle differences in the way in which terms such as socioeconomic status, social class and disadvantage are defined, they are often used interchangeably. However, whatever measure of socioeconomic status is used, the evidence demonstrates that those in lower socioeconomic groups exhibit lower demand and progression rates into higher education.
Anders (2012)18 finds that a far greater proportion of individuals in the top income quintile (66%) apply to university compared to young people in the bottom quintile (24%). Similarly, although the eligibility criteria for free school meals has evolved over time, large
differences in participation rates by free school meal status have been consistently
observed, with the gap remaining steady between 2005 and 2012 at just less than twenty percentage points. Other studies that have explored the determinants of higher education participation associated with socioeconomic status have shown that home ownership and higher levels of parental education have a positive impact on the probability of a young person applying to university, even after controlling for income and social class.19
BIS research on higher education participation at age 18 or 19 finds that participation has risen more rapidly amongst those from more deprived backgrounds. This has resulted in participation differences amongst the highest and lowest socioeconomic groups falling by
15
BIS (2014). Participation Rates in Higher Education: Academic Years 2006/2006 – 2012/2013 (Provisional). https://www.gov.uk/government/uploads/system/uploads/attachment_data/file/347864/HEIPR_PUBLICATION_2012-13.pdf
16
Department for Business, Innovation and Skills (2010). Full-time young participation by socioeconomic class.
17
Department for Business, Innovation and Skills. (2014). Widening participation in higher education.
18
Anders. (2012). What’s the link between household income and going to university? Department of Quantitative Social Science, Institute of Education, London.
19
Oliveira T & Zanchi L (2004). Participation in higher education in Britain: The effect of ability and parental income.
42.5 43.6 45.6 46.2 46.3 49.5 43.0
0% 10% 20% 30% 40% 50%
2006/07 2007/08 2008/09 2009/10 2010/11 2011/12 2012/13
around 2 percentages between the 2003 and 2008 GCSE cohorts. However, substantial differences in higher education participation between socioeconomic groups remain. Pupils from the highest socioeconomic quintile group are around 40 percentage points more likely to go to university than those in the lowest socioeconomic quintile group. Furthermore, young people from the highest socioeconomic quintile group are around 7 times more likely to go to a high status institution than those from the lowest socio-economic quintile group. 20
We return to the debate about effective measures of socioeconomic status in Chapter 3 where we define the measure used within our analysis of the Longitudinal Study of Young People in England and the rational for our approach.
2.3
Gender
The proportion of women entering higher education has gradually increased since the late 1970s, with a particularly dramatic rise in the late 1980s. In 1992, the female rate of
participation in higher education rose above the male rate for the first time, and, it has continued to rise to the present day.21 Figure 3 illustrates recent trends in the male and female Higher Education Initial Participation Rate from 2006/07 to 2012/13. The gap in 2012/13 stood at almost 9 percentage points.22 Appendix 2 outlines additional analysis of gender specific literature and higher education participation. This appendix looks at the differences in men and women’s participation trends and provides a review of some of the key factors which have the potential to influence participation.
20
BIS (2015). Socio-economic, ethnic and gender differences in HE participation.
21
Broecke, S. & Hamed, J. (2008). Gender Gaps in Higher Education Participation: An Analysis of the Relationship between Prior Attainment and Young Participation by Gender, Socio-Economic Class and Ethnicity. London: Department for Innovation, Universities and Skills. http://dera.ioe.ac.uk/8717/1/DIUS-RR-08-14.pdf
22
BIS (2014). Participation Rates in Higher Education: Academic Years 2006/2006 – 2012/2013 (Provisional). https://www.gov.uk/government/uploads/system/uploads/attachment_data/file/347864/HEIPR_PUBLICATION_2012-13.pdf
Figure 3: Male and female participation in HE, 2006/07–2012/13 (per cent, HEIPR (new methodology)). [Data source: BIS, 2014]
2.4
Ethnicity
There has been a significant amount of research into the effects of ethnicity on university access and a highly complex pattern emerges. The proportion of Black and Minority Ethnic students participating in higher education gradually increased between 1996 and 2006. Ethnic minorities represented 11 per cent of young higher education entrants in the academic year 1996/97, and this proportion had risen to 18 per cent by 2005/06.23
Furthermore, a series of studies of admissions data since the early 2000s demonstrated that Black and Minority Ethnic groups are over-represented in higher education.24 Despite high levels of participation amongst Black and Minority Ethnic Groups overall, Thomas and Berry report that this headline figure “masks a picture of differential rates of access and routes of entry into higher education by sub-group, variations in profile and very uneven patterns of distribution by subject, location and type of higher education institution”.25
According to UCAS, the entry rates of Asian and, in particular, Chinese students are considerably higher than other groups. Participation among the Black ethnic group rose from 17 per cent in 2006 to 30 per cent in 2013 and moved marginally above the White British population for the first time in 2010.26 Figure 4 shows higher education participation at age 18 or 19 by ethnic group compared to White British pupils.27 The figure highlights
23
HEFCE (2010). Student Ethnicity: Profile and Progression of Entrants to Full-Time First Degree Study. Bristol: HEFCE. p8 http://www.hefce.ac.uk/pubs/year/2010/201013/
24
Connor, H. et al. (2004). Why the Difference? A Closer Look at Higher Education Minority Ethnic Students and Graduates. London: Department for Education and Skills.
http://www.bristol.ac.uk/media-library/sites/ethnicity/migrated/documents/educationreport.pdf: UCAS (2013). 2013 Application Cycle: End of Cycle Report. Cheltenham: UCAS. http://www.ucas.com/sites/default/files/ucas-2013-end-of-cycle-report.pdf
25
Thomas, L. & Berry, J. (2010). Understanding Widening Participation, p14 in: Weekes-Bernard. (ed.) Widening Participation and Race Equality. London: The Runnymede Trust.
26
UCAS (2013). 2013 Application Cycle: End of Cycle Report. Cheltenham: UCAS. http://www.ucas.com/sites/default/files/ucas-2013-end-of-cycle-report.pdf
27
BIS (2015). Socio-economic, ethnic and gender differences in HE participation.
47.2 48.4 50.5 51.1 50.8
54.1
47.4
37.8 38.9 40.7 41.4 41.9
45
38.6
0 10 20 30 40 50 60
2006/07 2007/08 2008/09 2009/10 2010/11 2011/12 2012/13
%
Female Male
for example, that in 2003 there were 1.6% fewer Black Caribbean students in higher education relative to White British Students and in 2008 there were 8.6% more.28 This trend is particularly striking given that a number of studies have indicated that ethnic minority candidates are less likely to receive an offer from elite institutions than equally qualified White candidates29 (although it should be noted that the extent of this and the reasons behind it remain very much a matter of debate among higher education
[image:27.595.62.504.269.617.2]researchers).30
Figure 4 Difference in HE participation at age 18 or 19 relative to White British pupils amongst the cohorts taking their GCSEs 2003 to 2008, by ethnic group [BIS, 2015]
-5 0 5 10 15 20 25 30 35 40 45 50
Other
White AfricanBlack CaribbeanBlack Other Black Indian Pakistani Bangladeshi Chinese Other Asian Mixed Other
Per
cen
ta
ge p
oi
nt
s
2003 2008
28
It should be noted that ethnic groups are still in the minority overall, these figures are relative to the group they are in. Minority ethnic groups make up around a fifth to a quarter of the student population.
29
See for example : Shiner, M., & Modood, T. (2002). ‘Help or Hindrance? Higher Education and the Route to Ethnic Equality’, British Journal of Sociology of Education 23, no. 2: 209–32; Boliver, V. (2013). ‘How Fair Is Access to More Prestigious UK Universities?’, The British Journal of Sociology 64, no. 2: 344–64; Parel, K., & Boliver, P. (2014). ‘Ethnicity Trumps School Background as a Predictor of Admission to Elite UK Universities’, Economics of Higher Education. http://economicsofhe.org/2014/05/09/ethnicity-trumps-school-background-as-a-predictor-of-admission-to-elite-uk-universities; Noden, P., Shiner, M., & Modood T. (2014). ‘University Offer Rates for Candidates from Different Ethnic Categories’, Oxford Review of Education: 1–21.
30
2.5
Intersection between socioeconomic status, gender and ethnicity
2.5.1 Gender and socioeconomic status
The socioeconomic gap in participation interacts with the gender gap in participation.31 Although the absolute participation gap between disadvantaged males and females
(6ppts) is lower than the overall participation gap between males and females (8ppts), the gender gap is proportionally larger for disadvantaged students. In general, females are 22 per cent more likely to enter higher education than males, however amongst the most disadvantaged socioeconomic groups, women are 35 per cent more likely than men to participate in higher education.32
2.5.2 Ethnicity and socioeconomic status
Within every major ethnic group, students from lower socioeconomic groups, defined in terms of those in receipt of free school meals, have considerably lower entry rates than those from more advantaged groups. However, the differences in entry rates between the non-free school meal and free school meal groups vary substantially between ethnic
groups. According to UCAS, White non-free school meal pupils are 3.4 times more likely to enter higher education than White free school meal pupils. This compares with a rate of 1.6 for Asian pupils and 1.5 for Black groups.33 BIS research finds the socioeconomic gradient is steepest for White British people; those in the highest socioeconomic status group are 42 percentage points more likely to go to university than those in the lowest socioeconomic status group.34 Furthermore, participation amongst the lowest
socioeconomic group of White British people is more than 10 percentage points lower than any other ethnic group.
2.5.3 Ethnicity and Gender
For all ethnic groups, participation of females is greater than that of males but the size of the gap varies. BIS research shows that participation overall has continued to increase amongst ethnic groups in recent years.35 Specifically:
• Ethnic groups with the highest participation are Indian and Chinese advantaged females;
• Lowest participation is among White disadvantaged males
31
Since 2005, the Participation of Local Areas (POLAR) measure has been used to classify UK geographical areas into quintiles (Q), with the lowest HE participation rates in Q1 and the highest rates in Q5 (HEFCE, 2012). The Higher Education Funding Council for England (HEFCE) publishes POLAR data as a series of data sets and maps at national and local levels. The most recent version of this measure, POLAR3, is based on the participation rates of cohorts of people who were aged 18 between 2005 and 2009 and who entered HE between 2005/06 and 2010/11. This version also extends the scope of the classification to include part-time study and other factors. A new version of this classification is currently in development, known as IPOLAR, which is based on individualised POLAR data, and which combines data from 5 cohorts of 18 year-olds from 2006-07 to 2010-11.
32
HEFCE (2013). Trends in young participation in higher education. Bristol: HEFCE, pp 12-13 http://www.hefce.ac.uk/pubs/year/2013/201328/
33
UCAS (2013). 2013 Application Cycle: End of Cycle Report. Cheltenham: UCAS. http://www.ucas.com/sites/default/files/ucas-2013-end-of-cycle-report.pdf
34
BIS (2015). Socio-economic, ethnic and gender differences in HE participation.
35
Ibid
• The greatest difference between males and females is amongst the advantaged Other Black and Bangladeshi groups.
[image:29.595.72.537.274.422.2]Analysis of HESA data on full-time first-year students in 2012/13 provides similar results, but also allows us to quantify the gender gaps within ethnic groups (Figure 5). The only ethnic group with a negative gap (that is, more males than females) is ‘Other Asian’. The largest gap is amongst ‘Black/Black British Caribbean’ students, where nearly twice as many females (63.5%) participate in higher education than males (36.5%), resulting in a gender gap of 27 percentage points.
Figure 5: UK domiciled first-year full-time HE students by ethnicity and sex (percentage point gap between sexes = female - male). [Data from: HESA, 2013]36
12.9
27.0
11.9
23.5
3.2 1.8 2.4 0.9
-1.2 10.9 -5 0 5 10 15 20 25 30
White Black or Black British -Caribbean Black or Black British -African Other Black background Asian or Asian British -Indian Asian or Asian British -Pakistani Asian or Asian British -Bangladeshi Chinese Other Asian background Other (including mixed) Ga p i n p ar tici pa tio n (pe rc ent ag e po int s)
2.5.4 Gender, socioeconomic status and ethnicity
BIS research examines the gender gap by socioeconomic status and ethnicity, in order to explore how these three factors interact.37 The analysis reveals that in the highest
socioeconomic groups, females from all ethnic minority groups are more likely to
participate in higher education, on average, than White British females. Similarly, in the lowest socioeconomic groups, both male and female ethnic minorities have significantly higher participation rates than their White British counterparts, and the differences are larger for girls in all cases. Black Caribbean, Other Black, and Bangladeshi male students from the highest socioeconomic status group have lower participation rates, on average, than White British male students from similar socioeconomic backgrounds. In addition, the growth in participation rates of ethnic minorities compared with White British people is generally stronger within the lower socioeconomic groups. Overall, the lowest participation across all ethnic groups, when taking into account gender and socioeconomic status, is for White British males in the lowest socioeconomic status group at 10.5 per cent.
2.6
Factors affecting Progression to Higher Education
Evidence suggests that access to higher education is principally determined on the basis of ability, which is signified by attainment of qualifications. Because prior attainment of
36
HESA (2013a). UK domiciled HE students by level of study, sex, mode of study, first year identifier and ethnicity 2012/13. http://www.hesa.ac.uk/dox/dataTables/studentsAndQualifiers/download/Ethnic1213.xlsx
37
qualifications is the main entry requirement of most higher education institutions, this accounts for most of the difference in participation rates of different groups. But when prior attainment is controlled for, significant gaps remain between groups, particularly in terms of ethnicity and socioeconomic status.38 Recent research39 shows that, for example, after accounting for prior attainment gender differences are not observed (again see Appendix 2 for more information on differences in participation between men and women).
Quantitative literature on the factors that determine higher education participation are rather limited. One of the earliest studies to be conducted in this area was by Gayle et al (2002), who investigated whether determinants such as social class, gender and ethnicity influenced an individual’s decision to participate in higher education.40 The authors utilised the Youth Cohort Study, which is a longitudinal survey of young people aged 16 to 19. In particular, they focus on the cohort that were born in either 1969 or 1970, with their
dependent variable being whether or not the person was studying for a degree at the age of 18 or 19. By developing a logistic regression model and using sample enumeration as a means of interpreting the results, the researchers found that gender, ethnicity and social class were all factors that impacted on the decision of going to university, even after attainment had been controlled for. However, the Youth Cohort Study only tracks
individuals from the age of 16, whereas decisions regarding higher education may begin to be formed at a younger age, which cannot be investigated using such a dataset.
More recently, Chowdry et al. (2010) examined the determinants of university participation using individual-level administrative data for pupils who sat their GCSEs in 2001-02 and 2002-03.41 They created a measure of socioeconomic status that considers both pupil and neighbourhood characteristics, such as free school meal eligibility and index of multiple deprivation score. One limitation of administrative data is the lack of detailed information on socioeconomic background at the individual level. However, checks on the validity of their measure against available data in the Longitudinal Study of Young People in England suggest that they have generated an appropriate indicator. The authors construct linear probability models in which the dependent variable is whether an individual attends university at the age of 19 or 20. They find that gaps in higher education participation by socioeconomic status fall quite markedly once prior attainment is accounted for, with performance at Key Stage 4 appearing to be particularly important.
The remainder of this report looks to understand what factors play a role in substantiating these gaps. Where possible, the report outlines barriers (and enablers) for entry into higher education, through an assessment of the socioeconomic status of participants in the qualitative study, and through analysis of the Longitudinal Survey of Young People in England and the Avon Longitudinal Study of Parents and Children. The following chapters discuss these findings.
38
Chowdry, H., Crawford, C., Dearden, L., Goodman, A. and Vignoles, A. (2008), Understanding the determinants of participation in higher education and the quality of institute attended: analysis using administrative data, London: Institute for Fiscal Studies, p6.
39
BIS (2015). Socio-economic, ethnic and gender differences in HE participation.
40
Gayle V., Berridge D., & Davies R. B. (2002). Young People’s Entry in Higher Education: Quantifying Influential Factors. Oxford Review of Education, Volume 28, No 1, pp 5-20
41
Chowdry, H., Crawford, C., Dearden, L., Goodman, A., & Vignoles, A. (2010). Widening Participation in Higher Education: Analysis using Linked Administrative Data. IFS Working Paper W10/04, London
3 Analysis of the Longitudinal
Study of Young People in England
This chapter highlights findings from our analysis of the Longitudinal Study of Young
People in England dataset. We begin with a brief introduction to the study and how utilising this dataset adds to existing evidence. Prior to discussing the results of our analysis, we set out our chosen measure of disadvantage and seek to validate the suitability of this variable.
3.1
The Longitudinal Study of Young People in England
Existing analysis demonstrates that prior attainment is the major factor in explaining the differences in higher education participation by key demographic characteristics; however, there are other influences that are likely to also impact on this choice. To date, very little research has been conducted on these other determinants of participation. It is this gap in the evidence base that we seek to address by analysing the Longitudinal Study of Young People in England.
The focus of the analysis in this research is the university participation choices made by those from less affluent backgrounds. Whilst administrative data fails to provide much data on an individual’s socioeconomic background, the Longitudinal Study of Young People in England is an especially rich source of information, supplying a wide range of indicators regarding an individual’s socioeconomic status, therefore enabling a more nuanced definition of disadvantage to be created. This will be discussed in more depth later in this chapter. Furthermore, all young people who took part in this study consented for their responses to be linked to National Pupil Database records, which contain each pupil’s attainment level from Key Stage 2 to Key Stage 5, as well as the characteristics of their school.
The study, which ran between 2004 and 2010, interviewed young people between the ages of 13 and 20, with a number of questions in the surveys aiming to explore attitudes towards education, subject choices and future aspirations. Parents were also asked about their attitudes towards education, as well as their future expectations for the child. These additional variables allow us to examine whether, alongside attainment and demographic characteristics, attitudes and aspirations play any significant role in higher education decisions. Hence, the Longitudinal Study of Young People in England enables us to carry out quantitative analysis that will add to the existing literature in the area. Before we go on to discuss our measure of disadvantage, Table 1, outlines the age and school year a particular wave of the study corresponds to.42
42
Please note that in this table we are assuming a pupil continues directly into further and higher education, without taking any gap years.
Table 1: Background information on each wave of the Longitudinal Study of Young People in England
Wave Age of pupil Academic year Are parents surveyed?
1 13-14 Year 9 Yes
2 14-15 Year 10 Yes
3 15-16 Year 11 Yes
4 16-17 Year 12 Yes
5 17-18 Year 13 No
6 18-19 1st year HE No
7 19-20 2nd year HE No
3.2
Our Measure of Disadvantage
Frequently, in reported statistics about higher education participation, the eligibility of a pupil for free school meals is used to distinguish between advantaged and less
advantaged pupils. However, research by Kounali et al. (2008) highlights that using free school meal status as an indicator of disadvantage can lead to a significant proportion of families with minimal economic capital being classified as advantaged.43 Additionally, not all families who can claim free school meals will do so and as such will be missed in this measure. Family income potentially represents an alternative measure of disadvantage. Household income data is collected between waves 1 and 4 in the Longitudinal Study of Young People in England, but in the majority of waves, the income measure is banded as opposed to being a continuous variable. In order to calculate the average income for a household across the waves, assumptions and/or econometric analysis must be used to transform banded data for households into a more precise income value. For instance, Anders (2012) utilises interval regression to do this. When he assesses the accuracy of income reporting from households in the Longitudinal Study of Young People in England by comparing the figures to similar data in the Family Resources Survey, he finds
evidence of under-reporting of income within this dataset. Given the limitations of income and free school meal eligibility, we have decided against using these as potential
measures of disadvantage.
43
Kounali D, Robinson T, Goldstein H & Lauder H (2008). The probity of free school meals as a proxy measure for disadvantage. Education Department, University of Bath
Our measure of disadvantage combines data on parental occupation and education (see Appendix 4 for further detail). A young person is deemed to be from a disadvantaged background if they meet both of the following criteria;
a) Their main parent was employed in a semi-routine/routine occupation or had never worked/was long-term unemployed at wave 1 of the study.
b) Thei
![Figure 2: Participation rates (per cent, HEIPR). [Data source: BIS, 201415]](https://thumb-us.123doks.com/thumbv2/123dok_us/161899.39043/24.595.64.518.113.283/figure-participation-rates-cent-heipr-data-source-bis.webp)

![Figure 4 Difference in HE participation at age 18 or 19 relative to White British pupils amongst the cohorts taking their GCSEs 2003 to 2008, by ethnic group [BIS, 2015]](https://thumb-us.123doks.com/thumbv2/123dok_us/161899.39043/27.595.62.504.269.617/figure-difference-participation-relative-white-british-pupils-cohorts.webp)