Educational Psychology
Workforce Survey 2013
Research report
April 2014
Contents
List of figures 4
List of tables 4
1 Summary 5
Workforce demographics 5
Recruitment 5
Commissioning and Funding 5
Service delivery 6
Service demand 6
2 Introduction 8
2.1 Aims of the survey 8
2.2 Methodology 8
3 Current local authority educational psychology workforce 11
3.1 Qualified educational psychologists 11
3.2 Trainee educational psychologists 13
3.3 Recruitment 14
4 Current Commissioning and Funding of Educational Psychology Services 16 4.1 Commissioning of educational psychology services 16
4.2 Funding of Educational Psychology Services 17
4.3 Commissioning and funding of educational psychology services in the next 12
months 19
4.4 Non-local authority educational psychology services 20
5 Service Delivery 21
5.1 Service/settings 21
Social care: 21
Schools / settings: 21
5.2 Other practitioner psychologists 23
6 Service Demand 24
6.1 Demand for services 24
6.2 Plans to meet increased demand for services 25
Increasing number of non-core staff 25
Income generation schemes 26
Increasing number of permanent staff 26
Reviewing service delivery models / patterns of deployment 26
6.3 The future 27
List of figures
Figure 1: Breakdown of qualified educational psychologists by age group 13 Figure 2: How are your educational psychology services currently commissioned? 16 Figure 3: How do you currently fund your educational psychology services? 17 Figure 4: How are trainee educational psychologist post funded in your organisation? 18 Figure 5: In which of the following settings are your qualified educational psychologists
working? 22
Figure 6: In which of the following settings are your trainees working? 23 Figure 7: Is there currently a greater demand for your service than can currently be met?
24
List of tables
Table 1: Breakdown of qualified educational psychologist headcount 11 Table 2: Breakdown of qualified educational psychologists by gender 11 Table 3: Breakdown of qualified educational psychologists by age range 12 Table 4: Breakdown of year two and three trainee educational psychologists reported 13 Table 5: Vacancies for permanent and temporary posts reported 14 Table 6: Are you experiencing any difficulties recruiting to vacant posts? 14 Table 7: Are there any other non-local authority educational psychology services working
in your area? 20
Table 8: Is there currently a greater demand for your services than can currently be met? 24 Table 9: Do you anticipate any change to the size of your educational psychology
1 Summary
This report sets out the main findings from the fifth annual survey of the local authority educational psychology workforce and where possible, builds on previous survey findings (2009 to 2012). The survey set out to collect demographic information on the educational psychology workforce and to identify the context and types of services in which educational psychologists are working. Over the past five years the survey questions have varied in response to developing government policy in this area. The least variation is between the 2012 and 2013 surveys, and therefore where possible comparisons have been made.
The survey was undertaken between September and October 2013. By the time the survey closed, a total of 112 completed responses (on behalf of 115 out of 152 local authorities)1 had been returned, representing approximately 75 per cent of the total number of local authorities in England.
Workforce demographics
The total headcount of qualified educational psychologists recorded in the survey was 1,799 across 115 local authorities: of this total, approximately 84 per cent were female and 16 per cent male. The total headcount reported across 115 local authorities for year two and three trainee educational psychologists recorded in the survey was 209 out of a total of 240 trainees on practice placement. It has not been possible to make comparisons with previous surveys as the data was collected at different times of the year, and response rates and respondees varied.
Recruitment
Fifty-two local authorities reported carrying educational psychology vacancies and, of these, only 38 respondents reported actively recruiting to permanent and / or fixed-term posts. Of the 43 per cent of respondents who reported experiencing difficulties recruiting to vacant posts almost one-third reported that this was a result of poor response to adverts and/or shortage of suitable applicants. This theme was consistent with previous surveys.
Commissioning and Funding
Respondents were asked to select from a list of options how their educational psychology services were currently commissioned2. The category with the largest number of
1
The total number of responses includes joint responses from (a) Southampton and Isle of Wight, and (b) Salford, Bury and Wigan.
2
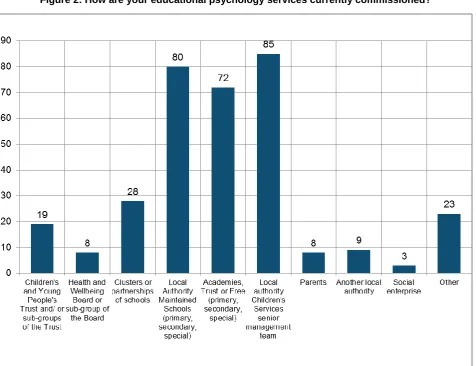
respondents was children’s services senior management team with 85 respondents, which was also the largest category in 2012 (103 respondents). This was followed by local authority maintained schools with 80 respondents (70 in 2012), and then by academies, trust or free schools (72 respondents in 2013 and 66 in 2012). It is interesting to note the number of respondents selecting the schools categories has
increased in 2013 even though the total response rate to the 2013 survey was lower than the 2012 survey. This would appear to indicate the growing trend of educational
psychology services being commissioned directly by schools.
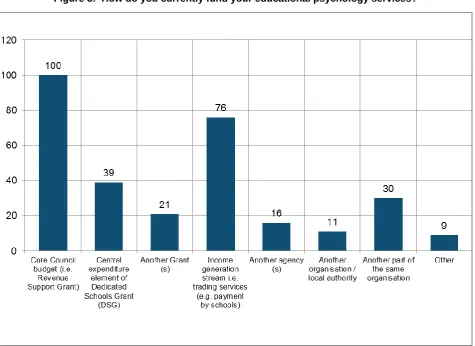
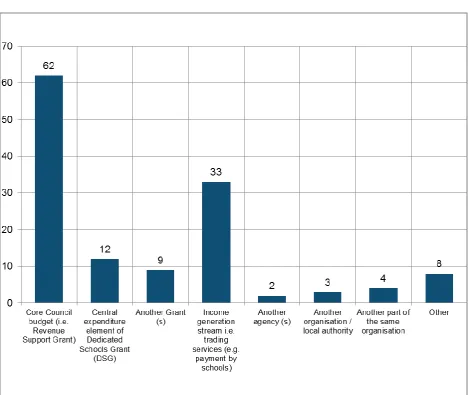
In response to the question, “how are your educational psychology services currently funded3 “, 100 respondents reported that their educational psychology services were funded by their core council budget, followed by the category, income generation stream, with 76 respondents. In comparison, 62 respondents reported that educational
psychology trainees were funded by their core council budget and 33 reported that their educational psychology trainees were funded by income generation streams. This was the same pattern as in 2012.
Service delivery
The majority of qualified educational psychologists and educational psychology trainees appeared to be working in stand-alone educational psychology services, although there appeared to be a significant number working in multi-agency teams, and a small number working in both types. While this is consistent with the 2012 survey findings, of interest is the apparent increase in 2013 in educational psychologists working in further education and child and adolescent mental health services (CAMHs).
The majority of educational psychology trainees tended to be working with schools and early years settings. Although a larger number of qualified educational psychologists spent more time working with schools, they also appeared to be spending time across a range of other settings/services compared to educational psychology trainees.
Service demand
Eighty-one per cent of respondents reported a greater demand for their educational psychology services than could be met, which was consistent with previous surveys. Over half of the open responses received reported an increased demand for services from schools. A large number of these respondents talked about an increased demand for non-statutory work through traded services which exceeded staff capacity. Requests from schools at different points during the year, at short notice, also meant future
planning was challenging. Some respondents reported that their services were struggling to meet statutory duties, which they felt were increasing.
3
In terms of what plans local authorities had put in place to meet an increased demand for services, over one-quarter of the open responses reported the use of agency staff and associates and /or employing additional staff on fixed-term contracts to meet additional demands. Approximately one-quarter of the responses reported services seeking to expand through income generation schemes by:
Developing, or extending traded services with schools and other children’s services for non-statutory work.
Monitoring demand for these services and planning future recruitment around demand.
2 Introduction
For each of the past five years the Department for Education (DfE) has commissioned an annual survey of the educational psychology workforce. The 2009 to 2011 surveys were undertaken by the Children’s Workforce Development Council (CWDC) on behalf of the DfE4. In 2012, responsibility for the survey transferred to the executive agencies of the DfE5 most recently the National College for Teaching and Leadership (NCTL).
The original survey, in 2009, set out to inform a review of educational psychology initial training, and more recently the reform of the special educational needs assessment process. These have now concluded with the implementation of the Developing
sustainable arrangements for the initial training of educational psychologists (DfE 2011) report recommendations and the publication of the Children and Families Act (2014). At present we are unaware of any plans for a workforce survey in 2014.
This report sets out the main findings from the 2013 survey of the local authority
educational psychology workforce and where possible builds on previous survey results.
2.1 Aims of the survey
The 2013 survey set out to provide the following information:
Demographic information on the educational psychology workforce; and
To identify the context and types of services in which educational psychologists are working.
At certain points in the analysis figures from previous surveys are reported alongside current figures to explore changes and identify trends in findings. It is important to note that some questions and/or response categories have changed over time and, therefore, it is not possible to directly compare responses to all questions. In addition, a degree of caution should be applied when interpreting findings from different surveys; the data was collected at different times of the year, and response rates and respondees varied.
2.2 Methodology
The survey questions and structure have varied over the past five years. The first two surveys focused on collecting demographic information and on recruitment. In 2011 the survey expanded to look at the types of services in which educational psychologists were working, how they were commissioned, and began to ask Principal Educational
4 The 2009 – 2011 Education Psychology Workforce Survey results are unpublished.
Psychologists to predict what their services may look like in the future. The 2012 and 2013 surveys are the most similar, with questions divided into four sections. These are demographic information and recruitment; commissioning and funding of educational psychology services; service delivery; and service demand. The main changes in the 2013 version were the omission of the assistant educational psychology and trainee bursary / salary questions. This was based on evidence from educational psychology training providers, and the monitoring of vacancies over the past year, which indicated that employers were converting previous assistant educational psychology posts into trainee educational psychologists practice placements. Instead the survey asked if there were any other practitioner psychologists working in the service either as qualified staff or trainees. In addition the timescales respondents were asked to predict their future service provision was reduced from two to one year. (See Appendix A: Educational Psychology Workforce Survey 2013 for questions).
The 2012 and 2013 survey questions were developed in partnership with the Educational Psychology Initial Training National Steering Group, whose members represent the employers, training providers, professional regulators, professional bodies, parents, and the unions. The National Association of Principal Educational Psychologists (NAPEP) also supported implementation of the survey.
To ensure the survey was accessible to all respondents, it was made available in both online and in Word format.
The 2013 educational psychology workforce survey was undertaken between September and October 2013. By the time the survey closed, a total of 112 responses, including joint responses (on behalf of 115 out of 152 local authorities) had been received, representing approximately 75 per cent of the total number of local authorities in England. This is a lower response compared to the 2012 educational psychology workforce survey which achieved a 83 per cent response rate (124 responses on behalf of 126 out of 152 local authorities) but higher than the 2010 and 2011 survey response rate (66 and 68 per cent respectively). Two respondents reported their local authorities’ educational psychology services were outsourced to a private provider. One local authority reported that parts of their local authority’s educational psychology services were outsourced to a private provider.
Comparisons have been made with previous surveys where appropriate however due to the variation in questions, response criteria and rates this has not always been possible. The percentages used throughout the report relate to the total number of responses to individual questions, rather than the survey population as a whole unless specified. The questions in the 2013 workforce survey were organised under three main headings:
The Team (focusing on workforce demographics, for example FTE, headcount, gender, etc.).
Commissioning and funding (investigating current commissioning and funding of EP services).
3 Current local authority educational psychology
workforce
3.1 Qualified educational psychologists
The total headcount of qualified educational psychologists on a permanent contract recorded in the survey was 1,799 across 115 local authorities (112 responses). In 2012 there were 1,955 educational psychologists across 126 local authorities. An interesting observation is the high number of part- time educational psychologists (491) who appear to be covering FTE posts in Table 1.
Table 1: Breakdown of qualified educational psychologist headcount
Total headcount of qualified educational psychologists on a permanent contract6
1,799
Total FTE figure for total headcount reported 1,446 Total No. of part-time educational psychologists 844 (47%) Total No. of educational psychologists currently on maternity/paternity
leave
75 (4%)
Total reported No. of permanent qualified educational psychologists known to also be working as for private providers (reported by 43 respondents).
85 (5%)
Total No. of qualified educational psychologists on a temporary / fixed-term contract
163 (5%)
[image:11.595.52.537.579.702.2]Total FTE for temporary educational psychologists 103
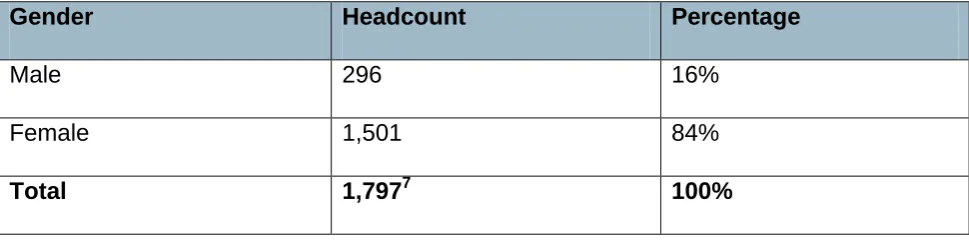
Table 2: Breakdown of qualified educational psychologists by gender
Gender Headcount Percentage
Male 296 16%
Female 1,501 84%
Total 1,7977 100%
6
Figure includes qualified educational psychologists on maternity/paternity leave. 7
Of the total number of qualified educational psychologists reported, 84 per cent were female and 16 per cent male. By comparison the total number of educational
[image:12.595.53.536.185.512.2]psychologists registered with the Health and Care Professions Council (HCPC) with home postcodes in England in 2013 was 3,078 (81 per cent female and 19 per cent male). This is a decrease in the number registered in 2012 (3,169) and greater than in 2011(2,753).
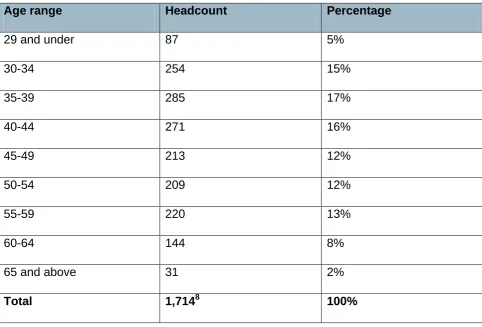
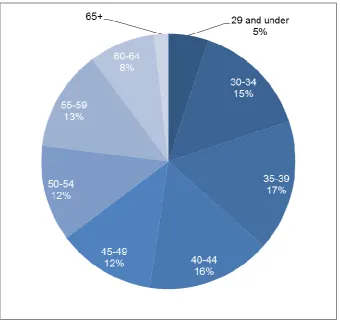
Table 3: Breakdown of qualified educational psychologists by age range
Age range Headcount Percentage
29 and under 87 5%
30-34 254 15%
35-39 285 17%
40-44 271 16%
45-49 213 12%
50-54 209 12%
55-59 220 13%
60-64 144 8%
65 and above 31 2%
Total 1,7148 100%
The largest number of educational psychologists recorded fall into the 35-39 age range (17 per cent) and the smallest number into the 65 and above category (2 per cent). These were also the largest and smallest age categories reported in the 2011 and 2012 surveys, however in 2009 and 2010 the largest category was the 55 – 59 age range. In 2013 there was a fairly even spread across other age categories between 30-34 and 55-59.
8
Figure 1: Breakdown of qualified educational psychologists by age group
3.2 Trainee educational psychologists
[image:13.595.56.538.514.728.2]The total headcount for year two and three trainees recorded in the survey was 209 (see Table 4 for a more detailed breakdown).
Table 4: Breakdown of year two and three trainee educational psychologists reported
Total No. of year two trainees educational psychologists reported
111
of which are on a one-year contract 46
of which are on a two-year contract 65
Total No. of year three trainees educational psychologists reported
98
of which were with the same employer the previous year 85
3.3 Recruitment
Respondents were asked to report the total number of vacancies currently in their services and the total number of posts to which they were actively recruiting. Forty-six local authorities (41 per cent of respondents) reported carrying vacancies for permanent posts. In the 2012, 45 per cent of the fifty–six respondents to this question reported carrying vacancies for permanent posts at the time of the survey. This would suggest a slight decrease in the number of vacancies.
[image:14.595.64.538.262.383.2]In addition, the 2013 survey asked respondents to report the number of vacancies for temporary and fixed-term posts. See Table 5 below for a more detailed breakdown. Table 5: Vacancies for permanent and temporary posts reported
Total No of LAs reporting vacancies 52 (46 % of respondents) Total No. of vacancies for permanent posts 78
Total No. of vacancies for temporary or fixed-term posts 23 Total No. of vacancies being actively recruited to 38
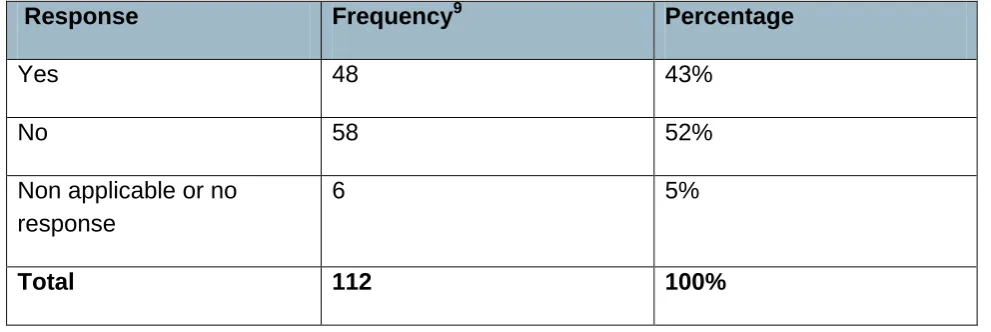
Respondents were also asked if their local authorities were currently experiencing difficulties recruiting to vacant posts. Table 6 provides a breakdown of responses received. In the 2012 survey, 41 local authorities (33 per cent of total number of respondents) reported that they had been unable to recruit to a combined total of 46 vacancies during the survey period. This could suggest there are a number of vacancies which are more difficult to fill. Again, caution should be applied when making
comparisons due to the different number of responses received in each year. Table 6: Are you experiencing any difficulties recruiting to vacant posts?
Response Frequency9 Percentage
Yes 48 43%
No 58 52%
Non applicable or no response
6 5%
Total 112 100%
9
[image:14.595.48.544.556.722.2]If respondents selected, ‘yes’, to the above questions they were asked to explain why the local authority was experiencing difficulties recruiting to educational psychology posts in their service. A total of 56 open responses were received to the question. The main themes/categories are summarised below, and are ordered according to number of responses received, with the highest first.
Poor response to adverts and/or shortage of suitable/qualified applicants. Limited interest to temporary or fixed-term posts from prospective applicants.
Difficulties were a result of changes to staff pay and conditions, with a small number of respondents reporting continuing disputes within local authorities over these changes.
Some respondents believed that the response to job adverts was very much dependent on time of year posts were advertised. Geographical location was also reported as a reason for why a small number of respondents were experiencing difficulties recruiting to posts.
4 Current Commissioning and Funding of Educational
Psychology Services
4.1 Commissioning of educational psychology services
[image:16.595.58.535.237.603.2]The 115 respondents were asked to select from a list of options how their educational psychology services were currently commissioned. Respondents could select more than one commissioning model (i.e. all that apply). See Figure 2 below for total number of responses received for each category.
Figure 2: How are your educational psychology services currently commissioned?
4.2 Funding of Educational Psychology Services
[image:17.595.58.534.173.519.2]The 115 respondents were asked to select from a list of options how their educational psychology services were currently funded. Figure 3 below presents the total number of responses for each funding source. Respondents could select more than one category (i.e. all that apply to their local authority).
Figure 3: How do you currently fund your educational psychology services?
If respondents selected ‘other’ category they were asked to state the names of other grants, income generation streams; other agencies, authorities, and organisations. A total of five open responses were received. Responses included: big lottery fund; children centre commission; universities, troubled families programme; and high needs funding block of the dedicated schools grant.
Figure 4 below presents the total number of responses for each funding source. Again, respondents could select all categories that applied.
Figure 4: How are trainee educational psychologist post (s) funded in your organisation?
If respondents selected ‘other’ category they were asked to provide further details. A total of 18 open responses were received. These included: bursary arrangements with
universities; underspend from vacancies; salary budgets where educational psychology trainees were covering vacancies; additional income generated from training and / or educational psychologists working as tutors at universities; traded services with clusters of schools; and conversion of funding from one qualified educational psychology post to two educational psychology trainee posts. Four respondents stated they did not currently fund educational psychology trainees.
Respondents were asked to provide further details if they anticipated any changes to the way educational psychology trainee posts would be funded in the next 12 months. Seventeen open responses were received to the question. Responses received are summarised below:
The cost of all or more trainees would need to be covered via income generation streams such as traded services.
The local authority does not have the funds to employ, or fund educational psychology trainees.
Funding available for educational psychology trainees varies each year and is dependent on available budgets.
Potentially move to a bursary scheme rather than employing trainees directly.
One respondent reported that one educational psychology trainee will be paid a salary directly by an academy, and no longer need to be funded by a local authority bursary.
4.3 Commissioning and funding of educational psychology
services in the next 12 months
A total of 58 open responses were received to the question on whether respondents anticipated any changes to the way their services would be commissioned in the next 12 months. Thirty-seven open responses were received to the question on whether
respondents anticipated any changes to the way their services would be funded. The main themes/categories from both sets of responses are summarised below.
The majority of respondents (almost half of the responses received to the questions) anticipate more of their services will be commissioned and funded by schools through traded services. In particular, more engagement from academies, clusters of schools, and further education was expected. A number of respondents also anticipate less funding will be provided by core council grants.
A number of respondents stated they were in the process of developing traded services, or were under increasing pressure to generate income through
commissioned services as a result of budget cuts. A small number of respondents reported that the their local authorities were considering different models of service delivery, including partnership organisations, joint ventures, and outsourcing of educational psychology services.
A small number of respondents reported that educational psychology / special educational needs services were in the process of being reviewed. Some
respondents expected services to be reconfigured as result of special educational needs and disability (SEND) reforms which would require new commissioning arrangements.
A small number of respondents expected more work with parents, for example, one local authority reported that they would be trialling open access, drop in sessions for parents.
A small number of respondents reported funding currently received from the schools forum and pathfinders coming to an end.
4.4 Non-local authority educational psychology services
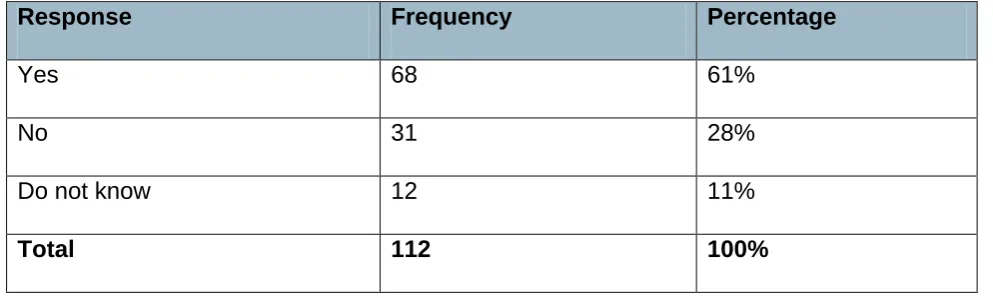
[image:21.595.48.545.272.421.2]Respondents were asked if they were aware of any other non-local authority educational psychology services working in their area. A breakdown of responses to the question is presented in the Table 11 below. It is important to note that the responses provided are indicative and dependent on the individual respondents’ knowledge of other educational psychology services in a given area.
Table 7: Are there any other non-local authority educational psychology services working in your area?
Response Frequency Percentage
Yes 68 61%
No 31 28%
Do not know 12 11%
5 Service Delivery
5.1 Service/settings
Respondents were asked to select which services/settings their educational
psychologists and educational psychology trainees are working. The 115 respondents could select more than one category10 .The full list of services/settings are respondents could select from are presented below.
Service model:
educational psychology service
multi-agency / integrated service / team
Social care:
children looked after child protection
disability and fostering adoption
Schools / settings:
local authority maintained schools (primary, secondary, special) academies, trust, or free schools (primary, secondary, special) early years settings
further education (e.g. college, sixth form)
child and adolescent mental health services (CAMHs) independent and non-maintained provision
other
10
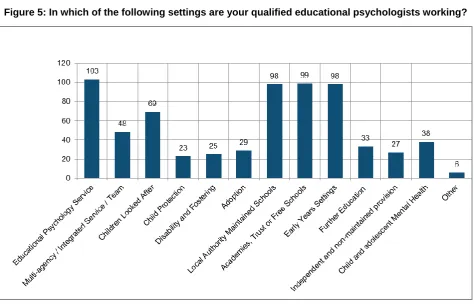
Figure 5 and Figure 6 present all the categories and the total number of respondents selecting each category11. The majority of qualified educational psychologists and educational psychology trainees appear to be working in standalone educational
psychology services (103), although a significant number (48) are reported to be working in multi-agency teams, and a small number working in both types. While this is consistent with the 2012 survey findings, of interest is the apparent increase in 2013 in educational psychologists working in further education and CAMHs.
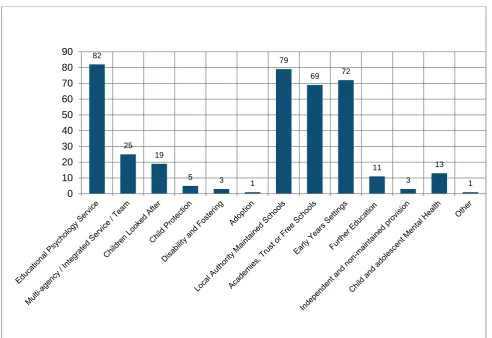
The majority of educational psychology trainees appear to be working in educational psychology services (82), with schools (79) and in early years (72) settings. Although a larger number of qualified educational psychologists spent more time working with schools, they also appeared to be spending time across a range of other
settings/services compared to educational psychology trainees. This is the same pattern as in 2012.
Respondents were asked to list any other services / settings which were not included in the list. Responses received included: youth offending teams; child development
[image:23.595.58.533.368.672.2]centres; work with voluntary organisations; open access community; universities; clinical hospital settings; supporting trainees; and requests from key workers.
Figure 5: In which of the following settings are your qualified educational psychologists working?
11
Figure 6: In which of the following settings are your trainees working?
5.2 Other practitioner psychologists
Respondents were asked whether there were any other practitioner psychologists working as qualified staff, or trainees, in their services. Forty-four responses were received to the question. Thirty of the forty-four responses stated they did not have any other practitioner psychologists. Of the 14 respondents who listed other practitioners these included the following:
clinical psychologists;
associate educational psychologists on contracts / consultant psychologist psychology research associates
assistant educational psychologists / psychology assistant creative psychotherapist
counselling psychologists mental health workers
psychology students (MSc and undergraduates)
82
25 19
5 3 1
79
69 72
11 3
13 1
6 Service Demand
6.1 Demand for services
[image:25.595.47.542.211.362.2]Respondents were asked whether there was currently a greater demand for their educational psychology services than could be met. Breakdown of responses to the question are presented in Table 8 and Figure 7 below.
Table 8: Is there currently a greater demand for your services than can currently be met?
Response Frequency Percentage
Yes 91 81%
No 17 15%
Non response 4 4%
Total 112 100%
Figure 7: Is there currently a greater demand for your service than can currently be met?
17, 15%
91, 81%
4, 4%
No Yes
[image:25.595.131.455.405.685.2]Ninety responses were received to the question which asked respondents to explain why there was greater demand for their services than could currently be met. The main themes/categories are summarised below.
Over half of the responses received reported an increased demand for services from schools. A large number of these respondents talked about an increased demand for non-statutory work through traded services with schools which exceeded staff
capacity. Requests from schools at different points during the year, and at short notice, also meant future planning was challenging. Some respondents reported that their services were struggling to meet statutory duties, which were also increasing. A number of respondents reported a reduction in staff capacity due to vacant posts and reduction / uncertainty around budgets. Lengthy local authority procedures often prevented rapid recruitment and deployment of staff to meet demands. In some cases, restrictions were placed on headcount even when additional funding could be generated via traded services.
Some respondents talked about the broadening of the range of tasks expected of educational psychologists as a result of integrated working.
A smaller number of respondents stated the following reasons:
Increase in school population and young people with special needs and the complexity and severity of cases.
Increased demands from other provisions, such as independent schools Unable to recruit to fixed-term posts.
Changes to the special educational needs assessment process and the amount of the educational psychologist’s time required to meet statutory duties
Increased demand for training from schools and other organisations, for example, workforce intervention programmes/family-focused work training.
Reduction in other support staff.
6.2 Plans to meet increased demand for services
Respondents who reported a greater demand for their services than could be met were asked to state what plans they had in place to meet the increased demand. Eighty-three open responses were received to the question. The main themes/categories are
summarised below.
Increasing number of non-core staff
demands. Some respondents were currently in the process of creating associate roles, or were exploring the possibility of creating associate/locum registers. In most cases, these posts were (or would be expected to be) funded through income generation schemes. A smaller number of responses talked about retaining or taking on (additional) trainees and / or assistant educational psychologists. Part-time staff were also offered additional hours to cover fluctuating demands.
Income generation schemes
Approximately one-quarter of the responses reported services seeking to expand through income generation schemes by:
Developing, or extending traded services with schools and other children’s services for non-statutory work, such as training, development, and project work.
Monitoring demand for these services and planning future recruitment around demand.
Negotiating the use of income generated from traded services to fund educational psychology posts.
However, a small number of respondents noted that the use of income generated posts was not a viable long-term solution for delivery of core services.
Increasing number of permanent staff
A number of respondents spoke of employing additional staff, or were in the process of: negotiating additional funding to employ more staff
putting in requests / business cases to recruit to posts
re-advertising for vacant posts. Although, some respondents acknowledged the shortage of suitable /qualified applicants.
Reviewing service delivery models / patterns of deployment
A small number of respondents reported reviews of current service delivery models and working practices taking place, for example:
Prioritising work and restricting access to the service and/or ceasing to deliver non-essential activities.
Review time allocation systems through which core services are delivered Strict use of time allocation model
Other responses included:
Shifting revenue funding for core school based services to specialist roles in social care and health.
Requesting that schools plan more effectively.
Working closely with special educational needs services to evaluate the impact of Special Educational Needs and Disability (SEND) reforms.
6.3 The future
[image:28.595.47.544.346.515.2]Respondents were asked whether they anticipated any changes to the size of their educational psychology services over the next 12 months. Respondents were asked to express any changes as FTE. See Table 9 below for breakdown of responses to the question.
Table 9: Do you anticipate any change to the size of your educational psychology service(s) over the next year?
Response Qualified educational psychologists (FTE)
Trainees (FTE)
Increase 28 responses reporting a total increase of 57 posts
3 respondents reporting a total increase of 15 posts
Decrease 5 responses reporting a total of 7 posts
17 responses reporting a decrease of 20 posts No change /unsure 47 responses 37 responses
Changes to the size of educational psychology services in the next 12
months
Respondents were invited to provide more details regarding anticipated changes to the size of their educational psychology services over the next 12 months. Nine respondents reported no changes to the number of qualified educational psychologists in their
services. Twenty-two respondents reported being uncertain about changes to the number of qualified educational psychologists and any changes in headcount would be
dependent on a range of factors, including:
level of trading with schools and other settings; budget cuts;
outcome of on-going reviews / options appraisals;
whether proposals/business cases for additional staff were approved
Fifteen respondents anticipated no changes to number of trainees in their service. Eighteen respondents reported being uncertain about whether there would be any changes to the number of trainees in their service. Respondents, generally, hoped to be able to maintain the same number of trainees each year; however, this was dependent on level of funding.
In addition, respondents were asked whether they had any additional comments in relation to service delivery. A total of 30 open comments were received to the question. The main themes/categories are summarised below.
A number of respondents reported a high demand for educational psychology services, with the level of work being commissioned by schools and parents often exceeding the delivery capacity. However, future planning was impeded by lengthy local authority procedures, budgetary constraints, and restrictions placed on
headcount and trading. Two respondents felt there was a requirement for local authorities to be more creative and responsive to new and innovative ways of
working. A number of respondents reported uncertainty over the longer term position of their services.
Difficulties in recruiting qualified applicants meant it was difficult to meet increasing demands placed on educational psychology services. The age and gender profile of the workforce also meant that services needed to continually recruit.
Other respondents reported fixed-term / temporary posts being converted to permanent posts once demand was established.
Having to take on associates in order to work flexibly to meet fluctuating demand. Two respondents reported current vacant principal educational psychologist posts in their service, with another respondent principal educational psychologist needing to reduce their time within the educational psychology services as a result of having to take a lead role in special educational needs and disability reforms.
Appendix A: Educational Psychology Workforce
Survey 2013
Educational Psychology Workforce Survey 2013
Section A: Respondents Details
1) Name 2) Job title
3) Local Authority
4) If all the local authority’s
educational psychology services have been outsourced to a private provider, please provide name of organisation.
5) If any of the Local Authority’s
educational psychology services outsourced to private provider (s), please provide details.
6) Email address
7) Contact telephone number 8) Please provide any additional
information (e.g. two or more Local Authorities share
educational psychology services)
Section B: The Team
Qualified Educational Psychologists (on permanent contracts)
9) What is the total headcount of qualified Educational
Psychologists currently employed by your local authority on a permanent contract? (including those on maternity / paternity leave)
How many of the total headcount are male?
How many of the total headcount are female?
How many of the total headcount work part-time?
10) Are any of your qualified Educational Psychologists also working as private Educational Psychologists?
Choose an item.
11) If yes to question 10, how many?
12) What is the total FTE figure for the total headcount currently employed?
14) How many of the current headcount are in each of the following age categories?
29 and under
30-34 35-39 40-44 45-49 50-54 55-59 60-64 65 +
Trainee Educational Psychologists
15) How many year two trainees do you have currently working in your service?
How many of these are on a one-year contract?
How many of these are on a two-year contract?
How many year three trainees are currently working in your service?
How many of these were working for you as a year two trainee last year?
Temporary members of staff (includes contract staff)
16) What is the total headcount of qualified Educational Psychologists currently working in your local authority on a temporary contract? (including those on maternity / paternity leave)
What is the total FTE figure for the headcount of temporary qualified Educational Psychologists working in your local authority?
Are any of your temporary members of staff also employed by other private providers on a part-time basis?
Choose an item.
Vacancies
17) Please record the total number of vacancies for permanent posts currently in your service
Please record the total number of vacancies for temporary or fixed-term posts currently in your service
Please record the number of vacancies for permanent posts to which you are actively recruiting
Please record the number of vacancies for temporary or fixed-term posts to which you are actively recruiting
17) Please record the total number of vacancies for permanent posts currently in your service
19) If you answered yes to 18, please state the reason(s) below
Section C: Commissioning and Funding
20) How your Educational Psychology Services are currently commissioned? (Please tick all that apply)
By the Children’s and Young People’s Trust and/or sub groups of the Trust
☐
By the Health and Well Being Board or sub group of the Board ☐
Clusters or partnerships of schools ☐
Local Authority Maintained Schools (primary, secondary, special) ☐ Academies, Trust or Free (primary, secondary, special) ☐ By the local authority Children’s Services senior management team ☐
Parents ☐
Another local authority ☐
Social enterprise ☐
Other ☐
If you stated other, please provide details here:
21) If you anticipate any changes to the way your Educational Psychology Services will be commissioned over the next 12 months, please provide details below:
22) Are there any other non-local authority Educational Psychology services working in your area?
Choose an item.
23) Do you anticipate there will be any other non-local authority Educational Psychology services working in your area over the next 12 months?
24) How do you fund your Educational Psychology Service? (please tick all that apply)
Core Council budget (i.e. Revenue Support Grant)
☐
Central expenditure element of Dedicated Schools Grant (DSG)
☐
Another Grant (s) ☐ Name grant (s)
Income generation stream i.e. traded services (e.g. payment by schools)
☐ Name stream (s)
Another agency (s) ☐ Name agency / agencies
Another organisation / local authority ☐ Insert name Another part of the same organisation ☐
Other ☐ Please give details
25) If you anticipate any changes to the way your Educational Psychology Services will be commissioned over the next 12 months, please provide details below:
26) How are Trainee Educational Psychologist posts funded in your organisation? (Please tick all that apply)
Core Council budget (i.e. Revenue Support Grant)
☐
Central expenditure element of Dedicated Schools Grant (DSG)
☐
Another Grant (s) ☐ Name grant (s)
Income generation stream i.e. trading services (e.g. payment by schools)
☐ Name stream (s)
Another agency (s) ☐ Name agency / agencies
Another organisation / local authority ☐ Insert name Another part of the same organisation ☐
Other ☐ Please give details
Section D: Service Delivery
28) In which of the following settings are your Qualified and Trainee Educational Psychologists working? (Please tick as appropriate)
Service model Qualified Educational
Psychologists Trainee Educational Psychologists Educational Psychology Service ☐ ☐
Multi-agency / Integrated Service / Team
☐ ☐
Social Care
Children Looked After ☐ ☐
Child Protection ☐ ☐
Disability and Fostering ☐ ☐
Adoption ☐ ☐
Schools / settings
Local Authority Maintained Schools (primary, secondary, special)
☐ ☐
Academies, Trust or Free Schools (primary, secondary, special)
☐ ☐
Early Years Settings ☐ ☐
Further Education (e.g. FE college, sixth form college)
☐ ☐
Child and adolescent Mental Health (CAMHs)
☐ ☐
Independent and non-maintained provision
☐ ☐
Other (please state)
Service demand
30) Is there a greater demand for your service than can currently be met?
Choose an item.
If you answered yes to question 30, please state reason(s):
If you answered yes to question 30, what plans do you have in place for meeting the demand?
31) Do you anticipate any change to the size of your Educational Psychology Service(s) over the next year? (please express as FTE)
Size of service (s)
Please insert number increase or decrease of staff in each category
Example: if you currently have 6 FTE EPs and anticipate that this will increase to 7 FTE, enter 1 in the ‘increase’ box
Educational Psychologists Trainee Educational
Psychologists
An increase (insert FTE no)
A decrease (insert FTE no)
No change (tick box)
☐ ☐
Not sure at this point in time (tick box)
☐ ☐
© Crown copyright 2014
Reference: DFE- RR338
ISBN: 978-1-78105-314-0
You may re-use this document/publication (not including logos) free of charge in any format or medium, under the terms of the Open Government Licence v2.0. To view this licence, visit www.nationalarchives.gov.uk/doc/open-government-licence/version/2 or email: [email protected].
Where we have identified any third party copyright information you will need to obtain permission from the copyright holders concerned.
The views expressed in this report are the authors’ and do not necessarily reflect those of the Department for Education.
Any enquiries regarding this publication should be sent to us at:
[email protected] or www.education.gov.uk/contactus