Growth is perhaps the most studied of all parameters used to describe the life history of exploited fish. Growth is usually expressed as a mathematical equation describing the mean growth of a population and relating size to age (Katsanevakis and Maravelias, 2008). An understanding of growth is fundamental for population modeling, stock assessments, and managing exploited species (Gulland, 1988). The methods used to estimate growth in fish vary significantly with the type of data being used. The most commonly used data for estimating fish growth is leng th-at-age data, although length-frequency data and mark recapture data are also used (Francis, 1988; Labelle et al., 1993). Counts of periodic growth increments observed in otoliths or other hard parts are predominantly used to estimate fish age (Begg et al., 2005; Campana, 2005), and a range of growth models have been developed to be fitted to length-at-age data (e.g., Ricker, 1979; Schnute, 1981). However,
length-at-Integrating methods for determining
length-at-age to improve growth estimates
for two large scombrids
Aaron C. Ballagh (contact author)1,* David Welch1,2
Ashley J. Williams1,3 Amos Mapleston1 Andrew Tobin1 Nicholas Marton4
Email address for contact author: [email protected] 1 Fishing and Fisheries Research Centre
School of Earth and Environmental Sciences James Cook University
Townsville, Queensland 4811, Australia
*Present address for contact author: Research Services
James Cook University
Townsville, Queensland 4811 Australia 2 Queensland Primary Industries
and Fisheries
Department of Employment, Economic Development and Innovation
P.O. Box 1085
Oonoonba, Queensland 4811, Australia
3 Oceanic Fisheries Programme
Secretariat of the Pacific Community BP D5 98848 Noumea CEDEX, New Caledonia 4 Australian Bureau of Agricultural and Resource Economics–Bureau of Rural Sciences Department of Agriculture, Fisheries and Forestry GPO Box 1563
Canberra, Australian Capital Territory 2601, Australia
Manuscript submitted 6 January 2010. Manuscript accepted 25 October 2010. Fish. Bull. 109:90–100 (2011).
The views and opinions expressed or implied in this article are those of the author (or authors) and do not necessarily reflect the position of the National Marine Fisheries Service, NOAA.
Abstract—Fish growth is commonly estimated from length-at-age data obtained from otoliths. There are several techniques for estimating length-at-age from otoliths including 1) direct observed counts of annual increments; 2) age adjustment based on a categorization of otolith margins; 3) age adjustment based on known periods of spawning and annuli for-mation; 4) back-calculation to all annuli, and 5) back-calculation to the last annulus only. In this study we compared growth estimates (von Ber-talanffy growth functions) obtained from the above five methods for esti-mating length-at-age from otoliths for two large scombrids: narrow-barred Spanish mackerel (Scomberomorus
commerson) and broad-barred king
mackerel (Scomberomorus
semifascia-tus). Likelihood ratio tests revealed
that the largest differences in growth occurred between the back-calcula-tion methods and the observed and adjusted methods for both species of mackerel. The pattern, however, was more pronounced for S. commerson than for S. semifasciatus, because of the pronounced effect of gear selectiv-ity demonstrated for S. commerson. We propose a method of substituting length-at-age data from observed or adjusted methods with back-calcu-lated length-at-age data to provide more appropriate estimates of popu-lation growth than those obtained with the individual methods alone, particularly when faster growing young fish are disproportionately selected for. Substitution of observed or adjusted length-at-age data with back-calculated length-at-age data provided more realistic estimates of length for younger ages than observed or adjusted methods as well as more realistic estimates of mean maximum length than those derived from back-calculation methods alone.
age estimates are not always col-lected or treated in the same way, either because of sampling bias or differences in aging protocols, and it is often unknown to what degree dif-ferences in length-at-age estimation methods affect parameter estimates from growth models.
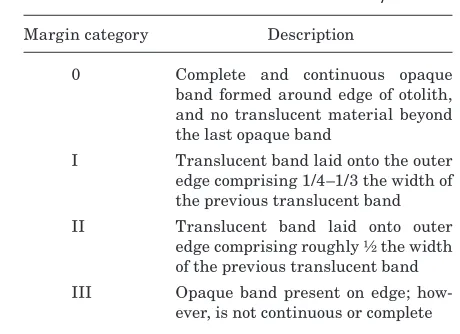
Table 1
Description of otolith margin categories used in age adjust-ment of Scomberomorus commerson and S. semifasciatus.
Margin category Description
0 Complete and continuous opaque
band formed around edge of otolith, and no translucent material beyond the last opaque band
I Translucent band laid onto the outer edge comprising 1/4–1/3 the width of the previous translucent band II Translucent band laid onto outer
edge comprising roughly ½ the width of the previous translucent band III Opaque band present on edge; how-
ever, is not continuous or complete
back-calculation allow the estimation of lengths-at-ages that are rarely observed, particularly in the absence of a representative sample because of gear selectivity (Lopez-Abellan et al., 2008), or to increase the amount of length-at-age data to be used in fitting a growth curve (e.g., Shafi and Jasim, 1982; Grudtsev and Korolevich, 1986).
Temporal and spatial variation in growth can have significant implications for the assessment and man-agement of exploited populations (Rahikainen and Stephenson, 2004). However, variation in growth from estimation error is also likely to have significant implications for stock assessment, and accounting for bias in growth estimation is not always feasible (Gwinn et al., 2010). Substantial differences in growth estimates have previously been demonstrated from different methods for determining length-at-age from otoliths and other hard parts (e.g., Lucena and O’Brien, 2001; Ballagh et al., 2006). We examine the effects of several different methods for determining length-at-age from otoliths.
Here we compared estimates of growth derived from several commonly used methods for obtaining length-at-age data from otoliths. We applied this approach to the otoliths of two large scombrids, narrow-barred Spanish mackerel (Scomberomorus commerson) and broad-barred king mackerel (Scomberomorus semifasciatus), to test for differences in growth attributable to the methods used, and to make inferences about which method(s) provides the most appropriate estimate of length-at-age for growth estimation. Scomberomorus commerson and S. semifasciatus are fast growing species and it was expected that differences in growth estimates from different length-at-age data would be clearer than those for slower growing species. We also examined the effects on growth estimates when length-at-age data from different methods are combined, such as when back-calculated and observed length-at-age data are combined (e.g., Lopez-Abellan et al., 2008).
Materials and methods
Samples of S. commerson were collected from several loca-tions along the east coast of Queensland from commercial and recreational fishermen using various hook-and-line gears, and S. semifasciatus samples were collected from the east coast of Queensland, Gulf of Carpentaria, and the Northern Territory from commercial fishermen using gillnets of various mesh sizes. A small number of juveniles of each species were collected by beam trawl from the east coast of Queensland.
Length-at-age and growth
For each mackerel species five methods of determining length-at-age from otoliths were investigated: observed (Obsv); category-adjusted (Adj-cat); formula-adjusted (Adj-frm); back-calculation to all annuli (BC-all); and back-calculation to the last annulus only (BC-last).
Otoliths were aged, measured, and back-calculation of previous length-at-age for both species was done by using identical methods (Ballagh et al., 2006; Tobin and Mapleston1; Welch et al.2). Observed length-at-age was
defined as the agreed upon count of complete opaque increments (annuli) from multiple readings (up to three) of each otolith, coupled with the fork length of the fish at capture. Back-calculation of previous length-at-age was done by using the body proportional hypothesis described by Francis (1990) with the parameters from linear geometric mean regression of otolith radius on fork length (e.g., Ballagh et al., 2006).
Two methods for age adjustment were investigated in this study: category adjustment, and formula adjustment. Category adjustment was based on simple criteria whereby the observed age of each otolith was adjusted for the marginal increment at the outer edge of the otolith, which was categorized according to a system (margin category, Table 1, Fig. 1). Otoliths for which there was agreement in the annuli count were assigned a final margin category if any two of the margin categories from multiple readings for a single otolith were the same. For final margin categories of 0 or I, no age adjustment was deemed necessary and the agreed upon count of annuli was accepted as the
1 Tobin, A. J., and A. Mapleston. 2004. Exploitation dynamics and biological characteristics of the Queensland East Coast Spanish mackerel (Scomberomrous commerson) fishery. CRC Reef Research Centre Technical Report No 51, 61 p. CRC Reef Research Centre, Townsville, Australia. 2 Welch, D. J., R. C. Buckworth, J. R. Ovenden, S. J. Newman,
Figure 1
Otolith of narrow-barred Spanish mackerel (Scomberomorus
commerson), showing the margin categories used in age
adjustment (see Table 1). In this example a complete opaque band (annulus) is visible at the otolith margin (margin category= 0, adjusted age=2).
final age because marginal increment growth beyond a complete annulus, and thus a whole year, was considered to be negligible. Final margin categories of II were considered to be closer to half a complete annulus, and thus the equivalent of growth for half a year, and therefore the age was adjusted by adding 0.5 to the count of annuli to give the final age. For otoliths with a final margin category of III, the marginal increment was considered to be close to a whole annulus and therefore the age was adjusted by adding one to the agreed upon count of annuli. For otoliths with margin categories that were not the same, the higher of the category estimates was accepted as the final margin category and age was adjusted accordingly.
For otoliths with no agreed upon age, it was still possible to assign an adjusted age in some cases on the basis of the margin increment category and the age estimates. If multiple age estimates were no more than one year apart, the margin category of the higher age was 0 or I, and the margin category for the lower age estimate was III, the adjusted age was accepted as the higher of the two age estimates. If there was still no agreement between readings on ages and margin categories, the otolith was rejected for age adjustment. Less than 0.5% of all otoliths were rejected for age adjustment.
3 Cameron, D., and G. Begg. 2002. Fisheries biology and interaction in the northern Australian small mackerel fishery. Final report to the Fisheries Research and Development Corporation, projects 92/144 and 92/144.02, 236 p. Department of Primary Industries, Brisbane, Queensland, Australia.
Formula adjustment was based on a modification of the age adjustment algorithms used in Williams et al. (2008). The age adjustment formula corrected for the collection of samples across different months of the year by adjusting observed-age estimates to account for the period of annuli formation, spawning period (birth date), and the date of capture. The following algorithms were used to adjust age estimates:
If N = 0, agem = mc, (1)
If N > 0, agem=
(
(N− ×1 12))
+mb+mc, (2)where N = number of complete annuli; agem = age in months;
mb = number of months from the assigned birth date to the assigned date of annuli forma-tion; and
mc = number of months from the assigned date of annuli formation to the date of capture.
It was inferred from previous studies that the pe-riod of annuli formation coincides with the spawning period for both species (McPherson, 1992, 1993; Tobin and Mapleston1; Welch et al.2; Cameron and Begg3).
The birth date and date of annulus completion was
assigned as 1 November, which represents the mid spawning period for both species (McPherson, 1993; Welch et al.2; Cameron and Begg3). As a result, the time
between spawning (birth date) and the timing of annuli formation (mb) was assigned as 12 months.
All analyses were done separately for females and males as previous studies have shown both species have sexually dimorphic growth (McPherson, 1992; Ballagh et al., 2006; Welch et al.2; Cameron and Begg3). The
von Bertalanffy growth function (VBGF, Beverton and Holt, 1957) was used to describe the growth of both species for all length-at-age data and is described by the following equation:
Lt=L −e K t t
∞(1 (− (−0))), (3)
where Lt = length at age t;
L∞ = theoretical maximum length;
K = growth coefficient or the rate at which L¥ is
asymptotically reached; and
t0 = theoretical age where length is equal to zero.
ratio tests on pairs of individual methods. A Bonferroni adjustment was used for the multiple comparisons to account for inflation in the probability of a type-I error by adjusting the significance level:
αadj=αn, (4)
where a = significance level;
aAdj = adjusted significance level; and n = number of multiple comparisons.
Selectivity effects
Mean back-calculated length-at-age from all annuli was compared to mean back-calculated length-at-age from the last annulus to infer if there were any selectivity effects that had biased the sample of each species, or if Lee’s phenomenon (Ricker, 1969) was present. Lee’s phenomenon, whereby lengths at early ages back-calculated from younger fish are greater than lengths at the same age estimated from older fish, has been shown to bias estimates of growth based on back-cal-culation of length-at-age by using all annuli (Vaughan and Burton, 1994). This bias can be a result of large otoliths in slow growing fish confounding the relation-ship between length and otolith size and resulting in relatively small back-calculated length-at-age for younger ages (Campana, 1990). However, it can also result from selectivity bias in the sample whereby the faster younger fish are disproportionately selected for by the fishing gears (Lucena and O’Brien, 2001; Ballagh et al., 2006) or where size-selective mortality has removed fast growing individuals from older age classes, thereby biasing the population demographics (Fossen et al., 1999). Differences in the mean back-calculated lengths-at-age from all annuli and the last annulus can therefore be used to infer any biases such as selectivity on sampling (Vaughan and Burton, 1994). Analysis of variance (ANOVA) and Student’s t-test were used to compare mean back-calculated length-at-age from all annuli to mean back-calculated length-at-age from the last annulus only.
Substitution of data
Back-calculated lengths-at-age from all annuli were compared to observed lengths-at-age by using ANOVA and t-tests. Comparisons were made to determine the ages for which there were no differences between back-calculated and observed length-at-age to test the hypoth-esis that supplementing back-calculated length-at-age with observed or adjusted length-at-age can provide estimates of growth parameters that are more appro-priate representations of the population (Ballagh et al., 2006). Observed and adjusted length-at-age data were substituted with back-calculated length-at-age data (BC-all and BC-last) for the first few consecutive ages that were significantly different from observed length-at-age. This procedure resulted in several combinations of data from different methods for determining
length-at-age (back-calculated, observed, and adjusted), and is hereafter referred to as substitution.
VBGF curves were fitted to the substituted length-at-age data sets by using nonlinear regression. Likelihood ratio tests were performed to test for differences in growth among the different substituted combinations of length-at-age data. Where differences were found, multiple comparisons by using likelihood ratio tests with Bonferroni adjustments (Eq. 4) were performed on pairs of substituted data combinations.
Results
Growth
A high degree of variability was observed among the VBGF parameter estimates from the different methods for estimating length-at-age for both species and sexes (Table 2). The two back-calculation methods consistently yielded lower estimates of L∞ and higher estimates of K and t0 than the observed and adjusted methods. Less error was also observed in the estimates of L∞and t0 for the back-calculated methods than for the observed and adjusted methods.
Comparison of the VBGF growth estimates by using overall likelihood ratio tests revealed significant differ-ences in growth estimates among the methods for both species and sexes (S. commerson females: c2= 678.9,
df=12, P<0.0001, males: c2=704.4, df=12, P<0.0001;
S. semifasciatus females: c2=849.4, df=12, P<0.0001,
males: c2=913.1, df =12, P<0.0001). Multiple
compari-sons revealed some consistent patterns in growth esti-mates among methods (Table 3). Significant differences were observed between the back-calculation methods (BC-all, BC-last) and the adjusted and observed meth-ods (Adj-cat, Adj-frm, Obsv), and no significant dif-ferences were found between the two back-calculation methods for both species. There were no significant differences between the two adjusted methods for both sexes of S. commerson and female S. semifasciatus, whereas the two adjusted methods differed significantly for male S. semifasciatus. No significant differences were found between the adjusted and observed methods for both species, with the exception of the formula ad-justed and observed methods for female S. commerson.
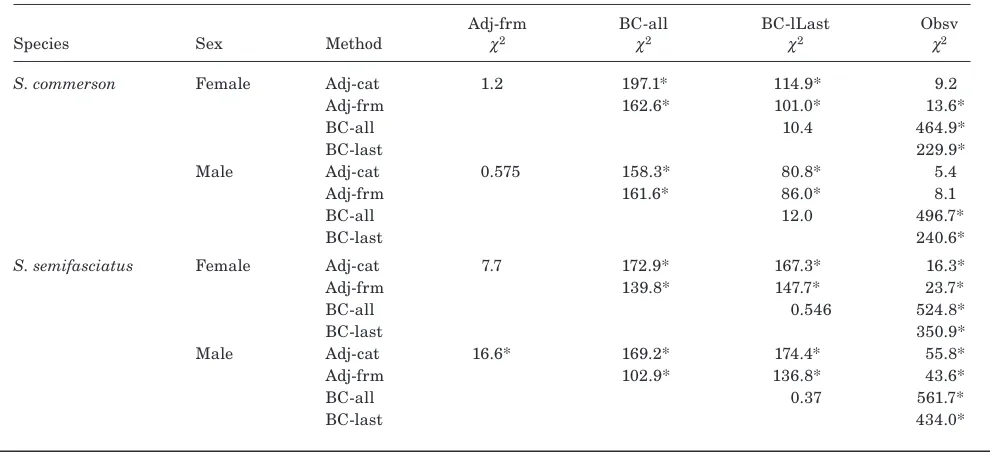
formula-Table 3
Chi-squared values for the overall likelihood ratio test between growth estimates from different methods (category adjusted [Adj-cat], formula adjusted [Adj-frm], back-calculation to all annuli [BC-all], back-calculation to the last annulus only [BC-lLast], and observed [Obsv]) for estimating length-at-age for Scomberomorus commerson and S. semifasciatus (* indicates significant difference at P<0.005, Bonfferoni-adjusted a for multiple comparisons, df=3).
Adj-frm BC-all BC-lLast Obsv
Species Sex Method c2 c2 c2 c2
S. commerson Female Adj-cat 1.2 197.1* 114.9* 9.2
Adj-frm 162.6* 101.0* 13.6*
BC-all 10.4 464.9*
BC-last 229.9*
Male Adj-cat 0.575 158.3* 80.8* 5.4
Adj-frm 161.6* 86.0* 8.1
BC-all 12.0 496.7*
BC-last 240.6*
S. semifasciatus Female Adj-cat 7.7 172.9* 167.3* 16.3*
Adj-frm 139.8* 147.7* 23.7*
BC-all 0.546 524.8*
BC-last 350.9*
Male Adj-cat 16.6* 169.2* 174.4* 55.8*
Adj-frm 102.9* 136.8* 43.6*
BC-all 0.37 561.7*
[image:5.612.58.554.158.410.2]BC-last 434.0*
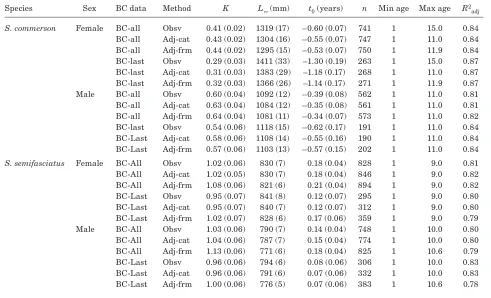
Table 2
Estimates for von Bertalanffy growth function parameters: growth coefficient (K), theoretical maximum length (L∞), and theoretical age where length is equal to zero (t0) (± standard error), sample numbers (n), age ranges, and adjusted R2 values from different methods (observed [Obsv], category-adjusted [Adj-cat], formula adjusted [Adj-frm], back-calculation to all annuli [BC-all], and back-calculation to the last annulus only [BC-last]) for estimating length-at-age for Scomberomorus commerson and S.
semifasciatus.
Species Sex Method K L∞ (mm) t0 (years) n Min age Max age R2
adj
S. commerson Female Obsv 0.16 (0.03) 1508 (153) –4.55 (1.02) 288 1 15 0.7592
Adj-cat 0.11 (0.03) 1725 (173) –5.56 (1.08) 247 1 11 0.7806
Adj-frm 0.10 (0.03) 1735 (186) –5.86 (1.18) 239 1 11.9 0.7821
BC-all 0.51 (0.03) 1248 (13) –0.39 (1.06) 811 1 10 0.8473
BC-last 0.45 (0.05) 1273 (25) –0.68 (0.15) 216 1 10 0.8603
Males Obsv 0.21 (0.06) 1186 (109) –5.77 (2.64) 213 1 11 0.8396
Adj-cat 0.20 (0.06) 1202 (55) –5.25 (1.58) 187 0.5 11 0.5715
Adj-frm 0.21 (0.06) 1186 (47) –5.18 (1.52) 187 0.8 11 0.586
BC-all 0.75 (0.05) 1047 (9) –0.18 (0.07) 601 1 9 0.588
BC-last 0.74 (0.09) 1063 (15) –0.27 (0.15) 157 1 9 0.8168
S. semifasciatus Female Obsv 0.29 (0.06) 896 (22) –4.08 (0.78) 306 0 9 0.555
Adj-cat 0.23 (0.06) 938 (38) –4.64 (1.13) 310 1 9 0.5371
Adj-frm 0.20 (0.06) 929 (41) –5.40 (1.44) 306 0.6 9 0.4937
BC-all 1.04 (0.05) 827 (6) 0.19 (0.04) 923 1 9 0.8243
BC-last 0.99 (0.07) 834 (8) 0.15 (0.07) 289 1 9 0.797
Males Obsv 0.31 (0.04) 840 (13) –3.87 (0.43) 323 0 10 0.7049
Adj-cat 0.34 (0.04) 845 (14) –2.86 (0.43) 325 0.5 10 0.6822
Adj-frm 0.28 (0.04) 847 (16) –3.77 (0.54) 323 0.5 10.6 0.661
BC-all 1.04 (0.05) 781 (5) 0.14 (0.04) 974 1 10 0.8262
[image:5.612.60.555.506.733.2]adjusted methods for both sexes and the observed and category-adjusted methods for female S. semifasciatus. Significant differences in the estimates of K and t0 were observed between the observed and category-adjusted methods, and no significant difference was observed be-tween any of the VBGF parameters for the two adjusted methods for male S. semifasciatus.
Selectivity effects
Comparison of length-at-age between the two back-calculation methods using ANOVA revealed significant differences in mean length-at-age existed for female S. commerson only (F1,7=2.13, P=0.039). Multiple t-tests revealed differences in mean back-calculated length for age-1 female (t245=3.94, P<0.001), and age-1 (t184=2.68, P=0.008), and age-2 (t129=2.38, P<0.019) male S. com-merson.
Substitution of data
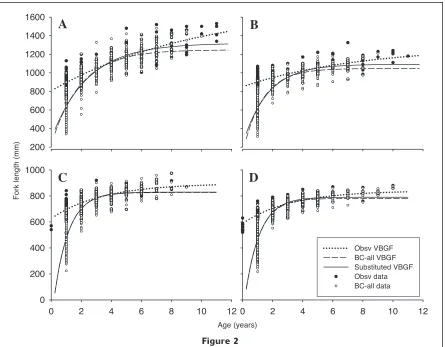
Comparison of length-at-age between the back-calculation to all annuli and observed methods with ANOVA revealed significant differences in mean length-at-age for both species and sexes (S. commerson females: F1,9=32.3, P<0.001, males: F1,8=37.8, P<0.001; S. semifasciatus females: F1,8=52.5, P<0.001, males: F1,9=53.9, P<0.001). For S. commerson, t-tests revealed differences in mean length between back-calculated and observed methods for the first four consecutive ages for both sexes (females age 1: t332=20.39, P<0.001, age 2: t218=5.44, P<0.001, age 3: t132=2.14, P=0.034, age 4: t140=3.54, P<0.001; males age 1: t242=17.72, P<0.001, age 2: t172=8.61, P<0.001, age 3: t104=3.64, P<0.001, age 4: t103=3.94, P<0.001), as well as age 6 for males (t47=2.68, P=0.01). For S. semifasciatus, differences in mean length between back-calculated and observed methods were observed for the first three consecutive ages for females (age 1: t353=16.61, P<0.001, age 2: t329=6.00, P<0.001, age 3: t250=3.37, P<0.001), and the first two consecutive ages for males (age 1: t332=16.5, P<0.001, age 2: t332=5.43, P<0.001). Consequently, sub-stitution of observed and adjusted length-at-age with back-calculated length-at-age was done for the first four ages for male and female S. commerson, the first three ages for female S. semifasciatus, and the first two ages for male S. semifasciatus. Von Bertalanffy growth func-tions were then fitted to the combined data sets (Table 4, Fig. 2).
Growth estimates from substitution displayed a gen-eral pattern of higher estimates of K and lower esti-mates of L∞ than the respective observed or adjusted methods alone, and higher estimates of L∞ than the respective back-calculated methods alone (Table 4). All observed length-at-age data beyond age 8 for S. semifasciatus, and male S. commerson, and age 9 for female S. commerson, had a greater length than the back-calculated and substituted VBGF estimates (Fig. 2). Comparison of the different combinations of sub-stituted methods revealed no significant differences
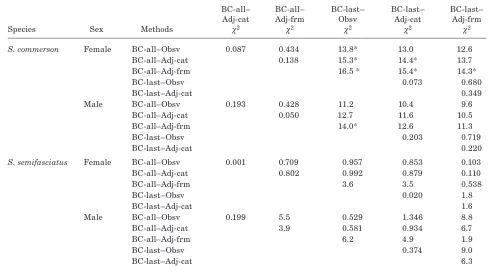
for S. semifasciatus (Table 5). However, there were significant differences between some combinations for S. commerson, mostly for females (Table 5). Notably, all the significant differences occurred between combina-tions with BC-last and BC-all substituted data, with the combination of BC-last and observed data differ-ing to all combinations with BC-all data for female S. commerson.
Discussion
Alternative methods for estimating length-at-age from otoliths resulted in significant differences in estimates of growth. A clear pattern emerged that revealed large differences between the back-calculation (BC-all, BC-last) methods and the observed and adjusted methods (Obsv, Adj-cat, Adj-frm) for both species of mackerel. However, the pattern was more pronounced for S. commerson than for S. semifasciatus, most likely because of the more pronounced effects of selectivity on S. commerson length-at-age data. The method of substituting length-at-age data obtained from observed or adjusted methods with back-calculated length-at-age produced different estimates of growth to the individual methods. This technique proved valuable for providing estimates of population growth, which are likely to be more accurate than those provided with the individual methods alone, particularly in the presence of selec-tivity biases; the technique also improved estimates of length for younger ages over observed or adjusted methods and provided more realistic estimates of mean maximum length than estimates from back-calculation methods alone.
A significant difference in growth between back-calculated length-at-age to all annuli and the last annulus was observed for S. commerson if the result of the overall likelihood ratio test is taken in isola-tion of the multiple comparisons with other methods (i.e., P<0.05), indicating that selectivity bias was in-herent in S. commerson samples. Comparison of the two back-calculation methods for S. commerson indi-cated that fish are fully recruited to the fishery at approximately 900 mm fork length, above which no difference in length-at-age was observed between the back-calculation methods. No significant difference was observed between the two back-calculation methods for S. semifasciatus and therefore indicated that selectivity was not biasing length-at-age data.
Table 4
Von Bertalanffy growth function parameter estimates (growth coefficient [K], theoretical maximum length [L∞], and theoretical age where length is equal to zero [t0],± standard error), sample numbers (n), age ranges, and adjusted R2 values from different combinations of substituted methods (observed [Obsv], category adjusted [Adj-cat], formula adjusted [Adj-frm], back-calculation to all annuli [BC-all], and back-calculation to the last annulus only [BC-last]) for estimating length-at-age for Scomberomorus
commerson and S. semifasciatus.
Species Sex BC data Method K L∞ (mm) t0 (years) n Min age Max age R2
adj
S. commerson Female BC-all Obsv 0.41 (0.02) 1319 (17) –0.60 (0.07) 741 1 15.0 0.84 BC-all Adj-cat 0.43 (0.02) 1304 (16) –0.55 (0.07) 747 1 11.0 0.84 BC-all Adj-frm 0.44 (0.02) 1295 (15) –0.53 (0.07) 750 1 11.9 0.84 BC-last Obsv 0.29 (0.03) 1411 (33) –1.30 (0.19) 263 1 15.0 0.87 BC-last Adj-cat 0.31 (0.03) 1383 (29) –1.18 (0.17) 268 1 11.0 0.87 BC-last Adj-frm 0.32 (0.03) 1366 (26) –1.14 (0.17) 271 1 11.9 0.87
Male BC-all Obsv 0.60 (0.04) 1092 (12) –0.39 (0.08) 562 1 11.0 0.81
BC-all Adj-cat 0.63 (0.04) 1084 (12) –0.35 (0.08) 561 1 11.0 0.81 BC-all Adj-frm 0.64 (0.04) 1081 (11) –0.34 (0.07) 573 1 11.0 0.82 BC-last Obsv 0.54 (0.06) 1118 (15) –0.62 (0.17) 191 1 11.0 0.84 BC-Last Adj-cat 0.58 (0.06) 1108 (14) –0.55 (0.16) 190 1 11.0 0.84 BC-Last Adj-frm 0.57 (0.06) 1103 (13) –0.57 (0.15) 202 1 11.0 0.84
S. semifasciatus Female BC-All Obsv 1.02 (0.06) 830 (7) 0.18 (0.04) 828 1 9.0 0.81 BC-All Adj-cat 1.02 (0.05) 830 (7) 0.18 (0.04) 846 1 9.0 0.82 BC-All Adj-frm 1.08 (0.06) 821 (6) 0.21 (0.04) 894 1 9.0 0.82 BC-Last Obsv 0.95 (0.07) 841 (8) 0.12 (0.07) 295 1 9.0 0.80 BC-Last Adj-cat 0.95 (0.07) 840 (7) 0.12 (0.07) 312 1 9.0 0.80 BC-Last Adj-frm 1.02 (0.07) 828 (6) 0.17 (0.06) 359 1 9.0 0.79
Male BC-All Obsv 1.03 (0.06) 790 (7) 0.14 (0.04) 748 1 10.0 0.80
BC-All Adj-cat 1.04 (0.06) 787 (7) 0.15 (0.04) 774 1 10.0 0.80 BC-All Adj-frm 1.13 (0.06) 771 (6) 0.18 (0.04) 825 1 10.6 0.79 BC-Last Obsv 0.96 (0.06) 794 (6) 0.08 (0.06) 306 1 10.0 0.83 BC-Last Adj-cat 0.96 (0.06) 791 (6) 0.07 (0.06) 332 1 10.0 0.83 BC-Last Adj-frm 1.00 (0.06) 776 (5) 0.07 (0.06) 383 1 10.6 0.78
Observed length-at-age, although being relatively easy to obtain compared to other data, can have the most aging error given that any growth beyond a whole year is not accounted for. The magnitude and frequency of aging error has been shown to be uniform across all ages for S. semifasciatus (Marriott et al., 2010). However, given the rapid growth of such species in the first few years, aging error for younger ages will have more influence on growth estimates than aging error in older ages. Although this problem can be exacerbated for fast growing species such as S. commerson and S. semifasciatus, uniform aging error across age classes may be a lesser issue for growth estimation of long-lived, slow growing fish, and observed length-at-age could be more accurate if samples are collected after the period of annuli formation and the opaque increment at the edge is included in age estimates.
Adjustment methods for determining length-at-age theoretically provide a more accurate estimate of age than observed length-at-age by accounting for growth on a finer temporal scale, especially if the spawning period and period of annuli formation is discrete (e.g., DeVries and Grimes, 1997). The formula-adjustment
method, however, is useful only if population-specific spawning and annuli formation periods are known for a given species, and it is less useful if the species has a protracted spawning period or if the timing of annuli formation varies (e.g., Williams et al., 2005). The category-adjustment method is useful for assigning ages to cohorts for use in assessment models (Begg et al.4)
as well as for estimating growth (Shepard et al., 2010). Back-calculation is useful for estimating selectivity effects (Campana, 1990; Lucena and O’Brien, 2001; Ballagh et al., 2006), providing length-at-age estimates for younger fish that may not be seen in fishery-dependent samples (Campana, 2001; Lopez-Abellan et al., 2008), providing comparisons between different populations (Johnson et al., 1983; Fable et al., 1987; Ballagh et al., 2006), and assessing individual growth variability (Fossen et al., 1999; Pilling et al., 2002).
Figure 2
Von Bertalanffy growth functions (VBGF) fitted to observed (Obsv), back-calculated to all annuli (BC-all), and substituted (Obsv and BC-all) length-at-age data for (A) female, and (B) male Scomberomorus
com-merson, and (C) female, and (D) male Scomberomorus semifasciatus.
0 2 4 6 8 10 12
200 400 600 800 1000 1200 1400 1600
Obsv VBGF BC-all VBGF Substituted VBGF Obsv data BC-all data
0 2 4 6 8 10 12
0 200 400 600 800 1000
A
D
C
B
Fork length (mm)
Age (years)
However, this method can be influenced by statistical dependency whereby estimated lengths at younger ages are dependent on lengths from older ages through the back-calculation process and are therefore suscepti-ble to bias in the presence of size-selective mortality (Vaughan and Burton, 1994; Pilling et al., 2002). Other drawbacks of back-calculation include the specialized equipment and software needed and the significant time required to obtain data.
We demonstrated that although back-calculation was effective for estimating length-at-age for younger ages in the presence of selectivity within a fishery that selects for the faster growing younger fish, it appears to underestimate mean maximum length (L∞). This finding is shown by observed length-at-age data being consistently higher than the back-calculated VBGF for older age classes and is subject to the assumption that there is little or no selectivity acting on older fish. The underestimation of back-calculated mean maximum length is likely due to three effects: smaller length-at-age for younger fish; weighting of data in younger ages; and the negative correlation between the VBGF parameters of L∞ and K. Back-calculating to all annuli
results in a disproportionate amount of data for young ages which, depending on the growth estimation method used, gives more weight to younger ages when fitting a VBGF. Because the VBGF parameters L∞ and K have been shown to be negatively correlated (Pilling et al., 2002), increasing the estimate of K through smaller length-at-age for younger ages, or a weighting of data in younger ages, will inevitably reduce the estimate of L∞, and thus underestimate average maximum length. One option for overcoming this problem could be to constrain L∞ to the largest observed length, although some prior knowledge of the size-selectivity pattern of sampling gears is required to make an informed decision to constrain parameters (Gwinn et al., 2010),
Table 5
Chi-squared values for overall likelihood ratio tests between growth estimates from different combinations of substituted meth-ods (observed [Obsv], category adjusted [Adj-cat], formula adjusted [Adj-frm], calculation to all annuli [BC-all], and back-calculation to the last annulus only [BC-last]) of estimating length-at-age for Scomberomorus commerson and S. semifasciatus (* indicates significant difference at P<0.0033, a was Bonfferoni adjusted for multiple comparisons, df=3).
BC-all– BC-all– BC-last– BC-last– BC-last–
Adj-cat Adj-frm Obsv Adj-cat Adj-frm
Species Sex Methods c2 c2 c2 c2 c2
S. commerson Female BC-all–Obsv 0.087 0.434 13.8* 13.0 12.6 BC-all–Adj-cat 0.138 15.3* 14.4* 13.7
BC-all–Adj-frm 16.5 * 15.4* 14.3*
BC-last–Obsv 0.073 0.680
BC-last–Adj-cat 0.349
Male BC-all–Obsv 0.193 0.428 11.2 10.4 9.6
BC-all–Adj-cat 0.050 12.7 11.6 10.5
BC-all–Adj-frm 14.0* 12.6 11.3
BC-last–Obsv 0.203 0.719
BC-last–Adj-cat 0.220
S. semifasciatus Female BC-all–Obsv 0.001 0.709 0.957 0.853 0.103 BC-all–Adj-cat 0.802 0.992 0.879 0.110
BC-all–Adj-frm 3.6 3.5 0.538
BC-last–Obsv 0.020 1.8
BC-last–Adj-cat 1.6
Male BC-all–Obsv 0.199 5.5 0.529 1.346 8.8
BC-all–Adj-cat 3.9 0.581 0.934 6.7
BC-all–Adj-frm 6.2 4.9 1.9
BC-last–Obsv 0.374 9.0
BC-last–Adj-cat 6.3
years (Gwinn et al., 2010). Recently, several different methods for reducing bias in growth estimates from length-at-age data from size-selective samples have been proposed, including multinomial estimation models (Taylor et al., 2005), multigrowth model inference (Thorson and Simpfendorfer, 2009) and biologically based von Bertalanffy fitting procedures (Gwinn et al., 2010).
Substitution was shown to be a potentially useful method for providing more accurate estimates of popu-lation growth than the individual methods alone in the presence of selectivity pressure for faster grow-ing young fish. Given that a significant difference in growth was observed between data substituted with the two different back-calculation methods for S. com-merson, it is presumed that back-calculating data to all annuli would be the most appropriate back-calculation method to use in substitution in this instance given the selectivity bias observed in the young age classes. We therefore recommend that back-calculated length-at-age data from all annuli for young age classes be combined with observed or adjusted length-at-age data from older age classes to estimate population growth in the pres-ence of selectivity favoring faster growing younger fish. Further studies should be undertaken to investigate the appropriateness of different methods for length-at-age
determination and the effectiveness of substitution for species with different growth characteristics and under different selectivity regimes of fisheries.
Acknowledgments
The authors would like to thank members of the Fish-ing and Fisheries Research Centre for their support. The Fisheries Research and Development Corporation (projects 2001/019 and 2005/010), the School of Earth and Environmental Sciences of James Cook University, and the CRC Reef Research Centre provided funding and support for this study. This manuscript was greatly improved by thorough reviews from anonymous reviewers.
Literature cited
Ballagh, A. C., G. A. Begg, A. Mapleston, and A. Tobin. 2006. Growth trends of Queensland east coast Spanish
mackerel (Scomberomorus commerson) from otolith back-calculations. Mar. Freshw. Res. 57:383–393. Begg, G. A., S. E. Campana, A. J. Fowler, and I. M. Suthers.
Beverton, R. J. H., and S. J. Holt.
1957. On the dynamics of exploited fish populations, 533 p. Ministry of Agriculture, Fisheries and Food, London. Campana, S. E.
1990. How reliable are growth back-calculations based on otoliths? Can. J. Fish. Aquat. Sci. 47:2219–2227. 2001. Accuracy, precision and quality control in age
determination, including a review of the use and abuse of age validation methods. J. Fish Biol. 59:197–242. 2005. Otolith science entering the 21st century. Mar.
Freshw. Res. 56:485–495. DeVries, D. A., and C. B. Grimes.
1997. Spatial and temporal variation in age and growth of king mackerel, Scomberomorus cavalla, 1977– 1992. Fish. Bull. 95:694–708.
Fable, W. A. J., A. G. Johnson, and L. E. Barger.
1987. Age and growth of Spanish mackerel,
Scomb-eromorus maculatus, from Florida and the Gulf of
Mexico. Fish. Bull. 85:777–783. Fablet, R.
2006. Semi-local extraction of ring structures in images of biological hard tissues: application to the Bayesian interpretation of fish otoliths for age and growth esti-mation. Can. J. Fish. Aquat. Sci. 63:1414–1428. Fossen, I., O. T. Albert, and E. M. Nilssen.
1999. Back-calculated individual growth of long rough dab (Hippoglossoides platessoides) in the Barents Sea. ICES J. Mar. Sci. 56:689–696.
Francis, R. I. C. C.
1988. Are growth parameters estimated from tagging and age-length data comparable? Can. J. Fish. Aquat. Sci. 45:936–942.
1990. Back-calculation of fish length: a critical review. J. Fish Biol. 36:883–902.
Francis, R. I. C. C., S. J. Harley, S. E. Campana, and P. Doering-Arjes.
2005. Use of otolith weight in length-mediated estimation of proportions at age. Mar. Freshw. Res. 56:735–743. Francis, R. I. C. C., L. J. Paul, and K. P. Mulligan.
1992. Aging of adult snapper (Pagrus auratus) from otolith annual ring counts: validation by tagging and oxytetracycline injection. Mar. Freshw. Res. 43:1069– 1089.
Grudtsev, M. E., and L. I. Korolevich.
1986. Studies of frigate tuna Auxis thazard (Lacepede) age and growth in the eastern part of the equatorial Atlantic. Coll. Vol. Sci. Pap. ICCAT 25:269–274. Gulland, J. A.
1988. Fish population dynamics: the implications for management, 422 p. John Wiley and Sons Ltd., New York.
Gwinn, D. C., M. S. Allen, and M. W. Rogers.
2010. Evaluation of procedures to reduce bias in fish growth parameter estimates resulting from size-selective sampling. Fish. Res. 105:75–79.
Haddon, M.
2001. Modelling and quantitative methods in fisheries, 406 p. Chapman and Hall/CRC Press, Boca Raton, FL. Johnson, A. G., W. A. J. Fable, M. L. Williams, and L. E. Barger. 1983. Age, growth and mortality of King mackerel,
Scomberomorus cavalla, from the southeastern United
States. Fish. Bull. 81:97–106. Katsanevakis, S., and C. D. Maravelias.
2008. Modelling fish growth: multi-model inference as a better alternative to a priori using von Bertalanffy equation. Fish Fish. 9:178–187.
Kimura, D. K.
1980. Likelihood methods for the von Bertalanffy growth curve. Fish. Bull. 77:765–776.
Labelle, M., J. Hampton, K. Bailey, T. Murray, D. A. Fournier, and J. R. Sibert.
1993. Determination of age and growth of South Pacific albacore (Thunnus alalunga) using three methodologies. Fish. Bull. 91:649–663.
Lopez-Abellan, L. J., M. T. G. Santamaria, and J. F. Gonzalez.
2008. Approach to aging and growth back-calculation based on the otolith of the southern boarf ish Pseudopentaceros richardsoni (Smith, 1844) from the south-west Indian Ocean seamounts. Mar. Freshw. Res. 59:269–278.
Lou, D. C., B. D. Mapstone, G. R. Russ, C. R. Davies, and G. A. Begg.
2005. Using otolith weight-age relationships to predict age-based metrics of coral reef fish populations at different spatial scales. Fish. Res. 71:279–294. Lucena, F. M., and C. M. O’Brien.
2001. Effects of gear selectivity and different calculation methods on estimating growth parameters of bluefish,
Pomatomus saltatrix (Pisces: Pomatomidae), from
southern Brazil. Fish. Bull. 99:432–442.
Marriott, R., B. D. Mapstone, A. C. Ballagh, L. M. Currey, A. Penny, A. J. Williams, G. Jackson, D. Lou, A. J. Mapleston, N. D. C. Jarvis, I. S. Keay, and S. J. Newman.
2010. Accepting final counts from repeat readings of otoliths: should a common criterion apply to the age estimation of fish? Mar. Freshw. Res. 61:1171–1196. McPherson, G. R.
1992. Age and growth of the narrow-barred Spanish mackerel (Scomberomorus commerson Lacepede, 1800) in north-eastern Queensland waters. Mar. Freshw. Res. 43:1269–1282.
1993. Reproductive biology of the narrow barred Spanish mackerel (Scomberomorus commerson Lacepede, 1800) in Queensland waters. Asian Fish. Sci. 6:169–182. Pilling, G. M., G. P. Kirkwood, and S. G. Walker.
2002. An improved method for estimating individual growth variability in fish, and the correlation between von Bertalanffy growth parameters. Can. J. Fish. Aquat. Sci. 59:424–432.
Rahikainen, M., and R. L. Stephenson.
2004. Consequences of growth variation in northern Baltic herring for assessment and management. ICES J. Mar. Sci. 61:338–350.
Ricker, W. E.
1969. Effects of size-selective mortality and sampling bias on estimates of growth, mortality, production and yield. J. Fish. Res. Board Can. 26:479–541.
1979. Growth rates and models. In Fish physiology (W. S. Hoar, D. J. Randall, and J. R. Brett, eds.), p. 677–743. Academic Press, Orlando, Fla.
Schnute, J.
1981. A versatile growth model with statistically stable parameters. Can. J. Fish. Aquat. Sci. 38:1128–1140. Secor, D. H., and J. M. Dean.
1992. Comparison of otolith-based back-calculation methods to determine individual growth histories of larval striped bass, Morone saxatilis. Can. J. Fish. Aquat. Sci. 49:1439–1454.
Shafi, M., and B. M. Jasim.
1982. Some aspects of the biology of a cyprinid, Aspius
Shepard, K. E., W. F. Patterson, D. A. Devries, and M. Ortiz. 2010. Contemporary versus historical estimates of king
mackerel (Scomberomorus cavalla) age and growth in the U.S. Atlantic Ocean and Gulf of Mexico. Bull. Mar. Sci. 86:515–532.
Steward, C. A., K. D. DeMaria, and J. M. Shenker.
2009. Using otolith morphometrics to quickly and inexpensively predict age in the gray angelfish (Pomacanthus arcuatus). Fish. Res. 99:123–129. Taylor, N. G., C. J. Walters, and S. J. D. Martell.
2005. A new likelihood for simultaneously estimating von Bertalanffy growth parameters, gear selectivity, and natural and fishing mortality. Can. J. Fish. Aquat. Sci. 62:215–223.
Thorson, J. T., and C. A. Simpfendorfer.
2009. Gear selectivity and sample size effects on growth
curve selection in shark age and growth studies. Fish. Res. 98:75–84.
Vaughan, D. S., and M. L. Burton.
1994. Estimation of Von Bertalanffy growth parameters in the presence of size-selective mortality: a simulated example with red grouper. Trans. Am. Fish. Soc. 123:1–8.
Williams, A. J., L. M. Currey, G. A. Begg, C. D. Murchie, and A. C. Ballagh.
2008. Population biology of coral trout species in eastern Torres Strait: Implications for f ishery management. Cont. Shelf Res. 28:2129–2142.
Williams, A. J., C. R. Davies, and B. D. Mapstone.