To Understand the Control of Viral RNA Synthesis
Frank S. Heldt,aTimo Frensing,aand Udo Reichla,b
Bioprocess Engineering Group, Max Planck Institute for Dynamics of Complex Technical Systems, Magdeburg, Germany,aand Chair of Bioprocess Engineering,
Otto-von-Guericke University Magdeburg, Magdeburg, Germanyb
Influenza viruses transcribe and replicate their negative-sense RNA genome inside the nucleus of host cells via three viral RNA species. In the course of an infection, these RNAs show distinct dynamics, suggesting that differential regulation takes place. To investigate this regulation in a systematic way, we developed a mathematical model of influenza virus infection at the level of a single mammalian cell. It accounts for key steps of the viral life cycle, from virus entry to progeny virion release, while focusing in particular on the molecular mechanisms that control viral transcription and replication. We therefore explicitly consider the nuclear export of viral genome copies (vRNPs) and a recent hypothesis proposing that replicative intermediates (cRNA) are sta-bilized by the viral polymerase complex and the nucleoprotein (NP). Together, both mechanisms allow the model to capture a variety of published data sets at an unprecedented level of detail. Our findings provide theoretical support for an early regulation of replication by cRNA stabilization. However, they also suggest that the matrix protein 1 (M1) controls viral RNA levels in the late phase of infection as part of its role during the nuclear export of viral genome copies. Moreover, simulations show an accu-mulation of viral proteins and RNA toward the end of infection, indicating that transport processes or budding limits virion re-lease. Thus, our mathematical model provides an ideal platform for a systematic and quantitative evaluation of influenza virus replication and its complex regulation.
I
nfluenza A viruses are enveloped, single-stranded RNA viruseswith a segmented genome comprising eight viral RNAs (vRNAs)
of negative polarity (33). Generally, these vRNAs form viral
ribo-nucleoproteins (vRNPs) by associating with the viral RNA-depen-dent RNA polymerase complex (RdRp), consisting of three sub-units (PB1, PB2, and PA), and with multiple monomers of the viral nucleoprotein (NP). To replicate, an infectious virus particle
or virion, which contains a complete set of eight vRNPs (43),
enters a host cell and hijacks its biosynthetic machinery to accom-plish viral protein and RNA synthesis and to assemble progeny virions, a process referred to as the viral life cycle.
The life cycle of influenza viruses (Fig. 1) begins when virions
bind to sialic acid residues on the cell surface, allowing them to
enter the host cell via receptor-mediated endocytosis (37). Once
inside the cell, the virus is trafficked through the endosomal net-work until acidification in late endosomes triggers the fusion of the viral envelope with the endosomal membrane. At the same time, vRNPs undergo uncoating, i.e., dissociate from matrix pro-tein 1 (M1), which enables their release into the cytoplasm and
import into the nucleus (9,36). Unlike most other RNA viruses,
the influenza virus replicates inside the nucleus of host cells. There, each vRNP acts as an independent functional unit that directs the synthesis of two positive-sense RNAs by using its vRNA as a template. First, viral messenger RNAs (mRNAs) are tran-scribed through a mechanism primed by capped RNA fragments that are cleaved from host pre-mRNAs. Since viral transcription
terminates upstream of the vRNA 5=end, the resulting mRNAs are
incomplete copies of the genome and thus cannot serve as the templates for replication. Hence, a second positive-strand, full-length RNA is synthesized, the cRNA. In contrast to mRNA
tran-scription, the replication of cRNAs is achieved viade novo
initia-tion. Nascent cRNAs are encapsidated by newly synthesized NP and viral polymerases, leading to the formation of cRNPs.
Simi-larly,de novo-initiated synthesis from cRNPs generates vRNAs,
which form progeny vRNPs. For incorporation into new virions, vRNPs have to leave the nucleus during the late phase of infection. Binding of M1 and of the nuclear export protein (NEP) thus
me-diates their export (1,35,45). Cytoplasmic vRNPs then travel to
the plasma membrane, where virus assembly and budding take place.
The regulation of viral RNA synthesis and especially the mech-anism which controls whether vRNPs engage in the transcription of viral mRNAs or the replication of cRNAs is a matter of contro-versy. Early studies of virus-infected cells showed that replication requires an initial round of transcription and viral protein
expres-sion (22). It has since been well established that the NP protein in
particular is an essential factor for cRNA accumulation (6,38,47).
Based on these findings, NP was proposed to cause a switch in the activity of vRNPs from early transcription to late replication by interacting with the vRNA template or the viral polymerase
(re-viewed in reference47). Other viral or host factors as well as small
viral RNAs (22- to 27-nucleotide [nt] fragments of the vRNAs) also have been proposed to contribute to this switch (reviewed in
reference49). However, the so-called switching hypothesis was
recently challenged byin vitroexperiments showing full-length
cRNA synthesis in the absence of free NP (58). The authors
con-cluded that vRNPs may produce both mRNA and cRNA from an early time point, but cRNA is degraded by host nucleases unless
NP and viral polymerases stabilize it (61). Hence, NP would not
induce a switch but merely act as a cofactor during cRNA
encap-Received12 January 2012 Accepted7 May 2012
Published ahead of print16 May 2012
Address correspondence to Frank S. Heldt, heldt@mpi-magdeburg.mpg.de.
Copyright © 2012, American Society for Microbiology. All Rights Reserved.
doi:10.1128/JVI.00080-12
on November 7, 2019 by guest
http://jvi.asm.org/
sidation. This hypothesis is consistent with other observations showing that the relative rate of genome replication is
indepen-dent of the abundance of NP (40), and that the RNA-binding
activity of NP is necessary for cRNA accumulation (62). However,
definite proof is still lacking. Besides the differential regulation of mRNA and cRNA synthesis during the early phase of infection, both species cease to accumulate toward the late phase. In
con-trast, vRNAs are continuously synthesized (21,31,53). This
im-plies distinct control mechanisms for positive- and negative-strand RNA synthesis. Although the molecular basis for this control is uncertain, nuclear export could be involved, since vRNPs, which leave the nucleus, act as templates for mRNA and cRNA, while cRNPs, which remain nuclear, synthesize vRNA. The nuclear export of vRNPs depends on their interaction with M1
proteins (35), and in a cell-free system M1 also inhibited the
ac-tivity of vRNPs (20,64,69). It was thus proposed that M1 binding
inactivates progeny vRNPs, and that these inactivated vRNPs can
leave the nucleus (reviewed in reference41). Therefore, M1
pro-teins may regulate viral RNA synthesis as part of their role during nuclear export.
To elucidate the regulation of influenza virus RNA synthesis in a systematic way, we propose a mathematical model of the viral life cycle. In the past, modeling has provided valuable insights into the
intracellular replication of eukaryotic viruses (10,11,23,34,48).
For influenza virus, such a model was previously developed by our group to assess the amount of cellular resources that are con-sumed by virus replication during cell culture-based vaccine
pro-duction (55). However, this model was based on qualitative
ob-servations and literature parameters, and due to its size and the lack of data, it was not possible to validate the simulations against experiments. We therefore refined the approach by reducing the original set of equations and used a variety of data sets from the literature to identify key parameters of virus infection. We also considered cRNA stabilization and a more detailed description of nuclear export to investigate how these mechanisms affect the dynamics of viral RNA synthesis. In the following, we first intro-duce our mathematical framework before focusing on the predic-tions for virus entry and the transition from transcription to rep-lication. We then highlight how M1 proteins affect viral RNA
synthesis, and eventually we combine all aspects to draw conclu-sions about virus particle release.
MATERIALS AND METHODS
The main features of influenza virus replication are shown inFig. 1and provide the basis for our model. In the following paragraphs, we derive a set of ordinary differential equations that describe virus entry, viral repli-cation, transcription and protein synthesis, and virus release.
Virus entry.First, virions bind to membrane receptors and enter the cell via receptor-mediated endocytosis. Nunes-Correia et al. proposed a kinetic model for these processes including two different binding sites, high-affinity and low-affinity sites, which might correspond to sialic acid-containing ligands and less specific interactions, respectively (44). We make minor modifications to this model to account for the infection of a single cell and add an equation for virions in early endosomes.
dVEx
dt ⫽khiDisVhiAtt⫹kloDisVloAtt⫺
共
khiAttBhi⫹kloAttBlo兲
VEx, (1)withBn ⫽ Bntot⫺VnAtt, n僆
兵
hi, lo其
, (2)dVnAtt
dt ⫽knAttBnVEx ⫺
共
knDis⫹kEn兲
VnAtt, (3)dVEn dt ⫽ k
En
共
V hi Att⫹Vlo
Att
兲
⫺共
kFus⫹k Ven Deg兲
VEn,withknDis ⫽ kn Att
knEq andkVen
Deg ⫽ 1⫺FFus FFus
kFus, 0⬍FFusⱕ1, (4)
whereVEx,V n
Att, andVEnare the numbers of virions in the extracellular
medium, virions attached to binding sites of typen(hi, high affinity; lo, low affinity), and virions in early endosomes, respectively. Here,VEx cor-responds to the multiplicity of infection (MOI), i.e., the number of infec-tious virus particles per cell. These virions attach with rateknAttto free binding sitesBn, of which there areBntotin total. By calculatingBnfrom the conservation equation (equation 2), we follow the formalism of Nunes-Correia and coworkers (44). Note that this implies a fast recycling of receptors as binding sites become vacant when virions enter the cell. Also, in this notation each virion occupies one binding site that may correspond to multiple receptors, as virus-cell binding involves multivalent bond for-mation (18). Once attached, virions can either dissociate from the cell with rateknDis, which follows directly from the equilibrium constant,knEq, or enter the cell with the endocytosis rate,kEn(equation 3). We assume thatkEnis the same for both binding sites, as did Nunes-Correia and coworkers. Fusion of virions in endosomes occurs with ratekFus, which includes the trafficking and acidification of early endosomes as well as the fusion of the viral envelope with the endosomal membrane. It has been shown that only a fraction of virions penetrate into the cytoplasm, while others presumably fail to fuse (32,35). We therefore introduce the frac-tion of fusion-competent virions,FFus, and calculate the degradation rate of virions in lysosomes,kVenDeg, accordingly. For model fits to experimental data on fusion, the total number of fused virions can be obtained by integratingkFusVEnover time.
Viral replication.Following fusion, influenza viruses release parental vRNPs into the cytoplasm. These vRNPs enter the nucleus (9,36), where they start synthesizing mRNA and, according to the stabilization hypoth-esis, also cRNA (58). However, nascent cRNA may be rapidly degraded by cellular nucleases unless it is stabilized in cRNP complexes (61). We as-sume that vRNP formation stabilizes nascent vRNA in a similar fashion. For the majority of vRNAs and cRNAs, different genome segments show similar levels throughout an infection (21,31). Hence, we do not explicitly distinguish between individual segments but rather consider their total number per cell. For obtaining the abundance of an arbitrary segment, these numbers can be divided by eight, which we did when fitting the model to measurements of individual genome segments. Later in infec-tion, M1 and NEP proteins enter the nucleus and trigger the nuclear export of vRNPs (1,45). Since M1 binding to vRNPs inhibits their
trans-FIG 1Scheme of the influenza virus life cycle. For the sake of simplicity, only one vRNP in a virus particle is depicted, and nonstructural proteins are omit-ted. Solid arrows represent synthesis or protein binding. Dashed arrows indi-cate transport processes. Different steps are assigned by numbers (see the text for details): 1, attachment; 2, endocytosis; 3, fusion in late endosomes; 4, nu-clear import; 5, transcription; 6, replication (cRNA synthesis); 7, protein trans-lation; 8, cRNA encapsidation; 9, replication (vRNA synthesis); 10, vRNA encapsidation; 11, M1 and NEP binding; 12, nuclear export; and 13, virus assembly and budding.
on November 7, 2019 by guest
http://jvi.asm.org/
[image:2.585.44.285.67.187.2]criptase activity (20,64,69), M1-vRNP complexes in the model are no longer available as the templates for RNA synthesis. Thus, virus replica-tion is described by the following equareplica-tions.
dVpcyt dt ⫽8k
FusVEn⫺kImpVpcyt, (5)
dVpnuc dt ⫽k
ImpVpcyt⫹k NP BindP
NPRRdRpV ⫺
共
kM1BindPM1⫹kRnpDeg兲
Vpnuc, (6)dRC dt ⫽kC
SynVpnuc⫺k RdRp BindP
RdRpRC⫺kRDegRC, (7)
dRV dt ⫽kV
SynCp⫺k RdRp BindP
RdRpRV⫺kRDegRV, (8)
dRRdRpC dt ⫽kRdRp
BindP
RdRpRC⫺kNPBindPNPRRdRpC ⫺kRRdRpDeg RRdRpC , (9)
dRRdRpV
dt ⫽kRdRpBindPRdRpRV⫺kNPBindPNPRRdRpV ⫺kRRdRpDeg RRdRpV , (10)
dCp dt ⫽kNP
BindP
NPRRdRpC ⫺kRnpDegCp, (11)
dVpM1nuc
dt ⫽kM1BindPM1Vpnuc⫺
共
kExpPNEP⫹ kRnpDeg兲
VpM1nuc, (12)dVpM1cyt dt ⫽k
ExpP
NEPVpM1nuc⫺8rRel⫺kRnpDegVpM1cyt. (13)
Each fused virion releases a complete set of eight vRNPs into the cyto-plasm (Vpcyt), which enter the nucleus with ratekImp(5). Nuclear vRNPs (Vpnuc) then synthesize mRNA, which is described in the next paragraph, and cRNA (RC) with ratek
C
Syn(equation 7). Similarly, the synthesis of
vRNA (RV) with ratek V
Synis directed by cRNPs (Cp) (equation 8). We
assume that both types of nascent RNA are degraded by nucleases with ratekRDegor bind to viral polymerases (PRdRp) with ratekRdRpBind. The result-ing complexes of the viral polymerase with cRNA (RRdRpC ) or vRNA (RRdRpV ) are only partially stabilized and thus degraded with the rate
kRDegRdrp, which is lower than that of nascent RNA. Binding of NP (PNP) with ratekNPBindthen leads to cRNP and vRNP formation, respectively. We as-sume that RNPs decay at a low rate,kRnpDeg, as the RNA in vRNPs is still sensitive to digestion in the presence of an excess of RNases (12). Note that this decay was omitted for incoming cytoplasmic vRNPs (equation 5). During the late phase of infection, M1 proteins (PM1Bind) can bind to vRNPs with ratekM1Bindto form M1-vRNP complexes in the nucleus (VpM1nuc). Sub-sequent association of NEP (PNEP) facilitates the nuclear export, which is combined in the ratekExp, assuming that the actual transport process is fast. Cytoplasmic NEP-M1-vRNP complexes (VpM1cyt) are then transported to the plasma membrane where virus budding takes place. We lump all processes of virus assembly and budding into the virus release rate,rRel, which is described later.
Viral transcription and protein synthesis.Viral transcription takes place in the nucleus, whereas translation occurs at cytoplasmic ribosomes. However, since it has been shown that the nuclear export of mRNAs is fast (15), we assume that newly synthesized mRNAs are readily available for translation. In contrast to vRNA and cRNA, our model explicitly accounts for the mRNAs of different genome segments, since measurements reveal significant differences in their levels during infection (21,31). Protein synthesis in simulations is directly proportional to these mRNA levels, as has been found experimentally (26). For simplicity, we only consider the net production of all structural proteins, neglecting their degradation, and assume that protein amounts in different cellular compartments are in equilibrium. As more data become available, these assumptions can be dropped in favor of a more complex model. Equations for mRNAs and proteins are the following.
dRiM dt ⫽
kMSyn Li
Vpnuc
8 ⫺kMDegRiM, i⫽1, ... , 8, (14)
dPPB1 dt ⫽
kPSyn
DRibR2M⫺kRdRpPpB1PpB2PpA, (15)
dPPB2 dt ⫽
kPSyn DRib
R1M⫺kRdRpP
pB1PpB2PpA, (16)
dPPA dt ⫽
kPSyn DRib
R3M⫺kRdRpP
pB1PpB2PpA, (17)
dPRdRp dt ⫽k
RdRpP
PB1PPB2PPA⫺kRdRpBindPRdRp
共
RV⫹RC兲
⫺共
NPRdRp⫺8兲
r Rel,(18)
dPNP dt ⫽
kPSyn DRib
R5M⫺ LV NNPNuckNP
BindP
NP
共
RRdRpV ⫹RRdRpC兲
⫺
冉
NPNP⫺8 LV NNPNuc冊
rRel, (19)
dPM1 dt ⫽
kPSyn DRib
共
1⫺FSpl7兲R7M⫺ LV NM1NuckM1
BindP M1Vpnuc
⫺
冉
NPM1⫺8 LV NM1Nuc冊
rRel, (20)
dPNEP dt ⫽
kPSyn
DRibFSpl8R8M⫺ LV NNEPNuck
ExpP
NEPVpM1nuc⫺
冉
NPNEP⫺8 LV NNEPNuc冊
rRel,
(21)
dPHA dt ⫽
kpSyn
DRibR4M⫺NPHAr
Rel, (22)
dPNA dt ⫽
kpSyn
DRibR6M⫺NPNAr
Rel, (23)
dPM2 dt ⫽
kpSyn DRib
FSpl7R7M⫺NPM2rRel, (24)
whereRiMandPjare the numbers of mRNAs of segmentiand of proteins of typej, respectively. Experiments of Hatada et al. show a negative cor-relation between the length of an mRNA and its level, i.e., smaller mRNAs are more abundant (21). Because we assume that all mRNAs are degraded with the same rate,kMDeg, we use a length-dependent mRNA synthesis rate, kMSyn, and scale it withLi, denoting the length of segmenti’s unspliced mRNA (equation 14). This is in agreement with a transcription mecha-nism in which only the resident polymerase complex of a vRNP synthe-sizes mRNAs incis(27) and elongation is the rate-limiting step. We di-vided Vpnucby 8, as only this fraction of vRNPs encodes a specific genome segment and its mRNA. To increase protein translation, multiple ribo-somes can bind to a single mRNA, forming polyribo-somes. This is considered by using the length-dependent translation rate,kPSyn(56), and the average distance between two adjacent ribosomes on an mRNA,DRib(4). Hence, protein production is proportional to the speed with which ribosomes cover the distance (DRib). New viral polymerases (PRdRp) form from the three subunits with ratekRdRpand bind to vRNAs and cRNAs with rate
kRdRpBind (equation 18). Measurements show that the number of polymerases in one virus particle (NPRdRp) is greater than the eight polymerases in a complete set of vRNPs (33). Therefore, the remaining amount is assumed to leave the cell during budding. Similar terms are considered for NP, M1, and NEP, withNPjdenoting the number of proteins of typejin one virion. To calculate the amount of NP, M1, and NEP bound in one NEP-M1-vRNP complex, we use the average length of a vRNA (LV) and the number of nucleotides bound by one protein,NNPnuc,NM1nuc(63), andNNEPnuc. The surface proteins hemagglutinin (PHA), neuraminidase (PNA), and matrix protein 2 (PM2) only decrease due to budding. We consider the splicing of mRNAs from segments 7 and 8 by introducing the factorsFSpl7and
on November 7, 2019 by guest
http://jvi.asm.org/
FSpl8(50), which represent the fraction of mRNAs that encode M2 and NEP, respectively.
Virus release.When vRNPs and viral proteins reach the plasma mem-brane, progeny virions are assembled and released from the cell. Since the precise mechanism is still not well understood (25), we do not model budding in detail but rather use a simple description:
dVRel dt ⫽r
Rel⫽kRelVp M1 cyt
兿
j Pj Pj⫹KVRelNp
j
withj僆
兵
RdRp, HA, NP, NA, M1, M2, NEP其
(25) whereVRelis the number of progeny virions released from a cell. It has been shown that vRNPs assume a 7⫹1 configuration, which along with other evidence supports a specific packaging mechanism of the viral ge-nome (25). The formation of a complex containing the eight genome segments would involve multiple intersegments interactions (17) and may therefore be a kinetic bottleneck. Hence, the overall rate of virus release,rRel, in our model is proportional the amount of cytoplasmic vRNPs and to the virus release rate,kRel. Viral protein levels are assumed to scale this rate by multiplication of Michaelis-Menten-like terms, which depend on the abundance of each proteinjin one virionNPj(33). Here, enough proteins forKVRelvirions must be present to reach half the max-imal release rate. We assume that progeny virions do not reinfect the same cell. This is in agreement with the observation that neuraminidase expres-sion on the cell surface cleaves sialic acid and limits superinfection (24).For all steps of the virus life cycle, we assume that cellular resources, like amino acids, nucleotides, and ribosomes, as well as other host factors are abundant and do not limit replication, an assumption which has been used by several previous authors for other viruses (10,16,23) and which is in agreement with theoretical results for influenza virus (55).
Computation.We solved equations 1 to 25 numerically using the CVODE routine from SUNDIALS (8) on a Linux-based system. All model parameters and initial conditions can be found in Tables A1 and A2 in the appendix. Model files and experiments were handled with the Systems Biology Toolbox 2 (51) for MatLab (version 7.5.0 R2007b). We estimated parameters using the fSSm algorithm for stochastic global optimization (13). To assess parameter uncertainties, confidence intervals were calcu-lated were possible using a bootstrap method (28). For data sets where no measurement errors are available, the model’s local sensitivity is provided instead. We calculate this sensitivity by following the approach of Guten-kunst et al. (19), who quantified the change in model output in response to parameter perturbations using an averaged least-squares formula. However, in contrast to their implementation, we perturb each parameter by 1% around its estimated value and only consider the change in model species that were measured at the time points of their measurement. Hence, this local sensitivity shows how much a given parameter affects simulation results compared to the available measurements, which indi-cates how accurate the parameter estimates are. In this regard, small sen-sitivities correspond to large variations.
RESULTS
Virus entry.To model the binding of influenza virus particles to the cell surface, we followed the work of Nunes-Correia et al. and used their parameters for the adsorption of virions to MDCK cells
(44). However, in their study the attachment rates were only
mea-sured at 4 and 20°C. To obtain these rates at 37°C, we tuned our model such that equilibrium of binding is reached after 20 min, as
observed experimentally at this temperature (44). The resulting
simulations show the same virus binding in steady state as the model of Nunes-Correia et al. and fit their data equally well (data not shown). After having bound to the plasma membrane, virus particles enter the cell via endocytosis, and a fraction of these particles accomplish fusion with the membrane of late endo-somes. We determined the fraction of fusion-competent virions and the rates for endocytosis and fusion by fitting data of R18
labeling experiments (Fig. 2A) conducted by Stegmann et al. (57).
Table 1 summarizes the obtained parameters. The first fusion events occur within 5 min after adsorption, with most fusion-competent virions escaping late endosomes within 80 min. How-ever, half of the adsorbed virions fail to fuse and are degraded in
lysosomes. According to the local sensitivity (Table 1), the model
output heavily depends on the fraction of fusion-competent
viri-ons,FFus, indicating that R18 labeling experiments can yield
accu-rate estimates of this parameter. Using the parameters shown in
Table 1, we can infer the dynamics of virus entry during an
infec-tion (Fig. 2B). Following the observations of Nunes-Correia et al.
(44), virion binding sites on the cell surface in our model are
abundant and do not become depleted by endocytosis. Hence, all
extracellular virus particles (VEx) can enter the cell, which requires
approximately 1 h. The number of virus particles in endosomes peaks around 20 min postinfection and decreases subsequently due to the depletion of virions in the medium. After about 90 min, half of the parental vRNPs have entered the nucleus, where they start synthesizing viral RNAs while the rest is degraded in lyso-somes.
[image:4.585.138.448.66.159.2]FIG 2Dynamics of virus entry. Lines represent simulation results. (A) Model fit to data (circles) for the fusion of R18-labeled influenza virus (strain NIB26) with endosomes in MDCK cells modified from those of Stegmann et al. (57). In brief, virus was added to MDCK cells at 0°C for 1 h to allow for virus adsorption, cells were washed, and warm buffer (37°C) was added. The percentage of fused out of total cell-associated virions is shown. (B) Simulated amounts of extracellular virions in the medium (VEx), virions in endosomes (VEn), and vRNPs in the nucleus (Vpnuc) for infection at an MOI of 10, neglecting viral protein synthesis and vRNP degradation.
TABLE 1Parameter estimates for virus entry
Rate constant Value Local sensitivity (%)
FFus 0.51 0.44
khi
Att 8.09 · 10⫺2(sites · h)⫺1 3.06 · 10⫺4
klo
Att 4.55 · 10⫺2(sites · h)⫺1 4.36 · 10⫺6
kEn 4.8 h⫺1 4.46 · 10⫺2
kFus 3.21 h⫺1 1.32 · 10⫺2
on November 7, 2019 by guest
http://jvi.asm.org/
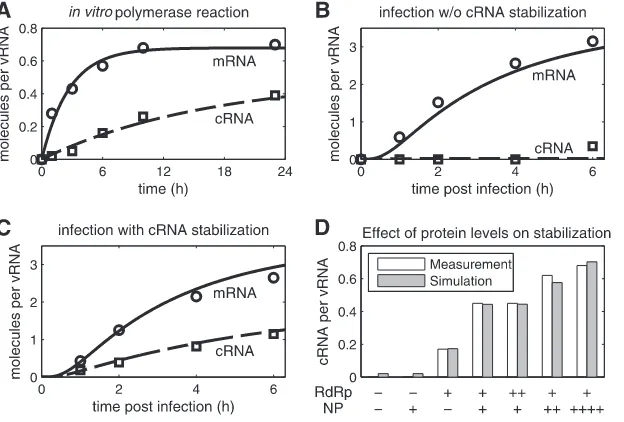
[image:4.585.298.545.656.724.2]Transition from transcription to replication.Early experi-ments demonstrated that during infection, vRNPs first synthesize
mRNA, whereas cRNA accumulation occurs only after thede novo
synthesis of viral proteins (22). Vreede et al. proposed that this
transition from transcription to replication occurs because nas-cent cRNAs are degraded by cellular nucleases unless viral
poly-merases and NP protect it from degradation (61). We included
this hypothesis in our model and used two published studies for
parameter estimation (58,61). These works provide time courses
of vRNA, cRNA, and mRNA levels under various experimental conditions measured by semiquantitative NA gene-specific primer extension analysis. To use these data for modeling, we conducted a densitometric analysis and quantified the intensity of each RNA signal. We then normalized these values to the corre-sponding vRNA signal (at the same time point), which Vreede et al. assumed to be constant during their experiments. This yielded the relative mRNA and cRNA levels per molecule of vRNA.
One key observation is that virion-derived vRNPs synthesize
both mRNA and cRNAin vitro, i.e., in the absence ofde novo
-synthesized viral proteins and cellular nucleases (58). Our model
can resemble this experiment (Fig. 3A) and allows for the
estima-tion of kinetic parameters. As expected in the absence of nucleases,
we find a low degradation rate of cRNA (kRDeginTable 2). Here,
kRDegmost likely corresponds to decomposition processes,
suggest-ing a high stability of cRNA underin vitroconditions. In contrast,
parameter estimation yields a high rate for mRNA degradation
(kMDeg), which results from the observation that mRNA levels reach
steady state after 12 h (Fig. 3A). However,kMDegmight be biased by
the assumption that mRNA synthesis is constant throughout the experiment. This might not be the case due to the loss of enzy-matic activity or depletion of precursors, such as cap sources, which would also yield constant mRNA levels but at a much lower degradation rate.
To approach thein vivosituation, we next examined infection
experiments in 293T cells from the literature (61). In these
exper-iments, cellular protein synthesis was inhibited, which prevents the production of viral proteins and, hence, should abolish cRNA stabilization. To rescue cRNA accumulation, Vreede et al. ex-pressed four viral proteins in different combinations prior to in-fection: wild-type NP, PA, PB2, and a mutant PB1 (PB1a, contain-ing D445A/D446A mutation). A trimeric polymerase complex which contains PB1a is catalytically inactive but binding compe-tent and thus cannot synthesize viral RNAs yet still stabilize cRNA
(61). For parameter estimation, we fitted all infection data sets
simultaneously (Fig. 3BtoD) using the same parameters, and we
[image:5.585.136.448.66.277.2]FIG 3Simulation of cRNA stabilization hypothesis. Experiments yielding NA gene-specific mRNA (Œ) and cRNA levels (䊐) were conducted by Vreede et al. using primer extension analysis (58,61). We obtained relative RNA levels from these studies by densitometric analysis and normalized each data point to the constant vRNA signal. (A) Fit to data of anin vitropolymerase assay using virion-derived vRNPs (58). (B and C) Model fit to infection of 293T cells with influenza A/WSN/33 at an MOI of 5 (58). In brief, protein synthesis during infection was inhibited, and plasmids expressing NP, PA, and PB2 (B) or NP, PA, PB2, and PB1a (C) were transfected prior to infection. (D) Same as panel C, except that various amounts of plasmids expressing PA, PB2, PB1a (RdRp), NP, or empty vector (⫺) were transfected prior to infection. Bars represent the cRNA level at 2 hpi. PB1a, catalytically inactive mutant PB1-D445A/D446A which forms polymerase complexes that do not synthesize viral RNAs but stabilize cRNA.
TABLE 2Parameter estimates for the transition to genome replication
Rate constant
Valuee Local sensitivity (%)
In vitroa Cell cultureb In vitro Cell culture
kNPBind 3.01 · 10⫺4 7.16 · 10⫺3
kRdRpBind 1c 6.62 · 10⫺7
kMDeg 0.37 0.33 0.13 1.37 · 10⫺2
kRDeg 0.06 36.36 1.76 · 10⫺2 1.21 · 10⫺5
kRDegRdRp 4.25 1.16 · 10⫺2
kCSyn 0.03 0.76 8.78 · 10⫺2 5.31 · 10⫺2
kMSyn 0.21d 0.96d 0.18 8 · 10⫺2
a
Model fit is presented in Fig. 3A.
bModel fit is presented in Fig. 3B to D.
c
Since polymerase binding is at saturation in experiments, we can only estimate the lower bound of this rate.
d
For better comparison, the synthesis rate of an mRNA of average length is shown. In the model, transcription is proportional to the actual length of each segment’s mRNA using a length-specific synthesis rate of 350 nt · h⫺1
(in vitro) and 1,630 nt · h⫺1
(cell culture).
e
Values forkNP Bind
andkRdRp Bind
are given in (molecules · h)⫺1
, and the other constants are given in h⫺1.
on November 7, 2019 by guest
http://jvi.asm.org/
[image:5.585.300.544.532.633.2]chose initial conditions according to the experimental setup (see
Table A2 in the appendix for details).Figure 3Bshows a scenario
in which NP is present but no complete viral polymerase com-plexes are formed (in experiments only NP, PA, and PB2 were transfected). Consequently, cRNA is rapidly degraded in the sim-ulation and cannot be detected by primer extension analysis. Ac-cording to Vreede et al., the elevated cRNA signal at 6 h postinfec-tion (hpi) can be attributed to a minor breakthrough of protein
synthesis inhibition (61) and therefore is not reflected by the
model. Note that in contrast to thein vitroexperiment, cRNA
degradation occurs with a high rate in cells (kRDeginTable 2). This
rate has to compensate for the constant cRNA synthesis by vRNPs. However, for high degradation rates, which are required to reflect the complete absence of cRNA, the model becomes increasingly insensitive. Hence, separate experiments are necessary to exactly quantify this rate. In the presence of NP and all polymerase sub-units, stabilization can rescue the cRNA signal from this
degrada-tion in the experiment and in the model (Fig. 3C). The
stabiliza-tion of cRNA by catalytically inactive polymerases should not
affect mRNA transcription. Hence, simulated mRNA levels inFig.
3BandCare the same and correspond well to the averages from
these two independent biological experiments. In Fig. 3D, we
show how different amounts of preexpressed proteins affect cRNA stabilization in our model and in the literature. In the absence of viral polymerases, simulations show very low cRNA levels
regard-less of whether NP is transfected (Fig. 3D, columns 1 and 2). This
residual amount occurs because vRNPs constantly synthesize cRNA and degradation rates are finite. However, such low levels may be below the detection limit of primer extension analysis. The addition of polymerases in the absence of NP results in the partial
stabilization of cRNA (Fig. 3D, column 3). To capture this
obser-vation in the model, RdRp-cRNA complexes have to be formed that have degradation rates lower than that of free cRNA (com-parekRDegandkRDegRdrpinTable 2). When polymerases and NP are
expressed together, cRNA accumulation is rescued substantially (Fig. 3D, column 4). Furthermore, experiments and the model show that transfecting increasing amounts of polymerases does not yield higher cRNA levels, whereas an increase in NP levels enhances stabilization. Hence, in these experiments, polymerase binding is at saturation, suggesting a high affinity to cRNA. In contrast, the binding of preexpressed NP is the rate-limiting step of cRNA stabilization. Overall, simulations are in good agreement with the measured dynamics of cRNA and mRNA accumulation and also capture qualitative observations at different protein con-centrations.
Inhibition of vRNP activity and nuclear export.In the late phase of infection, vRNPs leave the nucleus to travel to the plasma membrane, where they are incorporated into new virus particles. Based on experimental observations, two viral proteins control nuclear export in our model: the M1 protein, which initially binds
to vRNPs and renders them inactive for RNA synthesis (20,64,
69), and NEP, which subsequently facilitates transport (1,45). We
examined whether this mechanism, in combination with cRNA stabilization, captures the viral RNA dynamics during infection.
Figure 4AandBshow a model fit to quantitative real-time reverse transcription-PCR (RT-PCR) data of intracellular mRNA, cRNA, and vRNA levels in infected MDCK cells obtained by Kawakami et
al. (31). Viral mRNA starts to accumulate within the first hour
postinfection, reaching a distinct peak at approximately 3.5 to 4
hpi (Fig. 4A). Later in infection, mRNA levels decline in the
mea-FIG 4Viral RNA synthesis during infection. (A and B) Model fit to vRNA (⌬), mRNA (Œ), and cRNA (䊐) levels of segment 5 (encoding NP) during an infection of MDCK cells with influenza A/WSN/33 at an MOI of 10 after 1 h of virus adsorption at 4°C. Data were determined by Kawakami et al. using strand-specific real-time RT-PCR (31). (C) Model prediction for the accumulation of M1 proteins (PM1) and vRNPs engaged in RNA synthesis (Vp
nuc). (D) Comparison of model fit in panels A and B to data of Shapiro et al. for the synthesis rates of M1 proteins ({) and mRNAs (⫻) of segment 7 (encoding M proteins) (53). In brief, BHK-21 cells were infected with influenza virus (WSN strain) at an MOI of 10 to 20, and virus was allowed to adsorb for 1 h at 4°C. Protein and mRNA levels were determined by pulse-chase experiments. In simulations,rM1SynandrRM7Syn are the synthesis rates of M1 proteins (first term in equation 20) and of mRNAs of segment 7 (first term in equation 14, withi⫽7), respectively. Data points and simulations are given as percentages of their maximums.
on November 7, 2019 by guest
http://jvi.asm.org/
[image:6.585.113.475.63.300.2]surements and the simulation. For cRNAs, we find an increase in
abundance from 1.5 hpi onwards (Fig. 4B). Again, accumulation
slows down during later stages, and the cRNA level in the model eventually falls slightly toward the end of infection. Consequently, viral genome replication starts 1.5 to 2 hpi and persists throughout infection, but it levels off from 6 hpi onwards. These dynamics are in general agreement with other experiments using different
in-fluenza virus strains and cell lines (15,21,53,62).
In the proposed model, the shutdown of mRNA and cRNA synthesis between 3.5 and 4 hpi depends primarily on the inhibi-tion of vRNP activity by M1 proteins. To explore this in more
detail, we used the simulations inFig. 4AandBto infer the
dy-namics of M1 protein levels (Fig. 4C). M1 proteins begin to
accu-mulate 2 hpi and subsequently bind to vRNPs in the nucleus. Therefore, the number of active vRNPs starts to decrease 2.5 hpi. However, some vRNPs remain active and continue to produce RNAs at low levels even late in infection. For cRNA, this residual
synthesis is nearly in equilibrium with the degradation (Fig. 4B),
since cRNAs are stabilized in cRNP complexes. In contrast,
mRNA degradation outweighs synthesis at late time points (Fig.
4A). The relationship between the synthesis of M1 and of mRNA
has been observed previously in qualitative (69) and dynamic
ex-periments (53). The latter work is of special interest, since Shapiro
et al. measured M1 protein and mRNA synthesis rates. Intrigu-ingly, our model can resemble these dynamics without further parameter optimization, although the measurements were
con-ducted in BHK-21 cells (Fig. 4D). As found by Shapiro et al.,
simulations show that the mRNA synthesis rate is maximal at 2.5
hpi (preceding the peak in the mRNA level shown inFig. 4A). Its
decrease coincides with the onset of M1 production. However, experiments show a complete shutdown of mRNA production,
which contrasts with model predictions. However, this too might be related to the sensitivity of the experimental approach. In sum-mary, simulation results suggest that the binding of M1 proteins to vRNPs for subsequent nuclear export causes a selective inhibi-tion of positive-strand RNA synthesis during the late phase of infection.
Table 3presents the parameters estimated from the data inFig.
4AandB. Note that this data set was obtained in MDCK cells,
whereas the cRNA stabilization experiments, on whichTable 2is
based, were conducted in 293T cells. Hence, we reestimated the RNA synthesis rates and found that mRNA production especially
is faster in MDCK cells (comparekMSyninTables 2and3). This
difference might be cell line dependent or may arise due to the quality of the data sets. In particular, it has to be taken into ac-count that the experiments in 293T cells were assayed by primer extension analysis, yielding only relative RNA levels, while the real-time RT-PCR measurements in infected MDCK cells allowed a direct quantification. The latter data set should enable more accurate estimations. For these experiments, we also find that the rate of vRNA synthesis is significantly higher than that observed for cRNA.
Progeny virion release. Considering the accumulation of vRNAs toward the end of infection, we were interested in what factor(s) limits the amount of virions that are released by an infected cell. Our infection experiments showed that an aver-age MDCK cell infected with influenza A/WSN/33 produces up
to 104progeny virions (data not shown). We tuned the virus
release rate in our model such that the simulations reflect this average virus yield. Interestingly, protein loss due to releasing this amount of particles does not deplete the intracellular levels
of viral polymerases M1 and NP (Fig. 5A) or of the other viral
proteins (data not shown). The differences in simulated
pro-tein abundance seen inFig. 5Aarise for two reasons: budding
virions contain different amounts of each protein, and mRNA levels in the model are higher for smaller genome segments,
which is in agreement with Hatada et al. (21). Simulations also
show that the level of vRNPs in the cytoplasm increases
throughout infection (Fig. 5B), as has been observed for the
vRNA level in experiments (Fig. 4A). Hence, modeling suggests
that no single viral component limits the formation of progeny
virions. Furthermore,Fig. 5Bindicates that the first virus
[image:7.585.40.289.87.157.2]par-ticles are released 3 to 4 hpi, and that more virions leave the cell at late time points due to the accumulation of cytoplasmic vRNPs and other viral components.
TABLE 3Parameter estimates for viral RNA synthesis during late infection
Rate constantd Value Confidence intervala
kM1
Bind 1.39 · 10⫺6 (0.5–3) · 10⫺6
kRnp
Deg 0.09 0b–0.19
kC
Syn 1.38 0.53–2.99
kM
Syn 147c 47–239
kV
Syn 13.86 5.73–23.71
a
Quantiles Q0.025and Q0.975of 3,000 bootstrap iterations performed according to Joshi
et al. (28).
b
Estimates reached a lower parameter bound of 9 · 10⫺4
.
cSynthesis rate of an mRNA of average length (Table 2) using a length-specific rate of
2.5 · 105
nt · h⫺1
.
dk
M1
Bindis given in (molecules · h)⫺1, and the other constants are given in h⫺1.
FIG 5Dynamics of virus release. (A) Model prediction for the levels of M1 (PM1), NP (PNP), and viral polymerase complexes (PRdRp) based on the model fit shown inFig. 4. (B) Level of cytoplasmic vRNPs (VpM1cyt) and cumulative amount of released progeny virions (VRel) for the simulation presented inFig. 4.
on November 7, 2019 by guest
http://jvi.asm.org/
[image:7.585.116.473.592.702.2]DISCUSSION
We integrated key experimental results published by various re-search groups during the last 2 decades to derive a kinetic model of influenza virus replication in a mammalian cell. In contrast to previous theoretical studies, this model captures qualitative and quantitative measurements of virus entry, the transition from transcription to replication, and viral RNA levels in a single coher-ent framework. We used it to explore how influenza viruses regu-late their life cycle and what consequence this regulation has for the dynamics of viral RNA synthesis.
Previous studies of virus entry have found virion-containing
endosomes as early as 5 min after adsorption (37,68), while
un-coating occurs between 5 and 90 min (32,36,57). Our model is
consistent with these results and allowed us to investigate the dy-namics of virus entry in detail. In simulations, vRNPs accumulate in the nucleus between 13 and 90 min, which is in good agreement
with immunocytochemistry of incoming NP (36). Intriguingly,
virus uptake in experiments and simulations ceases thereafter. Modeling suggests that this is due to the depletion of extracellular virions. However, in infected cell culture, free virions can be found
even after the entry phase (37). We thus speculate that only the
virus particles in the vicinity of cells get depleted, whereas diffu-sion limits the transport of virions in the bulk of medium. In this case, the number of extracellular virions in our model corre-sponds to the number of infectious particles in close proximity to cells. Alternatively, or additionally, internalization and removal of sialic-acid containing receptors could restrict virus entry later in
infection (24). Such a scenario would not be reflected in the
cur-rent framework, since we adopted a binding model which implies
fast receptor recycling (44). Overall, virus entry requires
approx-imately 25 min, after which the first vRNPs reach the nucleus in
experiments (36). This delay is in agreement with the observed
onset of mRNA accumulation in our model, indicating that vRNPs directly begin transcription once in the nucleus.
To account for the transition from transcription to genome replication, we implemented the stabilization of cRNAs in our model and analyzed experimental data that led to this hypothesis. The model can capture these observations successfully but re-quires several key features to do so. For instance, to reflect low cRNA levels in the absence of viral proteins, the degradation rate of nascent cRNAs in cells has to be high enough to compensate for replication. In fact, estimation yields a significantly higher rate for infection experiments than that found in the cell-free system.
Hence, cRNAs seem to be stablein vitro, whereas in cells efficient
degradation takes place. It would be interesting to determine whether cellular nucleases allow for such high degradation rates. To reflect experiments that show a partial stabilization of cRNAs by viral polymerases, the model requires that cRNA encapsidation occurs via a two-step process. Initially, the rapid binding of poly-merases produces RdRp-cRNA complexes, which are less suscep-tible to degradation than free cRNA. Stable cRNPs then are formed by NP binding. Confirming this two-step mechanism and characterizing the stability of the RdRp-cRNA intermediates thus would provide further evidence for the stabilization hypothesis. Encapsidation in two successive steps would also explain why NPs alone do not stabilize cRNA in experiments. However, NP was shown to bind RNA with high affinity in an unspecific manner
(reviewed in reference47). To be consistent with the cRNA
stabi-lization model, NP-cRNA complexes should be susceptible to
degradation. Studying whether that is the case and, if so, why polymerases are necessary for stabilization may provide further insights into the proposed mechanism. Finally, the increase in cRNA levels in response to increasing NP concentrations suggests that NP binding is the rate-limiting step of encapsidation. Whether this is a general feature or only holds true for the exper-imental conditions used by Vreede et al. remains to be deter-mined. Taken together, however, these features enable our model to capture the cRNA stabilization hypothesis and the transition from transcription to replication. However, as a variety of other regulatory mechanisms were proposed, alternative models are un-der investigation. In future studies, the application of model dis-crimination techniques and their combination with model-based experimental design may allow us to validate or invalidate the competing hypotheses.
The shutdown of mRNA synthesis constitutes the second widely accepted regulation of influenza virus replication. Early evidence suggested that this step is part of the switch to genome
replication (reviewed in reference47), such that NP biases vRNPs
toward replication instead of transcription; i.e., an increase in rep-lication would be at the expense of transcription. However, our simulations show that there is no immediate shutdown of tran-scription but rather a sustained period of time where mRNA and cRNA are both synthesized. In the model, this allows for an accu-mulation of transcriptionally active progeny vRNPs which sup-port the rapid increase in mRNA and cRNA levels between 1 and 3.5 hpi. Parental vRNPs alone could not sustain such an increase and the high mRNA levels observed in experiments. Instead of an early shutdown, we find that transcription inhibition coincides with the accumulation of M1 proteins, which marks the onset of nuclear export during the late phase of infection. According to the model, the inactivation of vRNPs by M1 binding affects both pos-itive-strand RNAs around 4 hpi, leading to a decrease in the mRNA level and a roughly constant amount of cRNAs. In con-trast, the accumulation of vRNAs continues unhindered. These dynamics were also observed in several independent experiments
(21,31,54,62). Hence, we proposed that M1 proteins regulate
viral RNAs during the late phase of infection by interacting with vRNPs and inhibiting positive-strand RNA synthesis. In support of this, experiments in which a model cRNA or vRNA (containing a chloramphenicol acetyltransferase [CAT] gene flanked by the noncoding sequence of segment 8) was expressed in the presence of viral polymerases and NP, but not M1, showed an accumula-tion of all three viral RNA species but no shutdown of RNA
syn-thesis (40). Inhibition by M1 thus could stop mRNA and cRNA
production when both levels are sufficient to sustain the synthesis of viral proteins and genomic RNAs. Indeed, when cells were in-fected with a virus carrying a mutant M1 protein impaired in its binding to vRNPs, intracellular vRNA levels increased by 250%
(66), indicating a lack of negative regulation. One could argue that
this increase was due to the retention of viral genome copies in the cell because nuclear export and, therefore, budding were im-paired. However, in our model, even a complete block of budding would only increase vRNA levels by roughly 10% as infected cells produce significantly more viral genomes than are incorporated into progeny virions. Hence, it seems that M1 proteins provide a negative feedback that directs vRNPs toward nuclear export, which prevents excessive RNA production in favor of budding. Finally, the export of vRNPs itself may contribute to this
on November 7, 2019 by guest
http://jvi.asm.org/
tion, as two independent studies found an increase in nuclear
cRNA levels in the presence of export inhibitors (7,67).
In the present work, we focused solely on the regulation of
virus replication by viral proteins, supported byin vitro
experi-ments showing that capped RNA-primed transcription andde
novo-initiated replication from short RNA templates occur in the
absence of cellular proteins (42). In fact, we demonstrated that by
considering the encapsidation of viral RNAs and the export of
vRNPs alone, simulations can capture the dynamics of viral RNAs during infection. However, previous studies have also identified a variety of host factors that are required for efficient viral RNA
synthesis in cells (reviewed in reference 65). For instance, the
minichromosome maintenance complex (MCM) stimulates
cRNA initiation (29,30), and RAF-2p48 (also designated UAP56,
NPI-5, and Bat1), a cellular splicing factor, acts as a chaperon for
[image:9.585.47.544.77.610.2]NP during RNA encapsidation (39). Also, the activity of cellular
TABLE A1List of parameters used for the simulation of influenza virus replication
Parameter Description Value Source, reference, or comment
Bhitot No. of high-affinity binding sites 150 sites 44
Blotot No. of low-affinity binding sites 1,000 sites 44
DRib Distance between two adjacent ribosomes 160 nt 4
FFus Fraction of fusion-competent virions 0.51 Expt inFig. 2A
FSp17 Fraction of M2-encoding mRNAs 0.02 Based on ration of M2 to M1
FSp18 Fraction of NEP-encoding mRNAs 0.125 50
khiAtt Attachment to high-affinity binding sites 8.09 · 10⫺2sites⫺1· h⫺1 Adjusted to data in reference44 kloAtt Attachment to low-affinity binding sites 4.55 · 10⫺2sites⫺1· h⫺1 Adjusted to data in reference44 kM1Bind Binding of M1 to nuclear vRNPs 1.39 · 10⫺6molecule⫺1· h⫺1 Expt inFig. 4AandB
kNPBind Binding of NP to RdRp-RNA complexes 3.01 · 10⫺4molecule⫺1· h⫺1 Expt inFig. 3B-D kRdRpBind Binding of RdRp complexes to RNA 1 molecule⫺1· h⫺1 Expt inFig. 3B-D
kMDeg Degradation of mRNA 0.33 h⫺1 Expt inFig. 3B-D
kRDeg Degradation of nascent cRNA/vRNA 36.36 h⫺1 Expt inFig. 3B-D
kRnpDeg Degradation of RNPs 0.09 h⫺1 Expt inFig. 4AandB
kRRdRpDeg Degradation of RdRp-RNA complexes 4.25 h⫺1 Expt inFig. 3B-D
kEn Endocytosis 4.8 h⫺1 Expt inFig. 2A
khiEq Equilibrium constant of high-affinity sites 1.13 · 10⫺2site⫺1 44 kloEq Equilibrium constant of low-affinity sites 8.33 · 10⫺5site⫺1 44
kExp NEP binding and nuclear export 1 · 10⫺6molecule⫺1· h⫺1 Adjusted to data from reference2
kFus Fusion with endosomes 3.21 h⫺1 Expt inFig. 2A
kImp Nuclear import 6 h⫺1 5
kRdRp Formation of RdRp complexes 1 molecule⫺2· h⫺1 Rapid complex formation
kRel Virus release 3.7 · 10⫺3virions · molecule⫺1· h⫺1 Cell releases 104virions in 12 h
kCSyn cRNA synthesis 1.38 h⫺1 Expt inFig. 4AandB
kMSyn mRNA synthesis 2.5 · 10⫺5nt · h⫺1 Expt inFig. 4AandB
kPSyn Protein synthesis 64,800 nt · h⫺1 56
kVSyn vRNA synthesis 13.86 h⫺1 Expt inFig. 4AandB
KVRel Influence of proteins on virus release 10 virions Adjusted
L1 Length of segment 1’s mRNA 2,320 nt 33
L2 Length of segment 2’s mRNA 2,320 nt 33
L3 Length of segment 3’s mRNA 2,211 nt 33
L4 Length of segment 4’s mRNA 1,757 nt 33
L5 Length of segment 5’s mRNA 1,540 nt 33
L6 Length of segment 6’s mRNA 1,392 nt 33
L7 Length of segment 7’s unspliced mRNA 1,005 nt 33
L8 Length of segment 8’s unspliced mRNA 868 nt 33
LV Average length of a vRNA 1,700 nt Based on reference33
NPRdRP No. of RdRp complexes in a virion 45 molecules · virion⫺1 33
NPHA No. of HA molecules in a virion 500 molecules · virion⫺
1 33
NPNP No. of NP molecules in a virion 1,000 molecules · virion⫺1 33
NPNA No. of NA molecules in a virion 100 molecules · virion⫺
1 33
NPM1 No. of M1 molecules in a virion 3,000 molecules · virion⫺1 33
NPM2 No. of M2 molecules in a virion 40 molecules · virion⫺
1 33
NPNEP No. of NEP molecules in a virion 165 molecules · virion⫺1 33
NM1nuc Nucleotides bound by one M1 molecule 200 nt 63
NNEPNuc Nucleotides bound by one NEP molecule 1,700 nt Adjusted to data in reference47
NNPnuc Nucleotides bound by one NP molecule 24 nt 47
on November 7, 2019 by guest
http://jvi.asm.org/
RNA polymerase II (Pol II) is crucial for viral mRNA synthesis
(reviewed in reference3). However, to directly regulate the
dy-namics of virus replication, such factors would have to change in abundance or activity. Otherwise, host factors would provide an admittedly essential but constant influence while the viral factors with which they interact exercise control. Indeed, for MCM and RAF-2p48, such interactions were found with the PA subunit and
NP, respectively (30, 46), which are both prime candidates for
viral regulators. Host factors providing such constant influence can be omitted from mathematical models. For cellular Pol II, in contrast, degradation has been reported to occur from 6 hpi on-wards, and it has been suggested that this contributes to the
shut-down of viral mRNA synthesis (59). We did not implement this
mechanism due to the lack of quantitative data on Pol II dy-namics. However, it may explain why our model overestimates
the transcription rate at late time points (Fig. 4D). In the same
study, the authors find that the association of Pol II and viral polymerases peaks 3 hpi and declines thereafter, much like the amount of synthetically active vRNPs in our model. Based on these observations, we hypothesize that M1 and NEP binding, which start 3 hpi, impair the association of viral and cellular RNA polymerases in preparation for nuclear export. Later in infection, the degradation of Pol II would then further reduce the rate of mRNA synthesis.
Our simulations of a complete infection cycle support previous experimental findings showing that vRNA accumulates
through-out infection (21,31,60). Thus, the drain of vRNPs by virus
re-lease does not deplete viral genome copies in the cell. Moreover, modeling suggests that the same applies for viral proteins. Exper-imentally, protein synthesis was found to proceed unhindered
even at late times postinfection (26), and for M1, the most
abun-dant component in a virus particle, accumulation in cells was
shown even 24 hpi despite significant virus release (66). Similarly,
strong M1 and NP fluorescence could be detected by flow
cytom-etry at late times postinfection (52). Hence, it seems that the
abun-dance of viral components is sufficient to release more virus par-ticles, and that other processes constitute a bottleneck. Candidates could be the formation of a complex containing all eight genome segments or the transport of vRNPs to the plasma membrane. In favor of this hypothesis, vRNPs were shown to accumulate in the perinuclear region around the microtubule-organizing centers at
intermediate times postinfection (2, 14). Furthermore, for late
time points, vRNPs accumulate at the plasma membrane (14),
indicating that budding also is a limiting step.
By using the proposed model to analyze quantitative data on vRNA and cRNA levels, we estimated that the synthesis rate of vRNA is 10 times higher than that of cRNA. Previous works
have suggested that vRNA is produced intransby soluble
poly-merases (27), whereas cRNAs are synthesized incisby the
poly-merase present in a vRNP (29,58). It thus is tempting to
spec-ulate that up to 10 soluble polymerases are involved in vRNA production from one cRNP. Alternatively, structural differ-ences in the promoter region of vRNAs and cRNAs may
influ-ence the efficiency with which synthesis is initiated (49),
affect-ing this estimate.
In summary, we have developed a quantitative mathematical model of the influenza virus life cycle. It explicitly accounts for the stabilization of viral RNAs through their encapsidation by poly-merases and NP and for the role of M1 and NEP during vRNP export from the nucleus. Unlike previous approaches, the pro-posed model structure combines a wide variety of experimental data sets in a consistent way and captures the time courses and levels of all three viral RNAs during infection. Hence, the model provides an ideal basis for studying virus replication and its nu-merous proposed regulators. Ultimately, such models will allow us to integrate our current knowledge into a systematic frame-work and will support the design of new experiments to deepen our understanding of influenza virus replication and its regula-tion.
APPENDIX
The parameters used for the simulation of influenza virus replication (Table A1) and the initial conditions and parameter changes used to fit experiments and generate figures (Table A2) are provided here.
ACKNOWLEDGMENT
We thank Markus Rehberg for helpful discussions and for comments on the manuscript.
REFERENCES
1.Akarsu H, et al.2003. Crystal structure of the M1 protein-binding do-main of the influenza A virus nuclear export protein (NEP/NS2). EMBO J.
22:4646 – 4655.
2.Amorim MJ, et al.2011. A Rab11 and microtubule dependent
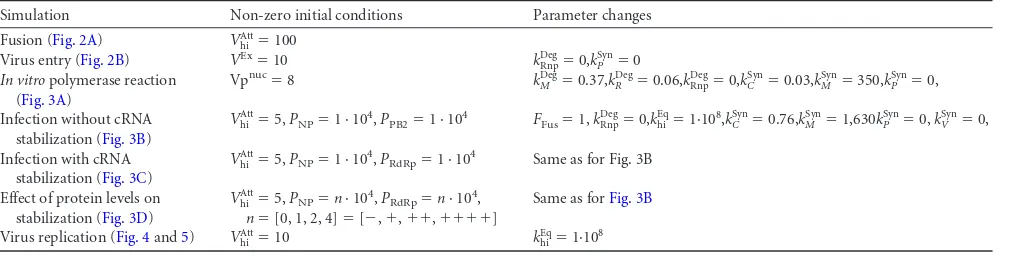
mecha-TABLE A2Initial conditions and parameter changes (compared to Table A1) used to fit experiments and generate figures
Simulation Non-zero initial conditions Parameter changes
Fusion (Fig. 2A) VhiAtt⫽100
Virus entry (Fig. 2B) VEx⫽10 k
Rnp Deg⫽0,k
P Syn⫽0
In vitropolymerase reaction (Fig. 3A)
Vpnuc⫽8 k
M Deg⫽0.37,k
R
Deg⫽0.06,k Rnp Deg⫽0,k
C
Syn⫽0.03,k M Syn⫽350,k
P Syn⫽0,
Infection without cRNA stabilization (Fig. 3B)
VhiAtt⫽5,PNP⫽1 · 10 4,P
PB2⫽1 · 10
4 F
Fus⫽1,kRnp Deg⫽0,k
hi Eq⫽1·108,k
C
Syn⫽0.76,k M
Syn⫽1,630k P Syn⫽0,k
V Syn⫽0,
Infection with cRNA stabilization (Fig. 3C)
VhiAtt⫽5,PNP⫽1 · 10 4,P
RdRp⫽1 · 10
4 Same as for Fig. 3B
Effect of protein levels on stabilization (Fig. 3D)
VhiAtt⫽5,PNP⫽n· 10 4,P
RdRp⫽n· 10 4,
n⫽[0, 1, 2, 4]⫽[⫺,⫹,⫹⫹,⫹⫹⫹⫹]
Same as forFig. 3B
Virus replication (Fig. 4and5) VhiAtt⫽10 khiEq⫽1·108
aAs Vreede et al. assumed that the vRNA signal is constant in their experiments, we omit vRNP degradation. However, degradation of cRNPs still occurs, with rate⫽0.09 in these
simulations.
bAs for Fig. 3B, the degradation of vRNPs was omitted whereas cRNPs are degraded with⫽0.98.
on November 7, 2019 by guest
http://jvi.asm.org/
[image:10.585.40.546.76.204.2]nism for cytoplasmic transport of influenza A virus vRNA. J. Virol.85: 4143– 4156.
3.Amorim MJ, Digard P.2006. Influenza A virus and the cell nucleus. Vaccine24:6651– 6655.
4.Arava Y, et al.2003. Genome-wide analysis of mRNA translation profiles in Saccharomyces cerevisiae. Proc. Natl. Acad. Sci. U. S. A.100:3889 – 3894.
5.Babcock HP, Chen C, Zhuang X.2004. Using single-particle tracking to study nuclear trafficking of viral genes. Biophys. J.87:2749 –2758. 6.Beaton AR, Krug RM.1986. Transcription antitermination during
influ-enza viral template RNA synthesis requires the nucleocapsid protein and the absence of a 5=capped end. Proc. Natl. Acad. Sci. U. S. A.83:6282– 6286.
7.Chase GP, et al.2011. Influenza virus ribonucleoprotein complexes gain preferential access to cellular export machinery through chromatin target-ing. PLoS Pathog.7:e1002187. doi:10.1371/journal.ppat.1002187. 8.Cohen SD, Hindmarsh AC.1996. CVODE, a stiff/nonstiff ODE solver in
C. Computers Phys.10:138 –143.
9.Cros JF, Palese P.2003. Trafficking of viral genomic RNA into and out of the nucleus: influenza, Thogoto and Borna disease viruses. Virus Res.
95:3–12.
10. Dahari H, Ribeiro RM, Rice CM, Perelson AS. 2007. Mathematical modeling of subgenomic hepatitis C virus replication in Huh-7 cells. J. Virol.81:750 –760.
11. Dee KU, Shuler ML.1997. A mathematical model of the trafficking of acid-dependent enveloped viruses: application to the binding, uptake, and nuclear accumulation of baculovirus. Biotechnol. Bioeng.54:468 – 490. 12. Duesberg PH.1969. Distinct subunits of the ribonucleoprotein of
influ-enza virus. J. Mol. Biol.42:485– 499.
13. Egea JA, Rodriguez-Fernandez M, Banga JR, Marti R. 2007. Scatter search for chemical and bio-process optimization. J. Global Optim.37: 481–503.
14. Eisfeld AJ, Kawakami E, Watanabe T, Neumann G, Kawaoka Y.2011. RAB11A is essential for influenza genome transport to the plasma mem-brane. J. Virol.85:6117– 6126.
15. Enami M, Fukuda R, Ishihama A.1985. Transcription and replication of eight RNA segments of influenza virus. Virology142:68 –77.
16. Endy D, Kong D, Yin J.1997. Intracellular kinetics of a growing virus: a genetically structured simulation for bacteriophage T7. Biotechnol. Bio-eng.55:375–389.
17. Fournier E, et al.2012. A supramolecular assembly formed by influenza A virus genomic RNA segments. Nucleic Acids Res.40:2197–2209. 18. Glick GD, Toogood PL, Wiley DC, Skehel JJ, Knowles JR.1991. Ligand
recognition by influenza virus. The binding of bivalent sialosides. J. Biol. Chem.266:23660 –23669.
19. Gutenkunst RN, et al.2007. Universally sloppy parameter sensitivities in systems biology models. PLoS Comput. Biol.3:1871–1878. doi:10.1371/ journal.pcbi.0030189.
20. Hankins RW, Nagata K, Kato A, Ishihama A.1990. Mechanism of influenza virus transcription inhibition by matrix (M1) protein. Res. Vi-rol.141:305–314.
21. Hatada E, Hasegawa M, Mukaigawa J, Shimizu K, Fukuda R. 1989. Control of influenza virus gene expression: quantitative analysis of each viral RNA species in infected cells. J. Biochem.105:537–546.
22. Hay AJ, Lomniczi B, Bellamy AR, Skehel JJ.1977. Transcription of the influenza virus genome. Virology83:337–355.
23. Hensel SC, Rawlings JB, Yin J.2009. Stochastic kinetic modeling of vesicular stomatitis virus intracellular growth. Bull. Math Biol.71:1671–1692. 24. Huang I-C, et al.2008. Influenza A virus neuraminidase limits viral
superinfection. J. Virol.82:4834 – 4843.
25. Hutchinson EC, von Kirchbach JC, Gog JR, Digard P.2010. Genome packaging in influenza A virus. J. Gen. Virol.91:313–328.
26. Inglis SC, Mahy BW.1979. Polypeptides specified by the influenza virus genome. 3. Control of synthesis in infected cells. Virology95:154 –164. 27. Jorba N, Coloma R, OrtíN J. 2009. Genetic trans-complementation
establishes a new model for influenza virus RNA transcription and repli-cation. PLoS Pathog.5:e1000462. doi:10.1371/journal.ppat.1000462. 28. Joshi M, Seidel-Morgenstern A, Kremling A.2006. Exploiting the
boot-strap method for quantifying parameter confidence intervals in dynamical systems. Metab. Eng.8:447– 455.
29. Kawaguchi A, Momose F, Nagata K.2011. Replication-coupled and host factor-mediated encapsidation of the influenza virus genome by viral nu-cleoprotein. J. Virol.85:6197– 6204.
30. Kawaguchi A, Nagata K.2007. De novo replication of the influenza virus RNA genome is regulated by DNA replicative helicase, MCM. EMBO J.
26:4566 – 4575.
31. Kawakami E, et al.2011. Strand-specific real-time RT-PCR for distin-guishing influenza vRNA, cRNA, and mRNA. J. Virol. Methods173:1– 6. 32. Koff WC, Knight V.1979. Inhibition of influenza virus uncoating by
rimantadine hydrochloride. J. Virol.31:261–263.
33. Lamb RA, Krug RM.2001. Orthomyxoviridae: the viruses and their replication, p 1487–1531. Fields virology, 4th ed.InKnipe DM and How-ley PM (ed), Fields virology, 4th ed. Lippincott Williams & Wilkins, Phil-adelphia, PA.
34. Lim K-I, Lang T, Lam V, Yin J.2006. Model-based design of growth-attenuated viruses. PLoS Comput. Biol. 2:e116. doi:10.1371/ journal.pcbi.0020116.
35. Martin K, Helenius A.1991. Nuclear transport of influenza virus ribo-nucleoproteins: the viral matrix protein (M1) promotes export and inhib-its import. Cell67:117–130.
36. Martin K, Helenius A.1991. Transport of incoming influenza virus nu-cleocapsids into the nucleus. J. Virol.65:232–244.
37. Matlin KS, Reggio H, Helenius A, Simons K.1981. Infectious entry pathway of influenza virus in a canine kidney cell line. J. Cell Biol.91:601– 613. 38. Medcalf L, Poole E, Elton D, Digard P. 1999. Temperature-sensitive
lesions in two influenza A viruses defective for replicative transcription disrupt RNA binding by the nucleoprotein. J. Virol.73:7349 –7356. 39. Momose F, et al.2001. Cellular splicing factor RAF-2p48/NPI-5/BAT1/
UAP56 interacts with the influenza virus nucleoprotein and enhances viral RNA synthesis. J. Virol.75:1899 –1908.
40. Mullin AE, Dalton RM, Amorim MJ, Elton D, Digard P.2004. Increased amounts of the influenza virus nucleoprotein do not promote higher lev-els of viral genome replication. J. Gen. Virol.85:3689 –3698.
41. Nayak DP, Hui EK-W.2002. Assembly and morphogenesis of influenza viruses. Recent Res. Dev. Virol.4:35–54.
42. Newcomb LL, et al.2009. Interaction of the influenza a virus nucleocap-sid protein with the viral RNA polymerase potentiates unprimed viral RNA replication. J. Virol.83:29 –36.
43. Noda T, et al. 2006. Architecture of ribonucleoprotein complexes in influenza A virus particles. Nature439:490 – 492.
44. Nunes-Correia I, Ramalho-Santos J, Nir S, de Lima MCP.1999. Inter-actions of influenza virus with cultured cells: detailed kinetic modeling of binding and endocytosis. Biochemistry38:1095–1101.
45. O’Neill RE, Talon J, Palese P.1998. The influenza virus NEP (NS2