Mutations Inactivating Herpes Simplex
Virus 1 MicroRNA miR-H2 Do Not
Detectably Increase
ICP0
Gene
Expression in Infected Cultured Cells or
Mouse Trigeminal Ganglia
Dongli Pan,
a,b,cJean M. Pesola,
aGang Li,
aSeamus McCarron,
aDonald M. Coen
a Department of Biological Chemistry and Molecular Pharmacology, Harvard Medical School, Boston, Massachusetts, USAa; Department of Medical Microbiology and Parasitology, Zhejiang University School ofMedicine, Hangzhou, Zhejiang, Chinab; Collaborative Innovation Center for Diagnosis and Treatment of
Infectious Diseases, Zhejiang University, Hangzhou, Zhejiang, Chinac
ABSTRACT
Herpes simplex virus 1 (HSV-1) latency entails the repression of
produc-tive (“lytic”) gene expression. An attracproduc-tive hypothesis to explain some of this
repres-sion involves inhibition of the expresrepres-sion of ICP0, a lytic gene activator, by a viral
microRNA, miR-H2, which is completely complementary to
ICP0
mRNA. To test this
hypothesis, we engineered mutations that disrupt miR-H2 without affecting ICP0 in
HSV-1. The mutant virus exhibited drastically reduced expression of miR-H2 but
showed wild-type levels of infectious virus production and no increase in ICP0
ex-pression in lytically infected cells, which is consistent with the weak exex-pression of
miR-H2 relative to the level of
ICP0
mRNA in that setting. Following corneal
inocula-tion of mice, the mutant was not significantly different from wild-type virus in terms
of infectious virus production in the trigeminal ganglia during acute infection,
mouse mortality, or the rate of reactivation from explanted latently infected ganglia.
Critically, the mutant was indistinguishable from wild-type virus for the expression of
ICP0
and other lytic genes in acutely and latently infected mouse trigeminal ganglia.
The latter result may be related to miR-H2 being less effective in inhibiting ICP0
ex-pression in transfection assays than a host microRNA, miR-138, which has previously
been shown to inhibit lytic gene expression in infected ganglia by targeting
ICP0
mRNA. Additionally, transfected miR-138 reduced lytic gene expression in infected
cells more effectively than miR-H2. While this study provides little support for the
hypothesis that miR-H2 promotes latency by inhibiting ICP0 expression, the
possibil-ity remains that miR-H2 might target other genes during latency.
IMPORTANCE
Herpes simplex virus 1 (HSV-1), which causes a variety of diseases,
can establish lifelong latent infections from which virus can reactivate to cause
re-current disease. Latency is the most biologically interesting and clinically vexing
fea-ture of the virus. Ever since miR-H2’s discovery as a viral microRNA bearing complete
sequence complementarity to the mRNA for the important viral gene activator ICP0,
inhibition of ICP0 expression by miR-H2 has been a major hypothesis to help explain
the repression of lytic gene expression during latency. However, this hypothesis
re-mained untested in latently infected animals. Using a miR-H2-deficient mutant virus,
we found no evidence that miR-H2 represses the expression of
ICP0
or other lytic
genes in cells or mice infected with HSV-1. Although miR-H2 can repress
ICP0
ex-pression in transfection assays, such reex-pression is weak. The results suggest that
other mechanisms for miR-H2 activity and for the repression of lytic gene expression
during latency deserve investigation.
KEYWORDS
herpes simplex virus, latency, miRNA
Received6 October 2016Accepted7 November 2016
Accepted manuscript posted online9 November 2016
CitationPan D, Pesola JM, Li G, Mccarron S, Coen DM. 2017. Mutations inactivating herpes simplex virus 1 microRNA miR-H2 do not detectably increaseICP0gene expression in infected cultured cells or mouse trigeminal ganglia. J Virol 91:e02001-16. https://doi.org/ 10.1128/JVI.02001-16.
EditorR. M. Sandri-Goldin, University of California, Irvine
Copyright© 2017 American Society for Microbiology. All Rights Reserved.
Address correspondence to Donald M. Coen, [email protected].
crossm
on November 7, 2019 by guest
http://jvi.asm.org/
H
erpes simplex virus 1 (HSV-1) is a ubiquitous human pathogen that mainly infects
the facial mucosal surfaces. Productive (“lytic”) infection of HSV-1 in these
periph-eral tissues is followed by the establishment of a latent infection in the trigeminal ganglion
(TG), from which the virus can periodically reactivate to cause recurrent disease (reviewed
in reference 1). During latency, the virus does not replicate, and lytic viral gene expression
is strongly repressed, with the only abundantly expressed viral genes contained within a
locus that encodes the latency-associated transcripts (
LAT
s) (1, 2) and several HSV-1
microRNAs (miRNAs) (3–5). In mouse models of HSV-1 latency, one or more products from
the
LAT
locus can promote the establishment and maintenance of latency by repressing
lytic gene expression (6–8). There is also evidence for these gene products protecting
neurons during acute infection (9–14) and playing a role in reactivation from latency (8,
15–19), chromatin modifications (20–22), and immune evasion (23).
miRNAs are small RNAs that repress gene expression by binding to their target
mRNAs in the RNA-induced silencing complex (RISC) and reducing mRNA stability
and/or translation. The seed region of an miRNA (nucleotides 2 to 8 starting from the
5
=
end) is critical for its functions, although other parts of the miRNA can also contribute
(24). Among the HSV-1 miRNAs encoded in the
LAT
locus, miR-H2 is one of the most
highly expressed during latent infection of mouse TGs (3, 4, 25) and in a cell culture
model of neuronal latency (26). Its expression during latency depends on a 200-bp DNA
segment that includes the
LAT
promoter (25), and it can be expressed in cell culture
following transfection of a plasmid encoding the
LAT
transcription unit (3). Thus,
miR-H2 may perform one or more functions of the
LAT
locus. miR-H2 is completely
complementary to coding sequences within the mRNA that encodes infected cell protein
0 (ICP0). ICP0 is an E3 ubiquitin ligase that counteracts cellular repressive functions,
including intrinsic and innate immunity (27–31), and is important for viral replication and
gene expression in many cell types and for reactivation from latency (32–36). The
comple-mentarity of miR-H2 and
ICP0
mRNA, prior results showing that one or more products of
the
LAT
locus repress lytic gene expression in mouse neurons (6–8), and
transient-transfection experiments showing that miR-H2 can repress ICP0 expression in cell culture (3,
37, 38) led to the attractive hypothesis that miR-H2 could promote latency by repressing
ICP0 expression, thereby globally repressing lytic gene expression (3, 37–39). HSV-2, which
is closely related to HSV-1, also encodes a miR-H2 (alternatively known as miR-III) that is
completely complementary to coding sequences in the HSV-2
ICP0
mRNA and can similarly
repress ICP0 expression in transfection assays (40). In further support of the hypothesis,
although miR-H2 is expressed rather weakly during lytic infection (3, 4, 25), it can be found
bound to
ICP0
mRNA in photoactivatable ribonucleoside-enhanced crosslinking and
im-munoprecipitation (PAR-CLIP) assays (38, 41). Interestingly, a host miRNA, miR-138, can
downregulate ICP0 by targeting the 3
=
untranslated region (UTR) of the
ICP0
transcript,
thereby promoting latency by repressing lytic gene expression and increasing host survival
(41). This raises the possibility that the virus might be equipped with multiple mechanisms
of repressing ICP0 expression to promote latency.
Some mutational studies investigating miR-H2 have been published (37–39). Two
miR-H2 mutant viruses derived from strain McKrae were reported to exhibit increased
ICP0 protein expression 4 and 6 h after infection of rabbit skin (RS) cells and increased
viral virulence and reactivation rates in a mouse model of ocular inoculation (37, 39). A
mutant virus in a strain 17 background was reported to show increased
ICP0
expression
at both the mRNA and protein level 8 h after infection of 293T cells but reduced viral
DNA replication in Neuro-2A cells following infection at a low but not a high multiplicity
of infection (MOI) (38). Regardless, the critical question of whether miR-H2 can
down-regulate the expression of ICP0 and other lytic genes during the establishment or
maintenance of latency has not been tested. To investigate this and related questions,
we generated a mutant HSV-1 in a strain KOS background that is drastically impaired
for miR-H2 expression, as well as a rescued derivative, and characterized their
pheno-types in cell culture and a mouse model. Our results provide little or no support for the
hypothesis that miR-H2 represses the expression of
ICP0
during infection.
Pan et al. Journal of Virology
on November 7, 2019 by guest
http://jvi.asm.org/
RESULTS
miR-H2 can repress ICP0 protein and
ICP0
mRNA expression in transfected
cells.
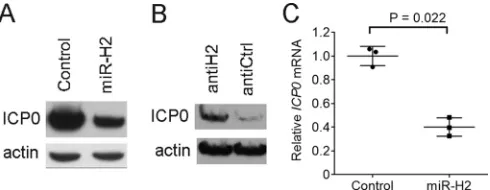
To test whether we could confirm previous results that HSV-1 miR-H2 can repress
ICP0 protein expression during transfection (3, 37, 38), we cotransfected 293T cells with
an ICP0-expressing plasmid (pRS-1) and either a miR-H2 mimic or a control mimic with
an irrelevant sequence, followed by Western blotting of ICP0 and, as a loading control,
actin. As expected, transfection of the miR-H2 mimic reduced the level of ICP0 protein
relative to the level seen following transfection of the control mimic (Fig. 1A). When
transfected together with pRS-1 and the miR-H2 mimic, a miR-H2 inhibitor, compared
to a control inhibitor with an unrelated sequence, led to increased ICP0 protein levels
(Fig. 1B). Since a previous experiment that observed miR-H2 inhibition of ICP0 protein
expression failed to show a concomitant reduction in
ICP0
mRNA (3), we were
inter-ested in whether this could be confirmed. However, measuring
ICP0
mRNA levels by
quantitative reverse transcription PCR (qRT-PCR) in a transfection experiment
per-formed in the same manner as the experiment whose results are shown in Fig. 1A
revealed that
ICP0
mRNA expression was reduced 2.5-fold by miR-H2 (
P
⫽
0.022,
two-tailed paired
t
test) (Fig. 1C). Thus, miR-H2 can repress
ICP0
expression at both the
protein and mRNA level in transfected cells.
Design and validation of mutations that disrupt miR-H2 expression.
We then
sought to design mutations that would disrupt miR-H2 expression. Our design took into
account two considerations. First, as miR-H2 is encoded in the strand antisense to the
ICP0
open reading frame, we would need to maintain the ICP0 amino acid sequence
using codon redundancy. Second, given that mutations are introduced into both
strands of the DNA, any mutant form of miR-H2, were it to be expressed, would still be
completely complementary to the mutated
ICP0
transcript expressed from the opposite
strand and could target the mutated
ICP0
transcript. Therefore, to prevent a mutant
form of miR-H2 from being expressed, sufficient nucleotide substitutions would be
needed to disrupt base pairs in the pre-miR-H2 hairpin so that the stem-loop structure
required for miRNA biogenesis would no longer be formed. Based on these
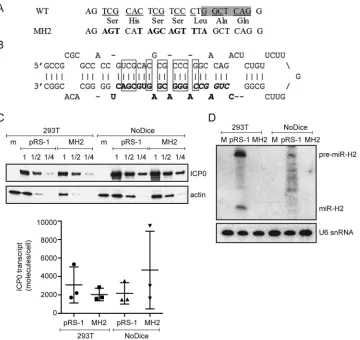
consider-ations, we designed a mutated sequence with 12 nucleotide substitutions (Fig. 2A). The
mutations are expected to disrupt 10 bp within the hairpin (Fig. 2B). The resulting
sequence was not predicted to form any stem-loop structure by the RNAfold web
server (http://rna.tbi.univie.ac.at/cgi-bin/RNAWebSuite/RNAfold.cgi). To test whether
the mutations affect ICP0 protein or
ICP0
mRNA expression, we introduced the
muta-tions into the pRS-1 plasmid, resulting in the pRS-1MH2 plasmid, which expressed
amounts of ICP0 protein (determined by Western blotting of a dilution series of the
samples) and
ICP0
mRNA (determined by qRT-PCR) similar to the amounts expressed by
pRS-1 when transfected into 293T cells (Fig. 2C). To eliminate the concern that miR-H2
might be expressed from the wild-type (WT) plasmid, which could affect ICP0 levels, we
FIG 1Effects of miR-H2 on ICP0 protein andICP0mRNA expression in transfected cells. (A) 293T cells were cotransfected with 75 ng of pRS-1 and 16 nM either irrelevant control mimic or miR-H2 mimic. At 30 h posttransfection (hpt), ICP0 and, as a loading control, actin levels were analyzed by Western blotting. (B) 293T cells were cotransfected with pRS-1, 8 nM miR-H2 mimic, and 20 nM either miR-H2 inhibitor (antiH2) or control inhibitor (antiCtrl). At 30 hpt, ICP0 and actin levels were analyzed by Western blotting. (C) Transfection was performed as described in the legend to panel A in triplicate, withICP0mRNA levels, normalized to the levels of humanGAPDHmRNA, measured by qRT-PCR at 30 hpt. Horizontal bars and error bars represent mean values and standard deviations, respectively.on November 7, 2019 by guest
http://jvi.asm.org/
[image:3.585.84.329.71.166.2]measured miR-H2 levels from pRS-1 plasmid-transfected cells by qRT-PCR and Northern
blot analyses. Remarkably, a strong signal was detected by qRT-PCR (data not shown),
and we could easily detect both pre-miR-H2 and mature miR-H2 by Northern blot
analysis despite there being no known promoter in the plasmid that would drive
miR-H2 expression (Fig. 2D). To eliminate any effect on ICP0 expression due to miR-H2
expression, we employed NoDice cells, which lack Dicer and are derived from 293T cells
(42). Transfection of the pRS-1 plasmid into these cells resulted in the expression of
pre-miR-H2 and a ladder of RNA products on the Northern blot. Some very faint bands
were roughly the size of miR-H2, but none precisely comigrated with miR-H2 (Fig. 2D).
Following transfection of pRS-1 or pRS-1MH2 into the NoDice cells, the two plasmids
expressed similar amounts of
ICP0
mRNA and ICP0 protein (Fig. 2C), suggesting that the
MH2 mutations did not affect ICP0 expression at the level of either mRNA or protein in
the absence of miR-H2. We also observed no expression of any miRNA-sized species
FIG 2miR-H2 mutations that do not affect ICP0 expression. (A) Mutations introduced into miR-H2. The top row shows the WT ICP0 gene sequence antisense to miR-H2, with the shaded area representing the sequence complementary to the seed region. The bottom row gives the corresponding mutant sequence with the altered nucleotides in bold letters. The middle row shows the predicted amino acid sequence encoded by both DNA sequences. (B) Sequence and hairpin structure of pre-miR-H2 showing mature miR-H2 in boldface, its seed region in boldface italics, and the base pairs that would be disrupted by the MH2 mutations in rectangles. (C) (Top) HEK293T wild-type and NoDice cells were either mock transfected (m) or transfected with the ICP0-expressing plasmid pRS-1 or the corresponding plasmid containing the miR-H2 mutations, pRS-1MH2. Protein samples were harvested at 24 hpt and serially diluted in twofold steps. Western blot analysis was conducted to compare the ICP0 protein levels in the different samples with the level of actin as an internal control. (Bottom) Total RNA samples were prepared at 24 hpt and analyzed forICP0mRNA levels by qRT-PCR. Horizontal bars and error bars represent mean values and standard deviations of the means, respectively, for three independent experiments. Differences were not statistically significant in either cell type (paired Student’sttest). (D) 293T or NoDice cells were either mock transfected (M), or transfected with pRS-1 or pRS-1MH2 as indicated. At 24 hpt,⬍200-nucleotide RNA was isolated from transfected cells and analyzed by Northern blot hybridization, first being probed for miR-H2 and then stripped and probed with the U6 snRNA probe as an internal loading control.Pan et al. Journal of Virology
on November 7, 2019 by guest
http://jvi.asm.org/
[image:4.585.45.405.69.409.2]hybridizing to the probe for miR-H2 when pRS-1MH2 was transfected into either 293T
or NoDice cells (Fig. 2D). The effect of the MH2 mutations on miR-H2 expression was
examined further after the construction of a mutant virus (see below).
Construction of miR-H2 mutant virus.
Using bacterial artificial chromosome (BAC)
technology, we introduced the MH2 mutations into a BAC containing the genome of
HSV-1 strain KOS (referred to hereinafter as WT), resulting in a mutant BAC and virus
named MH2. Starting with the MH2 BAC, we restored the wild-type sequence to
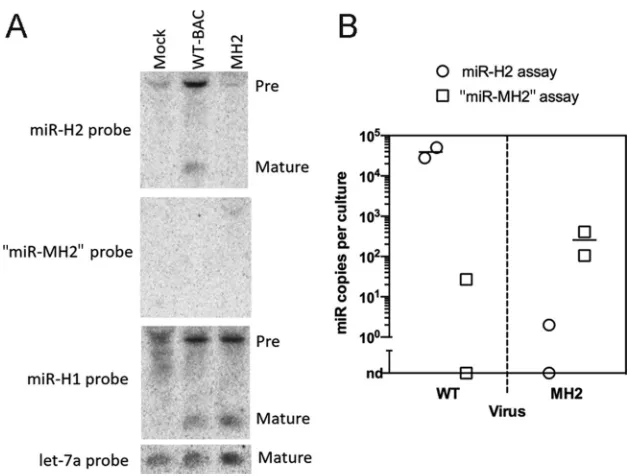
generate a rescued BAC and virus named RH2. Northern blot hybridization confirmed
that, whereas mature miR-H2 was readily detectable in WT virus-infected cells, it was
undetectable in MH2 mutant-virus-infected cells (Fig. 3A, top). Moreover, when we
stripped and reprobed the membrane for “miR-MH2” (the putative mutant version of
miR-H2 expressed from the MH2 virus) using the same conditions, no mature miRNA
signal was detected in any sample, although a larger species was detected in RNA from
MH2-infected cells (but not in the other samples) (Fig. 3A). The MH2 virus did, however,
express miR-H1, similarly to the WT (Fig. 3A). To more sensitively evaluate the amount
of “miR-MH2” possibly expressed from the mutant virus, we developed a stem-loop
qRT-PCR assay that could quantify “miR-MH2” by comparing the signal from tested
samples to that from a dilution series of synthetic miRNA. Using this assay and a
previously developed assay for miR-H2 (3), we quantified miR-H2 and “miR-MH2” in
WT-and MH2 virus-infected 293T cells, respectively, normalizing to the let-7a levels. As we
have found that longer RNA species, such as pre-miRNAs, can sometimes meaningfully
contribute to the signal in stem-loop qRT-PCR assays (M. F. Kramer and J. M. Pesola,
unpublished results), we size fractionated the RNAs on an SDS-PAGE urea gel and
extracted RNA with lengths of approximately 18 to 28 nucleotides. qRT-PCR assays
using this size-fractionated RNA revealed that the “miR-MH2” levels in MH2
virus-infected cells were 150-fold lower than the miR-H2 levels in WT virus-virus-infected cells (Fig.
3B). As miR-H2 is expressed to a maximum of 35 molecules/cell (4), this fold reduction
FIG 3Mutant HSV-1 with drastically reduced miR-H2 expression. (A) 293T cells were either mock infected or infected with WT (WT-BAC) or MH2 virus at an MOI of 10 for 18 h, followed by Northern blotting. The probes used for hybridization are shown to the left, and the positions of miRNA species (pre- and mature) are indicated to the right. (B) “miR-MH2” expressed in MH2-infected cells is present at levels 150-fold below the level of miR-H2 in WT-infected cells. qRT-PCR assays for miR-H2 (circles) and “miR-MH2” (squares) were performed on duplicate gel-extracted short RNA samples from 293T cells infected with WT (left) or MH2 (right) virus. Signals detected in WT-infected cells by the “miR-MH2” assay and in MH2-infected cells by the miR-H2 assay were either very low or not detectable (nd). Expression levels were normalized to that of host miRNA let-7a. Bars represent mean values.on November 7, 2019 by guest
http://jvi.asm.org/
[image:5.585.48.364.68.306.2]corresponds to the MH2 virus expressing
⬍
1 “miR-MH2” molecule for every four cells.
In a separate experiment, 293T cells infected with the RH2 virus showed levels of
miR-H2 similar to the levels in 293T cells infected with WT virus as measured by
qRT-PCR (data not shown). Thus, the MH2 mutations drastically reduce miR-H2
expres-sion.
MH2 shows WT levels of virus production and no increase in
ICP0
gene
expression in lytically infected cells.
To investigate the effects of the MH2 mutations
on viral replication and
ICP0
gene expression in lytically infected cells, we infected Vero
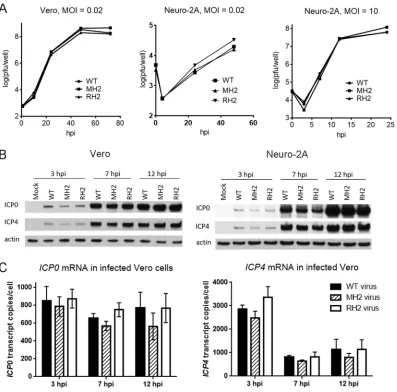
or Neuro-2A cells with WT, MH2, and RH2 viruses at different multiplicities of infection
(MOIs). These viruses exhibited similar replication kinetics in Vero cells at an MOI of 0.02
and in Neuro-2A cells at MOIs of 0.02 and 10 (Fig. 4A). They expressed similar levels of
ICP0 and, as a control, ICP4 proteins at 3, 7, and 12 h postinfection (hpi) when Vero or
Neuro-2A cells were infected at an MOI of 10, as analyzed by Western blotting, and
there certainly were no increases in ICP0 expression in MH2-infected cells (Fig. 4B). (If
anything, the ICP0 and ICP4 levels were lower in MH2-infected cells than in WT- or
FIG 4The MH2 mutations have little effect on viral replication and ICP0 expression during lytic infection. (A) Replication kinetics in Vero cells at an MOI of 0.02 (left), in Neuro-2A cells at an MOI of 0.02 (middle) and in Neuro-2A cells at an MOI of 10 (right). Shown are viral titers over time. Each point represents the average value of triplicates. (B) Vero (left) or Neuro-2A (right) cells were infected with WT, MH2, or RH2 virus at an MOI of 10, followed by Western blotting for ICP0, ICP4, and actin levels. Viruses used for infection are indicated above each gel lane, and the infection times are shown on top. (C) Vero cells were infected with WT (black bar), MH2 (hatched bar), or RH2 (white bar) at an MOI of 10 for 3, 7, or 12 h, and thenICP0(left) andICP4(right) transcript levels were measured by qRT-PCR. The error bars represent the standard deviations of duplicates. No difference was significant according to one-way ANOVA tests.
Pan et al. Journal of Virology
on November 7, 2019 by guest
http://jvi.asm.org/
[image:6.585.43.440.70.462.2]RH2-infected cells in this experiment, but this was not the case in other experiments
[data not shown].) They also expressed similar
ICP0
and
ICP4
(Fig. 4C) and
ICP27
(data
not shown) mRNA levels at these time points when Vero cells were infected at an MOI
of 10, as measured by qRT-PCR. Notably, the qRT-PCR results also revealed that
ICP0
mRNA reached levels of 800 molecules/cell as early as 3 hpi and remained above 500
molecules/cell throughout the rest of the infection cycle (Fig. 4C). Under the same
conditions, we have previously shown that in lytically infected Vero cells, miR-H2
accumulates gradually during infection, to only 10 molecules/cell at 6 hpi and 35
molecules/cell at 18 hpi (4). Thus, the MH2 mutations did not affect virus production
and did not increase
ICP0
gene expression in lytically infected cells, and
ICP0
mRNA is
much more abundant than miR-H2 in this setting.
The MH2 mutations have little effect on viral replication or gene expression in
acutely and latently infected mouse TG.
To characterize the mutant virus phenotype
in vivo
, we employed a mouse model in which, following corneal inoculation, virus
replicates productively in the eye and TG and then establishes latent infection in TG
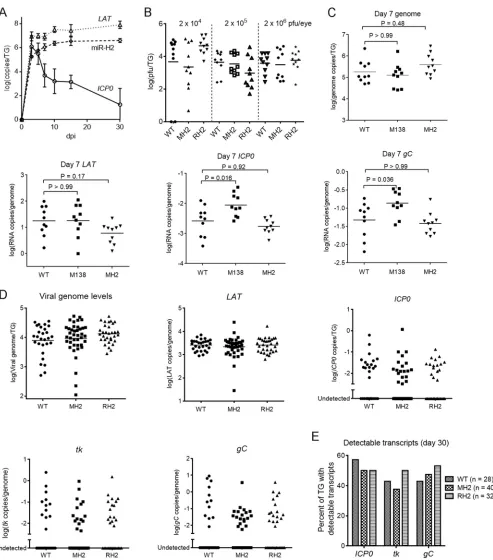
neurons (43). Prior to testing the mutant, we used qRT-PCR to assess the expression of
stable
LAT
, miR-H2, and
ICP0
mRNA expression in TGs at different time points after the
mice were inoculated on the cornea with KOS strain at a dose of 2
⫻
10
5PFU/eye.
Consistent with previous results for the expression of
LAT
and HSV-1 miRNAs using
strains KOS and F (25, 44, 45),
LAT
and miR-H2 expression increased between 3 and 30
days postinfection (dpi), with both plateauing by 15 dpi (Fig. 5A); however, these results
differed from a report using strain F that
LAT
and HSV-1 miRNAs decreased substantially
between 14 and 28 dpi (46). As expected, the levels of
ICP0
transcripts declined after 3
dpi (Fig. 5A). The levels of miR-H2 were similar to those of
ICP0
transcripts at 5 dpi and
greatly exceeded those of
ICP0
transcripts thereafter (Fig. 5A). Our subsequent studies
therefore focused on 5 dpi and later.
We next compared WT, MH2, and RH2 viruses for viral replication in TGs after
inoculation on the cornea using three different doses. Despite their 100-fold range, the
three doses resulted in similar viral titers in TG homogenates at 5 dpi. We note that in
a previous report (43), TG virus titers at 3 dpi increased substantially with inoculum
dose through this range. Differences in the time points of analysis (dpi) and
experi-mental methods may account for the different results. Regardless, we found no
significant differences in titers detected among the viruses with any given dose (
P
ⱖ
0.16) (Fig. 5B). Next, we compared WT and MH2 viruses for the expression of
ICP0
and
other viral genes at 7 dpi by measuring transcript levels using qRT-PCR. The M138
mutant virus, in which miR-138 binding sites in
ICP0
mRNA are inactivated, was
included as a positive control because it expresses increased lytic transcript levels at
this time point (41). With a dose of 2
⫻
10
5PFU/eye, WT and MH2 viruses expressed
similar levels of
ICP0
and
gC
transcripts per viral genome, while the levels of these
transcripts per genome were significantly higher with the M138 virus (Fig. 5C). The level
of
LAT
expression per genome appeared lower in MH2-infected ganglia than in
WT-infected ganglia; however, that difference was not significant (
P
⫽
0.17) (Fig. 5C).
To assess the role of miR-H2 during latency, we infected mice with WT, MH2, or RH2
virus with a dose of 2
⫻
10
5PFU/eye. At 30 dpi, we harvested TGs for DNA and RNA
analyses using quantitative PCR (qPCR) and qRT-PCR, respectively. The viral genome
and
LAT
intron levels were similar for the three viruses (Fig. 5D), suggesting that the
MH2 virus was able to establish latency normally in TGs. Lytic transcripts were only
detectable in some ganglia, as reported before (7, 41, 44, 47). The three viruses
produced similar levels of
ICP0
,
tk
, and
gC
transcripts, as well as similar percentages of
TGs with detectable
ICP0
,
tk
, or
gC
transcripts (Fig. 5E).
Thus, the MH2 mutations did not detectably affect the expression of
ICP0
or other
lytic genes tested during the establishment of latency (7 dpi) or while latency was
maintained (30 dpi).
The MH2 mutations have no significant effect on virulence or reactivation.
We
next assessed the impact of the MH2 mutations on viral virulence and reactivation from
on November 7, 2019 by guest
http://jvi.asm.org/
FIG 5The MH2 mutations have little effect on viral replication and transcript levels in murine TGs. (A) Time course of miR-H2,LAT, andICP0mRNA expression in murine TGs. Mice were inoculated on the cornea with 2⫻105PFU of KOS per eye. At different dpi, 3 or 4 mice were euthanized and TGs were harvested
and analyzed forICP0transcripts, stableLAT, and miR-H2 by qRT-PCR. RNA copy numbers were obtained by comparing the signals with standard curves generated usingin vitro-transcribedICP0mRNA,LAT, or synthetic miR-H2. (B) Viral titers in TGs at 5 dpi following inoculation, with doses indicated at the top and virus names at the bottom. Data for different doses are separated by vertical dashed lines. Each point represents a value from one TG. The horizontal lines represent the geometric mean values (undetectable values were included in the calculations as 0). One-way ANOVA tests did not detect any significant differences between titers of viruses at each dose (Pⱖ0.16). (C to E) Mice were inoculated on the cornea with 2⫻105PFU/eye of the indicated virus. (C) Viral
genome and transcript levels in TGs at 7 dpi. Each point represents a value from one TG. The names of the transcripts assayed are indicated at the top of each graph. Vertical axes show logarithmic values, and RNA levels were normalized to viral genome levels. The horizontal lines represent the geometric mean values. Pvalues shown above the brackets were obtained by one-way ANOVA tests with Bonferroni’s multiple comparison test. (D) Viral genome and transcript levels at 30 dpi as described in the legend to panel C, except that mean values are not indicated in the plots for viral lytic transcripts due to the large numbers of
(Continued on next page)
Pan et al. Journal of Virology
on November 7, 2019 by guest
http://jvi.asm.org/
[image:8.585.47.540.66.626.2]latency. We initially examined virulence in the experiment examining transcript levels
described above. In that experiment, after infection for 30 days, the mortality rates were
5/20, 4/24, and 4/20 (number of dead mice/total number in group) for WT, MH2, and
RH2 viruses, respectively; these rates were not significantly different from each other
(
P
⫽
0.71 for WT versus MH2, and
P
⫽
1 for MH2 versus RH2, Fisher’s exact tests). To
examine virulence further and assess the role of miR-H2 during reactivation from latency,
mice were infected on the cornea at a dose of 1
⫻
10
4PFU/eye. We employed this lower
inoculum dose because we thought that it might reveal differences in reactivation more
readily. Mice were infected for 30 days before explant of ganglia to induce reactivation. We
also assessed the mortality of mice over this time frame (Fig. 6A). Overall, we saw mortalities
in the same range as seen with 2
⫻
10
5PFU/eye (see above), which is consistent with the
similar amounts of viral replication at 5 dpi with doses ranging from 2
⫻
10
4to 2
⫻
10
6PFU/eye (Fig. 5B). Although by 30 dpi, mice inoculated with MH2 virus showed a roughly
twofold-higher level of mortality than mice inoculated with WT and RH2 viruses (Fig. 6A),
the differences were not statistically significant. The kinetics of explant reactivation were
also similar for the three viruses (Fig. 6B). Thus, the MH2 mutations did not significantly
affect virulence or reactivation from latency.
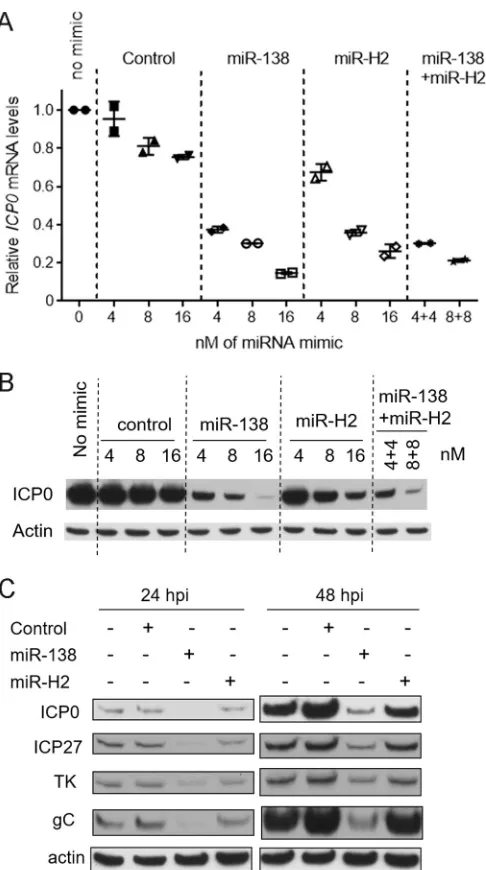
miR-H2 is less potent than miR-138 as a repressor of ICP0 expression.
Like
miR-H2, miR-138 was previously shown to repress ICP0 expression in transfection
assays. However, unlike the MH2 mutations,
ICP0
mutations that prevent miR-138
repression result in increased lytic gene expression in TGs (41). We therefore compared
miR-H2 and miR-138 in an experiment where different amounts of miR-H2 or miR-138
were added during cotransfection with pRS-1 into 293T cells. While both miR-H2 and
miR-138 could repress ICP0 mRNA and protein expression in a dose-dependent
man-ner, miR-H2 was about twofold less effective than miR-138 in repressing
ICP0
mRNA
expression at all doses tested (Fig. 7A). It was also less potent in repressing ICP0 protein
expression, as it took
⬃
4 times as much miR-H2 as miR-138 to obtain the same reduction
FIG 5Legend (Continued)
undetectable values. One-way ANOVA (for viral genome andLAT) and Kruskal-Wallis tests (forICP0,tk, andgCtranscripts) did not detect any significant differences (Pⱖ0.48). (E) Percentages of TGs exhibiting detectable lytic transcripts. Each vertical bar represents the value for each virus (indicated in the key) and each RNA (below the graph). Fisher’s exact tests did not detect any significant differences for each transcript (Pⱖ0.34).
FIG 6Viral virulence and reactivation from latency. Mice were corneally inoculated with 1⫻104PFU/eye
of the indicated virus (n⫽17 to 18 mice per virus group). The three viruses showed similar back titers of inocula, 1-dpi-eye-swab titers, and 3-dpi-TG titers (not shown). (A) Percentages of mice that died or were euthanized due to severe morbidity over time. Differences were not statistically significant (log-rank test,P⬎0.1). (B) At 30 dpi, surviving mice were euthanized and their TGs were explanted onto a monolayer of Vero cells in tissue culture medium for induction of reactivation. Reactivation was assayed by the presence of infectious virus in the medium. Plotted are percentages of cultures (n⫽22 to 28 per virus group) producing infectious virus at the indicated days after explantation (dpe). Differences were not statistically significant (log-rank test,P⬎0.5).
on November 7, 2019 by guest
http://jvi.asm.org/
[image:9.585.50.361.71.247.2]in expression (Fig. 7B). Additionally when a mixture of miR-138 and miR-H2 with a 1:1 ratio
was transfected, the effects were similar to the results of adding miR-138 alone (Fig. 7A and
B), suggesting that in the presence of miR-138, additional miR-H2 could not reduce ICP0
expression much further. Next, cells were infected with WT virus after being transfected
with miR-H2, miR-138, or a negative-control mimic, followed by analysis of ICP0, ICP27, TK,
and gC protein expression by Western blotting. miR-138 decreased the levels of all four
proteins more effectively than miR-H2 (Fig. 7C). These results suggest that, even when
present at high levels, miR-H2 is not as effective a repressor of ICP0 expression as miR-138
under the conditions tested.
FIG 7Weak repression by miR-H2. (A) 293T cells were cotransfected with 75 ng of pRS-1 together with the concentrations indicated on thexaxis of an irrelevant control mimic or an miR-138 or miR-H2 mimic or both, as indicated above the graph. In the cells analyzed in the last two lanes, miR-138 and miR-H2 were both transfected. At 30 hpt,ICP0andGAPDHmRNA levels were analyzed by qRT-PCR. Shown are ICP0mRNA levels normalized byGAPDHmRNA levels, with the bars and error bars representing mean values and standard deviations of duplicates. (B) Transfection was performed as described in the legend to panel A. ICP0 and actin protein levels were analyzed by Western blotting. The mimics used and the concentrations are indicated above the gel images. (C) 293T cells were mock transfected or transfected with 16 nM irrelevant control mimic, miR-138 mimic, or miR-H2 mimic. At 24 hpt, the cells were infected with WT virus for 24 or 48 h at an MOI of 0.1. The cells were then harvested and analyzed for the different proteins listed on the left using Western blotting.
Pan et al. Journal of Virology
on November 7, 2019 by guest
http://jvi.asm.org/
[image:10.585.85.328.68.503.2]DISCUSSION
Since its discovery (3), miR-H2 has been hypothesized to repress ICP0 expression,
thereby repressing lytic gene expression during latent infections. However, this
hy-pothesis had not been tested. Here, we show that miR-H2 can reduce
ICP0
mRNA and
protein expression in transfected cells. We designed and validated mutations that do
not affect ICP0 expression but drastically reduce miR-H2 expression. We find that a
mutant virus containing these mutations exhibits WT levels of viral replication and no
increase in ICP0 expression in lytically infected cells. In a mouse model, the mutant virus
does not differ significantly from the WT in terms of virulence and reactivation.
Importantly, the mutant exhibits WT levels of expression of
ICP0
and other lytic genes
in acutely and latently infected mouse TGs, arguing against the hypothesis that miR-H2
represses lytic gene expression by targeting
ICP0
mRNA
in vivo
. Finally we show that
miR-H2 is a relatively weak repressor of ICP0. We discuss each of these results below.
miR-H2 can downregulate
ICP0
mRNA, as well as protein, expressed during
transfection.
Our results confirm previous findings that HSV-1 miR-H2 can
downregu-late ICP0 protein levels (3, 37, 38) and additionally show that miR-H2 can reduce
ICP0
mRNA levels, contrary to a previous report (3) but consistent with other previous results
in infected cells transfected with an HSV-1 miR-H2 mimic (38) or an HSV-2 miR-H2
(miR-III) duplex (40). Different conditions, including different time points taken and
different reagents for expressing miRNAs, may have led to the discrepant results.
However, our results are more in line with what would be expected, as mammalian
miRNAs have been shown to predominantly function to reduce mRNA levels (48).
Problems and solutions related to mutating miRNAs located within
mRNA-coding regions.
Altering miRNAs located within mRNA-coding regions by utilizing
codon redundancy runs the risk of influencing the expression of the protein
indepen-dent of effects on the miRNA. In checking whether our MH2 mutations affect ICP0
expression using a transfection assay, we were surprised to find that miR-H2 is
expressed by the ICP0-expressing plasmid, which could influence the outcomes of the
test. This problem was solved by using a Dicer knockout cell line, which prevented
miR-H2 expression and showed that ICP0 expression is indeed unaffected by the MH2
mutations in the absence of miR-H2 expression. A second issue concerns the potential
expression of a mutant form of miR-H2, which could target the mutant
ICP0
mRNA encoded
by the opposite strand. Our analyses confirm that any potential “miR-MH2” expression from
MH2 virus is negligible compared to the level of miR-H2 expression from WT BAC virus.
Moreover, such “miR-MH2” expression as was observed seems more likely to be due to
degradation products of longer transcripts or contamination by longer products rather than
authentic miRNA, especially as the MH2 mutations prevent stem-loop formation. Previous
miR-H2 mutational studies took similar approaches in mutation design (37–39). The
con-cern about miR-H2-independent mutational effects on ICP0 expression was noted in the
study with a miR-H2 mutant virus generated in a strain McKrae background (McK-ΔH2) (37).
These authors stated that they did not observe any miR-H2 expression following
transfec-tion of their ICP0-expressing plasmid; however, the type and sensitivity of the assay(s) used
were not specified. None of the previous studies experimentally addressed the concern of
mutant miR-H2 expression (37–39).
miR-H2 does not repress ICP0 expression or viral replication during lytic
infection of cells.
We find no evidence that miR-H2 downregulates ICP0 expression
during lytic infection, as in lytically infected Vero and Neuro-2A cells, ICP0 expression
was not increased by the MH2 mutations. In comparison, mutations altering miR-138
binding sites on the
ICP0
mRNA result in increased ICP0 expression during lytic
infection of cells containing high levels of miR-138 (41). Weak repression of ICP0
expression (see below) might be one explanation for miR-H2’s ineffectiveness. Another
explanation comes from our finding that, at least in Vero cells, vastly less miR-H2 is
expressed than
ICP0
mRNA, making it unlikely that miR-H2 can have a robust impact on
ICP0 expression during lytic infection. These results contrast with previous reports that
concluded there was increased ICP0 expression in 293 cells infected with the strain 17
on November 7, 2019 by guest
http://jvi.asm.org/
miR-H2 mutant virus (17syn
⫹
mH2) (38), as well as in RS cells infected with McK-ΔH2
(37). While viral strain and cell line differences might bear on the discrepancies, we note
that the previously reported increases in ICP0 expression were either very modest
(
ⱕ
1.3-fold [38]) or not quantified (37). Thus, it seems possible that our results and these
previous results may not be so different after all.
Our observation that MH2 exhibits WT levels of virus production was not surprising,
given the low abundance of miR-H2 during lytic infection and given that we observed
no increase in ICP0 expression. Our findings of WT levels of virus production in
Neuro-2A cells did not mirror the curious decreases in viral DNA synthesis exhibited by
the 17syn
⫹
mH2 viral isolates in these cells (38). More work is needed to understand
whether differences in mutations and viral strains are solely responsible for the different
results reported.
miR-H2 does not detectably repress lytic gene expression in acutely or latently
infected mouse TGs.
In mice, the MH2 mutant and WT viruses expressed
ICP0
and
other viral transcripts at levels that were indistinguishable at both 7 and 30 dpi.
Notably, the results for
ICP0
expression are consistent with previous results showing
that a
LAT
deletion mutation, which leads to 2 to 3 orders of magnitude lower miR-H2
levels during latent infection, so that they are indistinguishable from background levels
(25), also did not appreciably affect spliced
ICP0
transcript levels at 30 dpi (49). We note,
however, that the
LAT
deletion did result in increases in other lytic transcripts (7). Thus,
a product of the
LAT
locus other than miR-H2 is likely to be responsible for the
repression of these lytic transcripts.
Our results cannot be readily explained in terms of miR-H2/
ICP0
ratios, because
miR-H2 is highly expressed at these time points. However, miR-H2’s weak repression of
ICP0 expression, even when overexpressed in infected 293T cells, might prevent us
from detecting a difference between the mutant virus and the WT in comparison to the
strong downregulation resulting from miR-138 overexpression. Although a mutant
virus with altered miR-138 target sites on the
ICP0
mRNA showed significantly increased
ICP0
transcript levels at 7 dpi (41; this study), the increases were only about threefold.
Therefore, it would not be surprising for a weaker repressor to display no detectable
effect.
The miR-H2-deficient mutant virus is similar to the WT for virulence and
reactivation rates.
No statistically significant difference was detected between the
MH2 mutant virus and the WT in terms of mortality or the rate of reactivation. This is
consistent with the lack of any effect on viral gene expression or viral replication in our
studies but inconsistent with the significantly increased mortality and rate of
reactiva-tion exhibited by the McK-ΔH2 mutant (37). Based on our sample sizes, our studies of
virulence and reactivation had 75% and 80% power, respectively, to detect differences
as large as those found in the Mck-ΔH2 studies. Other differences between the
Mck-ΔH2 studies and ours include mortality being followed for only 10 days in the
Mck-ΔH2 studies, differences in statistical methods used to analyze reactivation data,
and the Mck-ΔH2 rescue virus not being directly compared to the WT McKrae strain.
Regardless, the different results could be due to different viral and mouse strains.
Interestingly, a mutant with the Mck-ΔH2 miR-H2 mutations introduced into an LAT
deletion background (dLAT-ΔH2), which severely decreases miR-H2 expression during
latency (25) but has little or no effect on miR-H2 levels during acute infection or in cell
culture (25, 39), exhibited similar phenotypic changes in virulence and an even more
apparent effect on reactivation compared to the mutant in the WT McKrae background
(39). Regardless, phenotypes exhibited by miR-H2 mutant viruses would be unlikely to
be due to derepression of ICP0, as our studies have found no evidence that miR-H2
represses ICP0 expression during infection.
miR-H2 is a weak repressor of ICP0 expression.
Despite the perfect
complemen-tarity between miR-H2 and
ICP0
mRNA, our current results clearly show that, at least
relative to miR-138, miR-H2 is a weak repressor of ICP0. Localization of the miR-H2
target site within the
ICP0
coding region might account for its weak repression.
Pan et al. Journal of Virology
on November 7, 2019 by guest
http://jvi.asm.org/
Although there is evidence for miRNA binding sites in coding regions (50), in
animals, most sites demonstrated to play important roles are located within 3
=
UTRs
(reviewed in reference 24). This is thought to be related to hindered accessibility of
the RISC to miRNA binding sites in coding regions when active translation is
occurring (51). In support of this, it has been shown that most miRNA binding sites
located in coding regions only marginally reduce mRNA levels (52) and that
converting 3
=
UTRs to coding regions by modifying stop codons ablates or
dimin-ishes translation inhibition (51, 53).
A previous result that might initially seem inconsistent with our findings of low
effectiveness of miR-H2 repression of ICP0 expression is that the miR-H2 target site
exhibited more reads than the miR-138 target sites in a PAR-CLIP assay of lytically
infected cells (41). However, the cross-linking efficiency in the PAR-CLIP assay is affected
by the number of 4-thiouracil molecules incorporated into the RNA, and the two
miR-138 target sites have only one uracil between them, whereas the miR-H2 target site
has five. Also, the outcomes of CLIP analysis do not always correlate with repression
strength, as many CLIP-identified miRNA binding sites have been found not to mediate
repression (54).
What role can miR-H2 play? Although our results failed to detect a biological
function for miR-H2, we note that the miR-H2 seed region (but not the entire sequence)
is conserved between HSV-1 and HSV-2 (4, 55) and that miR-H2 is highly expressed
during latency (3, 4, 25), suggesting that it may have a role to play, more likely during
latency and, perhaps, reactivation than during lytic infection, including acute infection
in vivo
. We acknowledge that our mouse model does not fully recapitulate HSV-1
infection and disease in humans, so it might not capture important roles for miR-H2.
That said, it is possible that as a fine tuner of ICP0 expression, miR-H2 may serve as a
backup latency stabilizing factor, and its loss may be inconsequential in the presence
of redundant mechanisms or its effects are too small to be detected in the context of
highly variable gene expression data. Another possibility is that miR-H2 could act by
targeting genes other than
ICP0
that affect aspects of latency other than repression of
lytic gene expression, such as maintaining neuronal survival. For example, the defects
in DNA synthesis reported for the 17syn
⫹
mH2 mutant might be due to targets other
than ICP0, as suggested previously (38). Future efforts focusing on targets of miR-H2
other than ICP0 and on how products of the
LAT
locus other than miR-H2 repress lytic
gene expression may be fruitful.
MATERIALS AND METHODS
Cells and viruses.Vero, 293T, and Neuro-2A cells were maintained as previously described (41). NoDice cells (clone number 4-25) (42) were a generous gift of Bryan Cullen (Duke University) and were maintained in Dulbecco’s modified Eagle’s medium (DMEM) supplemented with 10% fetal bovine serum (FBS) at 37°C in 5% CO2. Bacterial artificial chromosome (BAC)-derived WT, MH2, and RH2 viruses
(described below) were used for all infections, except that the miR-H2 expression time course analysis used HSV-1 strain KOS. Standard protocols were used to prepare and propagate viruses and for infection and plaque assays (56).
Plasmids.The ICP0-expressing plasmid (pRS-1) was described previously (41). The pRS-1MH2 plasmid was created using a QuikChange site-directed mutagenesis kit (Agilent) and two primers (primer 1, CGCCGTGTGCCCCAGAGTCATAGCAGTTTAGCTCAGGCCGCGAACC, and primer 2, GGTTCGCGGCCTGAGC TAAACTGCTATGACTCTGGGGCACACGGCG; mutated sequences are in boldface), following the manu-facturer’s protocol.
Transfections.All transfections were performed in 24-well plates using Lipofectamine 2000 (Thermo Fisher) according to the manufacturer’s instructions. For transfection of pRS-1 or pRS-1MH2 alone into 293T or NoDice cells, 150 ng of a plasmid was added per well. For cotransfection, 75 ng of pRS-1 plasmid was transfected into 293T cells in each well together with the indicated concentration of miScript miR-H2, miR-138, or an irrelevant control mimic (from Qiagen). The control mimic has the following sequence: GGCACGUCAGUAGCGGUUAGGUU. In the experiment whose results are shown in Fig. 1B, 20 nM miR-H2 inhibitor or control inhibitor (kindly provided by Nelson Chau of Regulus Therapeutics, Inc., San Diego, CA) was also added. The miR-H2 inhibitor was completely complementary to miR-H2-3p, while the control was a version of an inhibitor of miR-155 with six base mutations. Transfected cells were harvested 24 or 30 h posttransfection (hpt), as indicated in the figure legends, for Western blot and RNA analyses. For the transfection-infection experiment, 293T cells in each well of a 24-well plate were transfected with 16 nM control, miR-H2, or miR-138 mimic. Twenty-four hours
on November 7, 2019 by guest
http://jvi.asm.org/
later, the cells were infected with WT virus at an MOI of 0.1 for 24 or 48 h before being harvested for Western blot analyses.
Western blot analyses.Western blotting was performed as described previously (57). The following antibodies and dilutions were used: ICP0 mouse monoclonal antibody (Abcam), 1:5,000; ICP27 mouse monoclonal antibody (Virusys), 1:1,000; TK mouse monoclonal antibody (a generous gift from Bill Summers, Yale University), 1:1,000; gC mouse monoclonal antibody (Fitzgerald), 1:1,000;-actin mono-clonal antibody (Sigma), 1:10,000; and horseradish peroxidase (HRP)-conjugated goat mouse anti-serum (SouthernBiotech), 1:2,000.
Quantitative PCR and RT-PCR.To quantify mRNA in transfected 293T or NoDice cells or in infected Vero cells (MOI of 10), RNA was isolated using an RNeasy minikit (Qiagen). To quantify viral genomes and transcripts in mouse TGs, DNA and RNA were isolated using an AllPrep DNA/RNA minikit (Qiagen). Reverse transcription (RT) was performed using a QuantiTect RT kit (Qiagen) and specific primers described previously (41). The manufacturer’s instructions were followed in all these cases. Previously described SYBR green PCR assays were used to quantify viral genomic DNA, theLATintron, andICP0, ICP27,ICP4,tk, andgCtranscripts, as well as mouse and humanGAPDH(encoding glyceraldehyde-3-phosphate dehydrogenase) transcripts (41). Viral transcript levels were normalized toGAPDHtranscript levels. For miRNA quantification, total RNA from cells or tissues was purified using an RNeasyPlus minikit (Qiagen), following the protocol to retain small RNAs provided by the manufacturer. miR-H2, “miR-MH2,” and let-7a levels were evaluated by qRT-PCR using the TaqMan microRNA reverse transcription kit and TaqMan gene expression master mix (Applied Biosystems) according to the manufacturer’s instructions. The primers and probes used for the miR-H2 and let-7a assays have been described previously (3). The “miR-MH2” assay utilized the same reverse primer as those assays along with the following oligomers: TCGTATCCAGTGCAGGGTCCGAGGTATTCGCACTGGATACGACAGAGTC (stem-loop primer), TCATAACCTGA GCTAAACTGCT (forward primer), and 6-FAM-TACGACAGAGTCATA-MGB-NFQ (TaqMan probe [6-FAM is 6-carboxyfluorescein]; Applied Biosystems). The viral miRNA levels were normalized to the let-7a levels. For all qRT-PCR assays, RNAs were quantified using standard curves with serially diluted RNA (synthetic mimics for miRNA,in vitrotranscripts for mRNA, and total RNA forGAPDH).
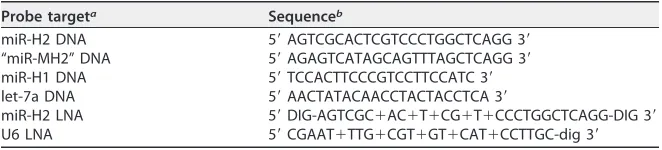
Northern blot analyses.From 293T or NoDice cells transfected with 150 ng of pRS-1 or pRS-1-MH2 plasmid as described above or from 293T cells infected with WT or MH2 viruses at an MOI of 10 for 18 h, RNA less than 200 nucleotides long was isolated using a mirVana miRNA isolation kit (Ambion) according to the manufacturer’s instructions. Northern blot analyses of RNA from infected cells were performed as described previously (25). For transfected cells, we used a nonradioactive method, following a protocol (58) for the design of locked-nucleic acid (LNA) probes, denaturing polyacrylamide gel electrophoresis, transfer to a nylon membrane, and 1-ethyl-3-(3-dimethylaminopropyl) carbodiimide cross-linking. The LNA probes were synthesized and labeled with digoxigenin (DIG) at both ends by Exiqon. The membrane was prehybridized in 10 ml of ULTRAhyb ultrasensitive hybridization buffer (Ambion) at 60°C for 30 min, hybridized with the labeled probe at 60°C overnight, and then washed twice with 2⫻SSC (1⫻SSC is 0.15 M NaCl plus 0.015 M sodium citrate) plus 0.1% SDS for 15 min each and three times with 0.1⫻SSC plus 0.1% SDS for 15 min each at 60°C. Block, wash, and development buffers for the following steps were provided in a DIG wash and block buffer set (Roche). The membrane was blocked using block buffer for 1 h, incubated with anti-digoxigenin-alkaline phosphatase (AP) antibody (1:15,000, Roche) in block buffer for 30 min, and washed 4 times (10 min each) with wash buffer at room temperature. Images were visualized after applying the alkaline phosphatase substrate CDP-Star (Roche) diluted 100-fold in development buffer and exposed to X-ray films. For multiple hybridizations of the same membranes, membranes were stripped by two incubations (10 min each) at 100°C with 0.1% SDS and 5 mM EDTA before being probed with another digoxigenin-labeled LNA probe. The probes used for Northern blot hybridizations are listed in Table 1.
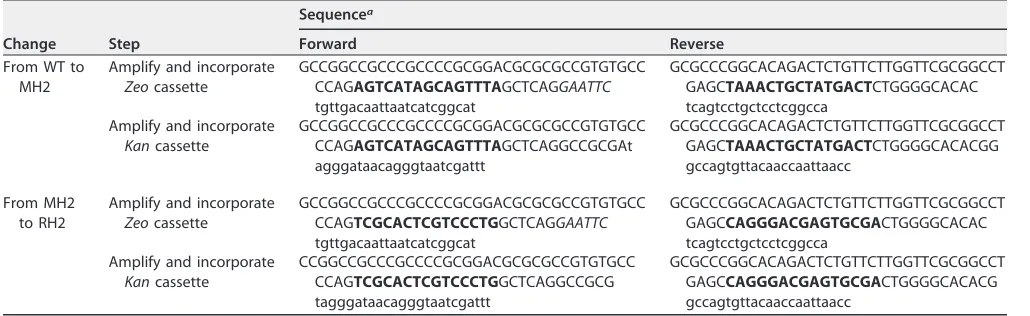
[image:14.585.41.372.82.157.2]Construction of MH2 and RH2 viruses.A BAC containing WT HSV-1 strain KOS, referred to herein as WT BAC was described previously (57). Using the procedures summarized below, the MH2 mutations (same as in pRS-1MH2) were introduced into WT BAC to generate MH2 BAC. Then, WT sequences were introduced back into the MH2 BAC to generate RH2 BAC. Procedures to introduce mutations into the repeat regions of the viral genome in the BACs have been described elsewhere (41). Briefly, the sequence to be mutated in one copy ofICP0(copy 1) was replaced with a zeocin resistance (Zeo) cassette and that in the other copy (copy 2) was replaced with a kanamycin resistance (Kan) cassette designed to introduce the mutations in a scarless manner using two-step Red-mediated recombination (59). After copy 2 was mutated,Zeoin copy 1 was replaced with theKancassette, permitting the introduction of the same mutations into copy 1. The primers used to amplify and incorporate theZeoandKancassettes and the
TABLE 1Sequences of Northern blot probes
Probe targeta Sequenceb
miR-H2 DNA 5=AGTCGCACTCGTCCCTGGCTCAGG 3=
“miR-MH2” DNA 5=AGAGTCATAGCAGTTTAGCTCAGG 3=
miR-H1 DNA 5=TCCACTTCCCGTCCTTCCATC 3=
let-7a DNA 5=AACTATACAACCTACTACCTCA 3=
miR-H2 LNA 5=DIG-AGTCGC⫹AC⫹T⫹CG⫹T⫹CCCTGGCTCAGG-DIG 3=
U6 LNA 5=CGAAT⫹TTG⫹CGT⫹GT⫹CAT⫹CCTTGC-dig 3=
aLNA, locked nucleic acid.
bDIG, digoxigenin labeling;⫹N, modified residue in LNA.
Pan et al. Journal of Virology
on November 7, 2019 by guest
http://jvi.asm.org/
accompanying MH2 and RH2 sequence changes into the HSV-1 genome are listed in Table 2. The BACs resulting from each step were verified by sequencing using primers spanning the mutation site (forward, GACCCCATAGTGATCAGCGACTCC, and reverse, TTTTCCTGGCCCGACCCGCGCCTCTT), as well as by tion fragment length polymorphism using restriction endonucleases EcoRI and HindIII. A unique restric-tion product pattern is seen wheneverZeoorKanis inserted into the genome, due to the existence of a HindIII restriction site inKanand an EcoRI restriction site inserted into the 5=end ofZeo. To generate viruses, the WT, MH2, and RH2 BACs were separately transfected into Vero cells using Lipofectamine 2000 (ThermoFisher) following the manufacturer’s instructions. The sequences surrounding the mutation site in the virus stocks were confirmed by sequencing the PCR products generated by the above-described primers.
Gel fractionation to isolate miRNA.We previously isolated mature miRNA using the flashPAGE fractionator and disposable gels (Ambion); however, those products have been discontinued. As we have found that certain stem-loop qRT-PCR assays efficiently detect larger species, such as pre-miRNAs, that contain the miRNA sequences (M. F. Kramer and J. M. Pesola, unpublished results), we modified a published protocol (60) as described below in order to isolate miRNA for the experiment to measure the effects of the MH2 mutations on miRNA expression by qRT-PCR. Samples of total RNA (purified as described above for miRNA quantification) and DynaMarker prestained RNA marker (DiagnoCine) were resolved on 15% Tris-borate-EDTA (TBE)-urea polyacrylamide gels (Invitrogen) in nonadjacent lanes. The portion of each gel lane corresponding to RNA lengths of approximately 18 to 28 bases was excised with a clean scalpel and sliced in half lengthwise. To elute the RNA, gel pieces were sieved through a gel breaker tube (IST Engineering), mixed with 320l of 0.3 M NaCl, frozen on dry ice, thawed, and left to shake at room temperature for 7 h. The mixture was spun through a 5-m filter tube (IST Engineering), and RNA in the filtrate was precipitated in 75% ethanol with 5-g/ml linear acrylamide (Ambion) as the carrier, washed with 80% ethanol, air dried for 8 min, and resuspended in 12l of water.
Animal procedures. The animal housing and experimental procedures were approved by the Institutional Animal Care and Use Committee of Harvard Medical School in accordance with federal guidelines. Seven-week-old male CD-1 mice (Charles River Laboratories) were anesthetized by intraper-itoneal injection of 100 mg/kg of body weight of ketamine (Fort Dodge Animal Health) and 10 mg/kg of xylazine (Lloyd Laboratories). Three microliters of virus, corresponding to one of the doses indicated in the legend to Fig. 5 or Fig. 6, was dropped onto each scarified cornea. Mortality figures include mice that had died and those that were moribund and therefore euthanized. For TG acquisition, mice were sacrificed by cervical dislocation while anesthetized with 3% isoflurane in oxygen with a flow rate of 0.5 ml/min using an anesthesia machine (Colonial Medical Supply). For nucleic acid extraction, TGs were rapidly removed and placed on dry ice before storing at⫺80°C.
Reactivation assays.TGs removed from mice at 30 dpi were placed immediately in DMEM supple-mented with 10% FBS on ice. After finishing dissection of all TGs, the medium with TGs was transferred onto monolayers of Vero cells in 12-well plates and incubated at 37°C for 12 days. Each day until cytopathic effects in the reactivating wells were obvious, 50-l aliquots of medium were harvested from each well and stored at⫺80°C. The presence of infectious virus in the daily aliquots was determined by adding the medium to confluent 24-well plates containing Vero cells and monitoring for cytopathic effects over 4 days.
[image:15.585.40.555.83.241.2]Statistical analyses.Statistical analyses were performed using Prism 6 and StatMate 2.0 (GraphPad). The mRNA levels in transfected cells were analyzed by two-tailed pairedttest for comparisons of two groups or by one-way analysis of variance (ANOVA) with Bonferroni’s multiple-comparison test for comparisons of three groups. The viral titers and levels of DNA and RNA were analyzed by one-way ANOVA with Bonferroni’s multiple-comparison test, except that lytic transcript levels in 30-dpi TG samples were analyzed by Kruskal-Wallis test. The percentages of TGs exhibiting detectable lytic transcripts were analyzed by Fisher’s exact test. The numbers of mice infected for evaluation of mortality
TABLE 2Primers used to construct MH2 and RH2 BACs
Change Step
Sequencea
Forward Reverse
From WT to MH2
Amplify and incorporate
Zeocassette
GCCGGCCGCCCGCCCCGCGGACGCGCGCCGTGTGCC CCAGAGTCATAGCAGTTTAGCTCAGGAATTC
tgttgacaattaatcatcggcat
GCGCCCGGCACAGACTCTGTTCTTGGTTCGCGGCCT GAGCTAAACTGCTATGACTCTGGGGCACAC tcagtcctgctcctcggcca
Amplify and incorporate
Kancassette
GCCGGCCGCCCGCCCCGCGGACGCGCGCCGTGTGCC CCAGAGTCATAGCAGTTTAGCTCAGGCCGCGAt agggataacagggtaatcgattt
GCGCCCGGCACAGACTCTGTTCTTGGTTCGCGGCCT GAGCTAAACTGCTATGACTCTGGGGCACACGG gccagtgttacaaccaattaacc
From MH2 to RH2
Amplify and incorporate
Zeocassette
GCCGGCCGCCCGCCCCGCGGACGCGCGCCGTGTGCC CCAGTCGCACTCGTCCCTGGCTCAGGAATTC
tgttgacaattaatcatcggcat
GCGCCCGGCACAGACTCTGTTCTTGGTTCGCGGCCT GAGCCAGGGACGAGTGCGACTGGGGCACAC tcagtcctgctcctcggcca
Amplify and incorporate
Kancassette
CCGGCCGCCCGCCCCGCGGACGCGCGCCGTGTGCC CCAGTCGCACTCGTCCCTGGCTCAGGCCGCG tagggataacagggtaatcgattt
GCGCCCGGCACAGACTCTGTTCTTGGTTCGCGGCCT GAGCCAGGGACGAGTGCGACTGGGGCACACG gccagtgttacaaccaattaacc
aLowercase letters are the sequences overlapping theZeo or Kangene. Letters in italics are the introduced EcoRI restriction sites. Letters in boldface indicate the
mutated regions.
on November 7, 2019 by guest
http://jvi.asm.org/
and reactivation rates were chosen to provide 75% to 85% statistical power to detect differences at least as large as those reported in another research group’s study (37). Survival curves and reactivation kinetics were analyzed by the log-rank (Mantel-Cox) test.
ACKNOWLEDGMENTS
We thank the following investigators for generous provision of reagents: Bryan
Cullen (Duke University) for the NoDice cell line, Bill Summers (Yale University) for
anti-TK antibody, and Nelson Chau (Regulus Therapeutics, Inc.) for the miRNA
inhibitors.
This work was supported by grants from the National Institutes of Health (grants R21
AI105896 and P01 AI098681) to D.M.C. and startup funds from Zhejiang University to
D.P. The funders had no role in study design, data collection and interpretation, or the
decision to submit the work for publication.
D.P. and D.C. conceived the study and drafted the manuscript; D.P., J.M.P., G.L., and
S.M. acquired the data; and all authors analyzed and interpreted data, critically revised
the manuscript, approved it, and agreed to be accountable for it.
REFERENCES
1. Roizman B, Knipe DM, Whitley RJ. 2013. Herpes simplex virus, p 1823–1897.InKnipe DM, Howley PM, Cohen JI, Griffin DE, Lamb RA, Martin MA, Racianello VR, Roizman B (ed), Fields virology, 6th ed. Lip-pincott Williams & Wilkins, Philadelphia, PA.
2. Stevens JG, Wagner EK, Devi-Rao GB, Cook ML, Feldman LT. 1987. RNA complementary to a herpesvirus alpha gene mRNA is prominent in latently infected neurons. Science 235:1056 –1059.
3. Umbach JL, Kramer MF, Jurak I, Karnowski HW, Coen DM, Cullen BR. 2008. MicroRNAs expressed by herpes simplex virus 1 during latent infection regulate viral mRNAs. Nature 454:780 –783. https://doi.org/ 10.1038/nature07103.
4. Jurak I, Kramer MF, Mellor JC, van Lint AL, Roth FP, Knipe DM, Coen DM. 2010. Numerous conserved and divergent microRNAs expressed by herpes simplex viruses 1 and 2. J Virol 84:4659 – 4672. https://doi.org/ 10.1128/JVI.02725-09.
5. Umbach JL, Nagel MA, Cohrs RJ, Gilden DH, Cullen BR. 2009. Analysis of human alphaherpesvirus microRNA expression in latently infected hu-man trigeminal ganglia. J Virol 83:10677–10683. https://doi.org/10.1128/ JVI.01185-09.
6. Garber DA, Schaffer PA, Knipe DM. 1997. A LAT-associated function reduces productive-cycle gene expression during acute infection of murine sensory neurons with herpes simplex virus type 1. J Virol 71: 5885–5893.
7. Chen SH, Kramer MF, Schaffer PA, Coen DM. 1997. A viral function represses accumulation of transcripts from productive-cycle genes in mouse ganglia latently infected with herpes simplex virus. J Virol 71: 5878 –5884.
8. Nicoll MP, Hann W, Shivkumar M, Harman LE, Connor V, Coleman HM, Proenca JT, Efstathiou S. 2016. The HSV-1 latency-associated transcript functions to repress latent phase lytic gene expression and suppress virus reactivation from latently infected neurons. PLoS Pathog 12: e1005539. https://doi.org/10.1371/journal.ppat.1005539.
9. Perng GC, Jones C, Ciacci-Zanella J, Stone M, Henderson G, Yukht A, Slanina SM, Hofman FM, Ghiasi H, Nesburn AB, Wechsler SL. 2000. Virus-induced neuronal apoptosis blocked by the herpes simplex virus latency-associated transcript. Science 287:1500 –1503. https://doi.org/ 10.1126/science.287.5457.1500.
10. Thompson RL, Sawtell NM. 2001. Herpes simplex virus type 1 latency-associated transcript gene promotes neuronal survival. J Virol 75: 6660 – 6675. https://doi.org/10.1128/JVI.75.14.6660-6675.2001. 11. Inman M, Perng GC, Henderson G, Ghiasi H, Nesburn AB, Wechsler SL,
Jones C. 2001. Region of herpes simplex virus type 1 latency-associated transcript sufficient for wild-type spontaneous reactivation promotes cell survival in tissue culture. J Virol 75:3636 –3646. https://doi.org/ 10.1128/JVI.75.8.3636-3646.2001.
12. Ahmed M, Lock M, Miller CG, Fraser NW. 2002. Regions of the herpes simplex virus type 1 latency-associated transcript that protect cells from apoptosis in vitro and protect neuronal cells in vivo. J Virol 76:717–729. https://doi.org/10.1128/JVI.76.2.717-729.2002.
13. Branco FJ, Fraser NW. 2005. Herpes simplex virus type 1 latency-associated transcript expression protects trigeminal ganglion neurons
from apoptosis. J Virol 79:9019 –9025. https://doi.org/10.1128/ JVI.79.14.9019-9025.2005.
14. Jiang X, Chentoufi AA, Hsiang C, Carpenter D, Osorio N, BenMohamed L, Fraser NW, Jones C, Wechsler SL. 2011. The herpes simplex virus type 1 latency-associated transcript can protect neuron-derived C1300 and Neuro2A cells from granzyme B-induced apoptosis and CD8 T-cell kill-ing. J Virol 85:2325–2332. https://doi.org/10.1128/JVI.01791-10. 15. Leib DA, Bogard CL, Kosz-Vnenchak M, Hicks KA, Coen DM, Knipe DM,
Schaffer PA. 1989. A deletion mutant of the latency-associated transcript of herpes simplex virus type 1 reactivates from the latent state with reduced frequency. J Virol 63:2893–2900.
16. Thompson RL, Sawtell NM. 2011. The herpes simplex virus type 1 latency associated transcript locus is required for the maintenance of reactiva-tion competent latent infecreactiva-tions. J Neurovirol 17:552–558. https:// doi.org/10.1007/s13365-011-0071-0.
17. Perng GC, Dunkel EC, Geary PA, Slanina SM, Ghiasi H, Kaiwar R, Nesburn AB, Wechsler SL. 1994. The latency-associated transcript gene of herpes simplex virus type 1 (HSV-1) is required for efficient in vivo spontaneous reactivation of HSV-1 from latency. J Virol 68:8045– 8055.
18. Trousdale MD, Steiner I, Spivack JG, Deshmane SL, Brown SM, MacLean AR, Subak-Sharpe JH, Fraser NW. 1991. In vivo and in vitro reactivation impairment of a herpes simplex virus type 1 latency-associated tran-script variant in a rabbit eye model. J Virol 65:6989 – 6993.
19. Block TM, Deshmane S, Masonis J, Maggioncalda J, Valyi-Nagi T, Fraser NW. 1993. An HSV LAT null mutant reactivates slowly from latent infection and makes small plaques on CV-1 monolayers. Virology 192: 618 – 630. https://doi.org/10.1006/viro.1993.1078.
20. Cliffe AR, Garber DA, Knipe DM. 2009. Transcription of the herpes simplex virus latency-associated transcript promotes the formation of facultative heterochromatin on lytic promoters. J Virol 83:8182– 8190. https://doi.org/10.1128/JVI.00712-09.
21. Wang QY, Zhou C, Johnson KE, Colgrove RC, Coen DM, Knipe DM. 2005. Herpesviral latency-associated transcript gene promotes assembly of heterochromatin on viral lytic-gene promoters in latent infection. Proc Natl Acad Sci U S A 102:16055–16059. https://doi.org/10.1073/ pnas.0505850102.
22. Giordani NV, Neumann DM, Kwiatkowski DL, Bhattacharjee PS, McAnany PK, Hill JM, Bloom DC. 2008. During herpes simplex virus type 1 infection of rabbits, the ability to express the latency-associated transcript in-creases latent-phase transcription of lytic genes. J Virol 82:6056 – 6060. https://doi.org/10.1128/JVI.02661-07.
23. Srivastava R, Dervillez X, Khan AA, Chentoufi AA, Chilukuri S, Shukr N, Fazli Y, Ong NN, Afifi RE, Osorio N, Geertsema R, Nesburn AB, Wechsler SL, BenMohamed L. 2016. The herpes simplex virus latency-associated transcript gene is associated with a broader repertoire of virus-specific exhausted CD8⫹T cells retained within the trigeminal ganglia of la-tently infected HLA transgenic rabbits. J Virol 90:3913–3928. https:// doi.org/10.1128/JVI.02450-15.
24. Bartel DP. 2009. MicroRNAs: target recognition and regulatory functions. Cell 136:215–233. https://doi.org/10.1016/j.cell.2009.01.002.
25. Kramer MF, Jurak I, Pesola JM, Boissel S, Knipe DM, Coen DM. 2011.
Pan et al. Journal of Virology
on November 7, 2019 by guest
http://jvi.asm.org/
Herpes simplex virus 1 microRNAs expressed abundantly during latent infection are not essential for latency in mouse trigeminal ganglia. Virology 417:239 –247. https://doi.org/10.1016/j.virol.2011.06.027. 26. Jurak I, Hackenberg M, Kim JY, Pesola JM, Everett RD, Preston CM, Wilson
AC, Coen DM. 2014. Expression of herpes simplex virus 1 microRNAs in cell culture models of quiescent and latent infection. J Virol 88: 2337–2339. https://doi.org/10.1128/JVI.03486-13.
27. Lanfranca MP, Mostafa HH, Davido DJ. 2014. HSV-1 ICP0: an E3 ubiquitin ligase that counteracts host intrinsic and innate immunity. Cells 3:438 – 454. https://doi.org/10.3390/cells3020438.
28. Lukashchuk V, Everett RD. 2010. Regulation of ICP0-null mutant herpes simplex virus type 1 infection by ND10 components ATRX and hDaxx. J Virol 84:4026 – 4040. https://doi.org/10.1128/JVI.02597-09.
29. Roizman B, Zhou G, Du T. 2011. Checkpoints in productive and latent infections with herpes simplex virus 1: conceptualization of the issues. J Neurovirol 17:512–517. https://doi.org/10.1007/s13365-011-0058-x. 30. Orzalli MH, DeLuca NA, Knipe DM. 2012. Nuclear IFI16 induction of IRF-3
signaling during herpesviral infection and degradation of IFI16 by the viral ICP0 protein. Proc Natl Acad Sci U S A 109:E3008 –E3017. https:// doi.org/10.1073/pnas.1211302109.
31. Jurak I, Silverstein LB, Sharma M, Coen DM. 2012. Herpes simplex virus is equipped with RNA- and protein-based mechanisms to repress ex-pression of ATRX, an effector of intrinsic immunity. J Virol 86: 10093–10102. https://doi.org/10.1128/JVI.00930-12.
32. Cai W, Astor TL, Liptak LM, Cho C, Coen DM, Schaffer PA. 1993. The herpes simplex virus type 1 regulatory protein ICP0 enhances virus replication during acute infection and reactivation from latency. J Virol 67:7501–7512.
33. Cai W, Schaffer PA. 1992. Herpes simplex virus type 1 ICP0 regulates expression of immediate-early, early, and late genes in productively infected cells. J Virol 66:2904 –2915.
34. Chen J, Silverstein S. 1992. Herpes simplex viruses with mutations in the gene encoding ICP0 are defective in gene expression. J Virol 66: 2916 –2927.
35. Halford WP, Schaffer PA. 2001. ICP0 is required for efficient reactivation of herpes simplex virus type 1 from neuronal latency. J Virol 75: 3240 –3249. https://doi.org/10.1128/JVI.75.7.3240-3249.2001.
36. Thompson RL, Sawtell NM. 2006. Evidence that the herpes simplex virus type 1 ICP0 protein does not initiate reactivation from latency in vivo. J Virol 80:10919 –10930. https://doi.org/10.1128/JVI.01253-06.
37. Jiang X, Brown D, Osorio N, Hsiang C, Li L, Chan L, BenMohamed L, Wechsler SL. 2015. A herpes simplex virus type 1 mutant disrupted for microRNA H2 with increased neurovirulence and rate of reactivation. J Neurovirol 21:199 –209. https://doi.org/10.1007/s13365-015-0319-1. 38. Flores O, Nakayama S, Whisnant AW, Javanbakht H, Cullen BR, Bloom DC.
2013. Mutational inactivation of herpes simplex virus 1 microRNAs identifies viral mRNA targets and reveals phenotypic effects in culture. J Virol 87:6589 – 6603. https://doi.org/10.1128/JVI.00504-13.
39. Jiang X, Brown D, Osorio N, Hsiang C, BenMohamed L, Wechsler SL. 2016. Increased neurovirulence and reactivation of the herpes simplex virus type 1 latency-associated transcript (LAT)-negative mutant dLAT2903 with a disrupted LAT miR-H2. J Neurovirol 22:38 – 49. https://doi.org/ 10.1007/s13365-015-0362-y.
40. Tang S, Patel A, Krause PR. 2009. Novel less-abundant viral microRNAs encoded by herpes simplex virus 2 latency-associated transcript and their roles in regulating ICP34.5