Partially Mixed Selectivity and
Parietal Cortex
Thesis by
Carey Y. Zhang
In Partial Fulfillment of the Requirements for the
degree of
Doctor of Philosophy
CALIFORNIA INSTITUTE OF TECHNOLOGY
Pasadena, California
2018
Copyright
2018
Carey Y. Zhang
Acknowledgements
I would like to thank my advisor, Richard Andersen, for granting me the opportunity to do this work, providing an excellent research environment, and giving wise advice and
recommendations. I would also like to thank Tyson Aflalo. His detailed guidance and friendship were invaluable to my growth and experience in the lab. I would like to thank participant NS for her time and patience, providing rich and interesting data to study.
I would like to thank Vasileios Christopoulos, Sofia Sakellaridi, Spencer Kellis, Boris Revechkis, Christian Klaes, Michelle Armenta Salas, Luke Bashford, Sumner Norman, Matiar Jafari,
HyeongChan Jo, and Srinivas Chivukula for enjoyable and productive discussions, Kelsie Pejsa for administrative assistance, and Viktor Shcherbatyuk for technical assistance.
Additional thanks to the National Institutes of Health, the Boswell Foundation, and the Tianqiao and Chrissy Chen Institute for Neuroscience for providing the funding that supported this work.
Dedication
I dedicate this thesis to my mother and father for all they have done to raise and support me, ultimately making this undertaking possible. Without your care, I would not be who or where I am today.
Abstract
Brain-machine interfaces (BMIs) decode intention signals and other variables from the brain in order to control a computer, tablet, or prosthetic limb. In order to improve the technology, a better understanding of the representational mechanisms within the brain is necessary. Here we study how the anterior intraparietal area (AIP) of human posterior parietal cortex is able to represent many variables within a small patch of cortex. We record single unit activity using a 4 x 4 mm microelectrode array implanted in AIP of a human tetraplegic volunteer. Testing
movements of different cognitive strategies, body parts, and body sides, we find that the neural population represents information in a high-dimensional way, termed “mixed selectivity”, with individual units coding for idiosyncratic combinations of variables. Furthermore, we find that the variables are not randomly mixed but exhibited “partially mixed selectivity” with certain
Published Content and Contributions
Zhang, C.Y. et. al. (2017). Partially Mixed Selectivity in Human Posterior Parietal Association Cortex. Neuron 95, 697-708. doi: 10.1016/j.neuron.2017.06.040. url:
http://www.cell.com/neuron/abstract/S0896-6273(17)30592-5
Table of Contents
Acknowledgements... iii
Dedication ... iii
Abstract ... iv
Published Content and Contributions ... v
Table of Contents ... vi
List of Illustrations and/or Tables ... ix
Supplemental Illustrations ... ix
Nomenclature ... x
1 Introduction ... 1
2 Background ... 5
2.1 Brain-Machine Interfaces ... 5
2.2 Posterior Parietal Cortex (PPC) ... 9
2.3 Mixed Coding ... 13
2.4 Mirror Neurons ... 17
3 Partially Mixed Representations in Posterior Parietal Cortex ... 21
3.1 Introduction ... 21
3.2 Methods ... 24
3.2.1 Experimental Model and Subject Details ... 24
3.2.2 Behavioral setup ... 25
3.2.3 Physiological recordings ... 25
3.2.4 Task procedure ... 26
3.2.5 Unit selection ... 28
3.2.6 Linear analysis 1 ... 28
3.2.7 AUC analysis ... 29
3.2.8 Linear analysis 2 ... 30
3.2.9 Test of population bias in representing motor variables ... 30
3.2.10 Degree of specificity ... 31
3.2.11 Correlation between representations ... 32
3.2.12 Decoder analysis ... 32
3.2.13 Condition classification ... 33
3.2.14 Unit quality classification ... 34
3.4 Discussion... 48
3.4.1 Effector specificity in PPC. ... 49
3.4.2 Asymmetric coding of motor variables and functional segregation of body parts .. 51
3.4.3 Attempted and imagined movements in human AIP after long-term injury ... 54
3.4.4 Orofacial coding in human AIP ... 56
4 Mixed representations in closed-loop cortical control ... 57
4.1 Introduction ... 57
4.2 Methods ... 59
4.2.1 Subject Details ... 59
4.2.2 Experimental Setup ... 60
4.2.3 Experimental Design ... 60
4.2.4 Signal Recording Procedures ... 63
4.2.5 Decoding Procedures ... 64
4.2.6 Statistical Analysis ... 65
4.2.7 Unit Selection... 66
4.2.8 Linear Model Analysis for Single-Unit Characterization ... 66
4.2.9 Degree of Specificity ... 66
4.2.10 Maintenance of Single-unit Tuning from Training to Online Control ... 67
4.2.11 Correlation between Neural Representations... 68
4.2.12 Comparison of Representations Between Training and Online Control ... 68
4.2.13 Analysis to Control for Order Effect Confound ... 69
4.2.14 Neural Performance ... 70
4.2.15 Behavioral Performance Metrics ... 72
4.3 Results ... 73
4.3.1 Representations during Training and Online Control ... 73
4.3.2 Comparison of movement conditions and online control performance ... 86
4.4 Discussion... 90
4.4.1 Consistency of representations from training to online control ... 90
4.4.2 Performance differences of different effectors during online control ... 94
5 Sensory mirroring responses and mixed representations ... 96
5.1 Introduction ... 96
5.2 Methods ... 98
5.2.2 Experimental Setup ... 98
5.2.3 Video Recordings ... 99
5.2.4 Signal Recordings ... 99
5.2.5 Experimental Design ... 100
5.2.6 Unit Selection... 104
5.2.7 Linear Analysis and Single Unit Tuning ... 104
5.2.8 Degree of Specificity ... 105
5.2.9 Confusion Matrix ... 106
5.2.10 ANOVA Analysis ... 106
5.2.11 Principal Component Analysis (PCA) ... 107
5.2.12 Correlation of Neural Responses ... 108
5.2.13 Hierarchical Clustering or Neural Responses... 108
5.2.14 Cross Decoding ... 109
5.2.15 Number of Units Invariant Analysis ... 110
5.3 Results ... 110
5.3.1 Sensory Mirroring ... 110
5.3.2 Tactile Receptive Fields ... 119
5.3.3 Tuning to Action Concepts ... 122
5.3.4 Effects of Video vs Live Action ... 125
5.3.5 Effects of Fixation vs Free Gaze ... 127
5.4 Discussion... 131
5.4.1 Mixed Coding and Sensory Mirroring ... 131
5.4.2 Differences between Live Action and Video ... 134
6 Conclusion ... 138
7 References ... 142
8 Appendix ... 153
8.1 Supplementary Data ... 153
8.2 Supplementary Videos ... 157
List of Illustrations and/or Tables
Figure 3.1. Neurons in PPC Exhibit Mixed Selectivity to Movement Variables ... 36
Figure 3.2. Significant Tuning to Each Movement Condition ... 38
Figure 3.3. Possible Organizational Models of Neural Representations ... 40
Figure 3.4. Specificity of Coding for Motor Variables ... 42
Figure 3.5. Functional Relationships between Movement Conditions ... 43
Figure 3.6. Segregation by Body Part ... 45
Figure 3.7. Representations of Variables Generalize across Side and Strategy, not Body Part .... 47
Figure 3.8. All Movement Variables Decodable from the Population ... 48
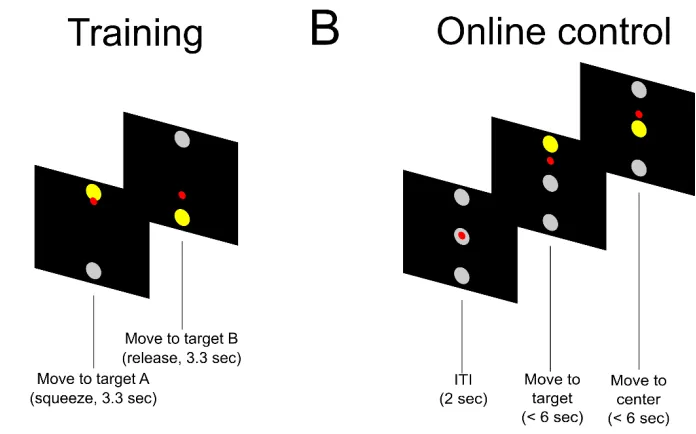
Figure 4.1. Experimental Paradigm ... 74
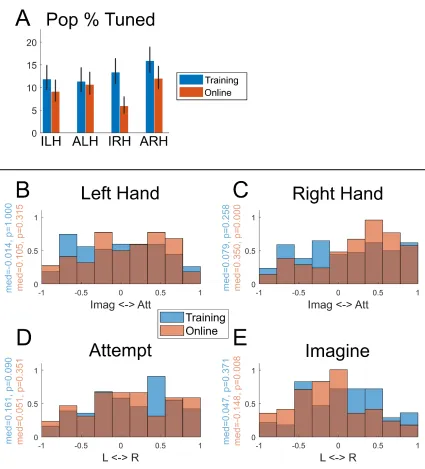
Figure 4.2. Population Tuning to the Movement Conditions ... 76
Figure 4.3. Consistency of Representations between Training and Online Control ... 77
Figure 4.4. Possible Configurations and Corresponding Expected Analysis Results ... 79
Figure 4.5. Maintenance of the Structure of the Representations... 82
Figure 4.6. Maintenance of Representations split by Tuning Preference ... 85
Figure 4.7. Online Control Performance ... 88
Figure 5.1. Overlapping Populations Tuned to Felt and Observed Sensations... 112
Figure 5.2. Sensory Mirroring Responses ... 114
Figure 5.3. Representations Organized by Body Part ... 117
Figure 5.4. Tactile Receptive Fields ... 120
Figure 5.5. Effect of Action Observation ... 124
Figure 5.6. Effect of Presentation Format (Live Action vs Video) ... 127
Figure 5.7. Effect of Fixation Condition (Free Gaze vs Fixation) ... 130
Supplemental Illustrations
Figure S 1. Using only high-quality single units or multi-units does not qualitatively change results ... 153Figure S 2. Metrics of single unit cluster isolation quality ... 154
Figure S 3. P-values from two-sided Wilcoxon rank sum tests of whether the fraction of the population tuned to each condition or the AUC values for each condition are significantly different ... 155
Figure S 4. AUC of units for each condition is comparable between excitatory (positively tuned) and inhibitory (negatively tuned) units ... 156
Nomenclature
AIP: Anterior intraparietal area.
Anatomical segregation: Division of the population based on physical neurons/units.
Attempted movements: Movements where the participant actually tries to engage the muscles (regardless of physical success).
Baseline: A rest/relaxation state used to differentiate neural activity at rest from neural activity. BA: Brodmann Area.
BMI: Brain-machine interface.
Closed-loop/Online-control: When there is feedback of control performance to the participant in real-time.
Decode: Converting input representations (typically neural signals) into some output, e.g., using a linear classifier or a linear model.
Effector: A body part or limb used to control an object (e.g., cursor) in a BMI environment. Firing rate: The rate at which a unit is releasing spikes/action potentials. Firing rate codes
information.
Functional segregation: Division of the population based on information they encode, rather than based on physical neurons.
Imagined movements: Movements where the participant is only visualizing them, without trying to engage any muscles.
IPL/IPS: Intraparietal region, around the intraparietal sulcus LFP: Local field potential.
LIP: Lateral intraparietal area.
Motor mirror neurons: Neurons that process the observation of someone performing an similarly to oneself performing the action.
NHP: Non-human primate.
N.S.: The human participant/volunteer taking part in the study and the participant being studied in all experiments in this dissertation.
Open-loop: When there is no feedback of control performance to the participant. Online: When information is being processed live, under real-time conditions.
Offline: When information is not being processed in real-time (e.g., post-hoc analysis). Population: A group of units; considering the units in aggregate as opposed to as single
PFC: Prefrontal cortex. PPC: Posterior parietal cortex. PRR: Parietal reach region. SCI: Spinal cord injury.
SEM: Standard error of the mean.
Sensory mirror nrurons: Neurons that process the observation of someone feeling a sensation similarly to oneself feeling the sensation.
Spikes: Action potentials from when a neuron/unit fires.
Training: Initial data collection used to calibrate a decoder for BMI control.
1
Introduction
An estimated 12,000 new cases of spinal cord injury (SCI) occur each year in the United States, with over 50% of them leading to partial or complete tetraplegia (Foundation for Spinal Cord Injury Prevention, 2009). Tetraplegia involves the paralysis of all four limbs and the loss of sensation below the level of injury. As a result, it is difficult for tetraplegics to perform many everyday actions on their own. Neuroprosthetics and brain-machine interfaces (BMIs) offer a way to restore some ability and independence.
In recent years, there has been significant progress in the field of BMIs. BMI recordings from the brain have been able to successfully control robotic arms (Balasubramanian et al., 2017;
Hochberg et al., 2012; Klaes et al., 2015; Meng et al., 2016), virtual computer cursors (Aflalo et al., 2015; Jarosiewicz et al., 2015), and even a patient’s own muscles (Ajiboye et al., 2017). These BMIs generally work by having the patients or non-human primates (NHPs) imagine or attempt making movements in order to control a device.
Despite these engineering advances, however, there is a lack of understanding how the brain represents the many variables relevant to BMI cortical control and cognitive processes (e.g., different effectors, cognitive strategies, sequences of movements, attention, memory,
for actual BMI control. Furthermore, we are interested in whether variables in other domains (e.g., the sensory domain) are represented in a similar framework.
In Chapter 2, we assess the different types of BMIs and the current state of the field. We discuss the PPC, the main brain area studied in this dissertation, in terms of traditional and more modern views of its function and organization, as well as the potential benefits of designing BMIs that record from PPC compared to primary motor cortex (M1), another brain area often used for BMIs. We also explain ways in which the brain can encode information, and in particular “mixed selectivity”, an increasingly studied way of representing high-dimensional information in a relatively small network of neurons. Lastly, we review the literature on mirror neurons, which are neurons that appear to represent someone else’s movements/sensations similarly to when making the movements/feeling the sensations themselves, effectively “mirroring” them.
In Chapter 3, we study how PPC encodes movements of different body parts on both the left and right side of the body when using different cognitive strategies. In particular, we find a high degree of anatomical overlap, with single units coding for idiosyncratic combinations of the tested variables, exhibiting the mixed selectivity discussed above. Furthermore, we find that the representations of body parts are largely orthogonal, “functionally segregating” the effector responses. Body side and strategy, however, were not coded in a mixed manner, as their
advantageous for neuroprosthetics, enabling a single array (recording from a small patch of cortex) to decode motor intentions from a large extent of the body.
In Chapter 4, we study the diverse movements during closed-loop BMI control, specifically focusing on how well the structure of the representations observed in Chapter 3 (during
“training”) are preserved during online control. Focusing on imagined/attempted left/right hand movements, we find that the representations of the different movement conditions are
maintained equally well, with the structure consistent between training and online control. All the tested movement conditions were feasible for BMI control, with attempted movements of the right hand resulting in the best control performance. Furthermore, as a result of the maintained structure of the representations, we found that performance differences were predictable by data collected during training. In other words, the consistency of the structure made estimates of tuning and relative performance based on the training data meaningful during online control.
In Chapter 5, we study sensory mirroring responses in AIP and how they are represented at both a single unit and population level. Sensory mirror neurons are neurons that process observed sensations similarly to experienced sensations when the sensations are alike. Although not directly relevant to BMIs, the results of this chapter shed light on the generalizability of the above representational framework to other contexts (i.e., sensory/social interaction).
(e.g., felt and observed cheek touches) more similar than neural representations of body parts matched by person (e.g., felt cheek and shoulder touches). In the population response, we once again find partially mixed selectivity, with the representation of who was touched functionally segregated by body part. We also find that the mirroring responses are present regardless of whether sensations are presented in video or live action, and whether sensations are observed with free gaze or with required fixation.
2
Background
2.1
Brain-Machine Interfaces
A brain-machine interfaces (BMI), also often called a brain-computer interface, is a technology that allows for communication between the brain and an external device, such as a prosthetic limb or a computer. This communication can be unidirectional from brain to machine (as in the case of decoding motor intentions to control a robotic arm), unidirectional from machine to brain (as in the case of stimulation of the brain to evoke a sensation), or bidirectional (as in the case of a fully closed-loop prosthetic limb that responds to user intentions and also sends sensory feedback signals). BMIs measure brain activity either directly through neurons (the individual computational units of the brain) or indirectly through some proxy or aggregate measure (e.g., electroencephalography, local field potentials, functional magnetic resonance imaging, etc.).
Traditionally, BMIs have been developed in clinical contexts, with applications to help paralyzed patients or amputees. For example, BMIs have helped patients with “locked-in” syndrome communicate again (Chaudhary et al., 2015). Similarly, BMIs have helped tetraplegics perform some independent movements, either through control of a robotic limb (Aflalo et al., 2015) or through direct stimulation of their muscles to perform the movement (Ajiboye et al., 2017). More recently, there has even been interest in BMIs within the industry and the tech
Typically, BMIs are driven by the user’s motor intentions, often in the form of motor imagery (e.g., imagining arm reaches to different targets on a screen). In general, a BMI first learns the brain’s neural representations corresponding to the different movement intentions in the absence of any actual control. This data is collected in a calibration (“training”) phase either by having the user follow instructed movement cues or by having the user mimic the actions necessary to control the effector (e.g., following a mouse cursor’s movements with their arm, with the cursor following some computer-defined trajectory). A neural decoder (e.g., a linear decoder) is then trained on this data to map the neural activity to the movement intentions in a supervised learning fashion. This trained decoder can then be used for online BMI control (Hochberg et al., 2006; Kim et al., 2008; Simeral et al., 2011).
There are several brain regions often used for BMI control. Primary motor cortex (M1) is one of those regions studied for BMI control. It is very involved in low-level motor output and as a result, many of the neural signals are strongly correlated with desirable motor control variables (e.g., degrees of freedom, trajectories, velocities, forces, etc.) (Georgopoulos et al., 1982; Hochberg et al., 2012; Holdefer and Miller, 2002; Morrow and Miller, 2003; Sergio et al., 2005). It is highly specialized, with specific, minimally overlapping networks for different parts of the body, as described in early studies detailing Penfield’s homunculus (Lotze et al., 2000; Penfield and Boldrey, 1937). In other words, a small area of M1 is likely to have dense representations of only one body part.
sulcus (IPL), serving as a connection between sensory and motor areas of the brain (Andersen and Cui, 2009; Baldauf et al., 2008; Gail and Andersen, 2006; Ishida et al., 2010; Quiroga et al., 2006). (More information on PPC below). This higher-level intention-coding property provides an opportunity to decode the subject’s intended set of actions and to act on them accordingly with intelligent assistive decoders, offloading a substantial portion of the burden of fine-grained control from the subject to the computer (Andersen et al., 2014; Musallam et al., 2004).
Electrocorticography (ECoG) and intracortical recording, on the other hand, are invasive techniques and record the brain from beneath the skull directly. Like EEG, ECoG also records aggregate voltage signals from the brain. However, because the neural signals do not need to be conducted through the skull in ECoG, the spatial resolution is much higher, up to 5 mm2
compared to 10cm2 with EEG (Buzsáki et al., 2012). In intracortical recording, microelectrode
arrays (MEAs) are implanted inside the gray matter of the brain. MEAs are not only able to record aggregate neural activity in the form of local field potentials (LFPs), but are also able to record the activity of single neurons in the forms of action potentials (spikes). Recent studies have also been able to develop BMIs using signals recorded from ECoG arrays (Leuthardt et al., 2004; Schalk et al., 2007) and MEAs, in both non-human primates (Chestek et al., 2011; Nuyujukian et al., 2017) and humans (Aflalo et al., 2015; Collinger et al., 2013; Hochberg et al., 2006; Jarosiewicz et al., 2015; Pandarinath et al., 2015; Taylor et al., 2002).
2.2
Posterior Parietal Cortex (PPC)
The posterior parietal cortex is a region of the brain historically implicated in a variety of higher-level brain functions. Having connections to both sensory and motor regions of cortex, PPC is considered an association area that processes sensory signals into more complex functions useful for motor functions and decision making, such as awareness, attention, and action planning (Balint, 1909; Holmes, 1918; Mountcastle, 1975; Ungerleider and Mishkin, 1982).
More recent studies in non-human primates have found regions of specialization around the intraparietal sulcus (IPS) within PPC, with different anatomical regions specializing in different body parts and functions. For example, the lateral intraparietal area (LIP) has been linked to saccades while the medial intraparietal area (MIP) has been found to be a part of the parietal reach region (PRR) and responsible more for reach planning (Andersen et al., 1987;
Christopoulos et al., 2015; Quiroga et al., 2006). In the ventral intraparietal area (VIP), studies have found evidence of visuotactile mirroring, with units representing both observed and experienced tactile sensations (Ishida et al., 2010). Studies have found the anterior intraparietal area (AIP) to be selective for hand shapes (i.e., grasp types), hand movement intentions, and visual features of objects relevant for grasping (Klaes et al., 2015; Murata et al., 2000; Schaffelhofer et al., 2015; Schaffelhofer and Scherberger, 2016).
2012), the inactivation of LIP leading to saccade deficits (Li and Andersen, 2001), and the inactivation of AIP leading to grasp deficits (Gallese et al., 1994). At the same time, however, these areas are also highly interconnected (Andersen et al., 1990) with some inactivation studies finding deficits with coordinated movements. For example, inactivation of PRR was found to cause deficits in coordinated simultaneous reaches and saccades but not saccades alone (Hwang et al., 2014).
In light of the heavy interconnectivity, it is reasonable to expect significant crosstalk between the regions around IPS and thus a high degree of overlap between representations in IPS. Indeed, there have been some studies finding evidence of these functions being more anatomically overlapping, with the representations of different body parts mixing (Astafiev, 2003; Connolly et al., 2003; Culham, 2003; Gallivan et al., 2011; Prado, 2005) and the representations of body parts on different sides of the body as well (Gallivan, 2013).
Furthermore, past studies in PPC on gain fields have suggested that individual neurons in PPC can be tuned to multiple variables simultaneously. Specifically, the gain field studies focused on how different spatial reference frames encoded at the neural level. They found that neurons in and around LIP encode the spatial location of objects relative to head, eye, and body position, allowing for a stable representation of the outside world in body-centered coordinates (Brotchie et al., 1995; Zipser and Andersen, 1988).
More recently, the idea of PPC neurons being tuned to multiple variables has been extended past references frames and representations of space towards other, more categorical, variables in a structure known as “mixed selectivity” (Raposo et al., 2014). In mixed selectivity, individual neurons can be simultaneously tuned to various idiosyncratic combinations of variables. Mixed selectivity allows for a relatively small network of neurons to encode more information and in higher dimensions than traditional “pure selectivity”, where individual units are tuned to only one variable at a time (Fusi et al., 2016). Mixed selectivity has also been found in other association cortices of the brain such as prefrontal cortex (Rigotti et al., 2013), and is seen as important for a brain area to perform high-level computations and functions (see Mixed Coding for more details).
information encoded in a brain region (such as in M1) would require the user to carefully perform each of the necessary steps on their own. In Aflalo et al. (2015), for example, they found a unit in PPC activated specifically when the participant imagines moving his hand to his mouth, but not for any movement with a similar trajectory (e.g., hand to shoulder or hand to ear). In this case, one can imagine a BMI using the signal to trigger a robotic limb to move to the user’s mouth automatically, as opposed to requiring the user to carefully control each joint and degree of freedom simultaneously.
Furthermore, the mixed selectivity coding structure suggests that it is possible for a BMI
recording from a small patch of PPC to decode many different variables and body parts. This has an obvious advantage of allowing a single array to record from a large extent of the body, such as the hands and arms (Aflalo et al., 2015; Klaes et al., 2015) or bilaterally (Chang and Snyder, 2012). M1, in comparison, usually only represents limbs on the contralateral side of the body and in a less overlapping way (Fritsch and Hitzig, 1960; Lotze et al., 2000). As imagined body part movements are often used to control BMIs, the ability to decode movements of multiple
different body parts naturally increases the control possibilities and degrees of freedom.
a relatively safer procedure with fewer risks (Cho et al., 2017; Regan et al., 2015). Thus, the potential to record a large amount of information from a small patch of PPC using an MEA is attractive from a clinical safety perspective, as well.
2.3
Mixed Coding
Mixed coding (or “mixed selectivity”) is a mechanism for how neural populations represent information in the brain. Traditionally, studies have either looked at neural representations from a “pure selectivity” perspective, where individual neurons are tuned only to single task
variables, or a “sparse selectivity” perspective, where neurons are tuned to specific
combinations of task variables. Mixed selectivity, on the other hand, is a framework where the neurons in a population are tuned, often nonlinearly, to idiosyncratic combinations of variables, i.e., neither completely pure nor sparse but rather with some units demonstrating examples of each.
These studies on gain fields can all be considered early work in the field of mixed selectivity in the context of spatial representations, with neurons in the population tuned to various combinations of receptive fields. More recently, however, the concept of mixed selectivity has been extended to a more diverse variety of contexts, such as in the context of categorical decision making (Raposo et al., 2014; Rigotti et al., 2013).
In these studies, mixed selectivity has been found in associative areas of the brain such as PMd, PFC, and PPC and is seen as an important hallmark of higher level cognitive areas or areas related to associative learning (Pesaran et al., 2006, 2010; Raposo et al., 2014; Rigotti et al., 2013). Studies on gain fields, for example, interpret the mixing of different receptive fields as necessary in the transformation of variables from one reference frame to another, a process important in transforming high level intentions into actions (Pesaran et al., 2006, 2010; Salinas and Sejnowski, 2001; Salinas and Thier, 2000). A recent modeling study found that the degree of mixed selectivity observed in NHP PFC was consistent with models of Hebbian learning (Lindsay et al., 2017), where the connection between two neurons strengthens when they have highly correlated outputs (Morris, 1999). This consistency suggests a relationship between mixed selectivity in association areas and training over time.
The mixed selectivity framework offers several advantages over the more traditional pure or sparse selectivity frameworks. A sparse selective representation faces the problem of
encode that information increases exponentially. This is a broader phenomena from machine learning, computer science, and statistics known as the “curse of dimensionality”. In general, the curse of dimensionality describes how as the number of dimensions in the data increases, the amount of space/samples required to fully represent the possible permutations of the features increases exponentially (Bellman, 2015).
In the context of neural representations and sparse selectivity, it means that not only does the number of neurons exponentially increases with the number of variables, but the number of connections from these neurons to downstream areas processing the information explodes exponentially as well (Anderson and Kreiman, 2011; Fusi et al., 2016). This is clearly not a feasible method of representation for all the variables encoded in the brain. However, this problem is largely reduced with mixed selectivity. The presence of neurons tuned to various combinations of variables allows for the neurons to represent more than a single variable, allowing them to be useful for a much larger variety of applications and downstream
applications. This flexibility of use also allows for the readout of the variables to require much fewer connections downstream (Fusi et al., 2016; Pouget and Sejnowski, 1997).
computations (Adibi et al., 2014; Buonomano and Maass, 2009; Jaeger and Haas, 2004; Shamir and Sompolinsky, 2006). Thus, the ability enabled by mixed selectivity to decode variables via simple linear readout is highly desirable. Note, however, that for the mixed selectivity to encode variables in higher dimensions the mixing must be nonlinear as opposed to linear. Purely linear mixing of variables would fail to create any additional separability in the neural representations (i.e., not increase the dimensionality of the representation) (Fusi et al., 2016; Rigotti et al., 2013), potentially making the aforementioned simple linear readout of all variables impossible.
So far, studies on mixed selectivity have looked at behaving rodents and NHPs, with results suggesting that all task variables are randomly mixed together (Pesaran et al., 2006, 2010; Raposo et al., 2014; Rigotti et al., 2013). However, it is unclear whether this is indeed the case. The random mixing of apparently all variables could be due to the limited number of task variables tested in an experiment, for example. The random mixing also raises questions about how different brain areas can have specialization of function while remaining randomly mixed. For example, studies in PPC have found areas of specialization to saccades, reaching
movements, grasps, etc. (see Posterior Parietal Cortex above for more details), but it is unclear how these areas would be different in the framework of mixed selectivity.
variables easily, with little to no overhead when testing new task variables. However, there have so far been no studies recording from high-level associative areas in human cortex in the context of mixed selectivity.
2.4
Mirror Neurons
About 25 years ago, researchers at the University of Parma in Italy discovered neurons in the premotor cortex of macaque monkeys responsive when observing someone else perform an action as well as when the monkey was performing the same action itself (Di Pellegrino et al., 1992; Gallese et al., 1996). The discovery of these “mirror neurons” created a field studying how mirror responses might relate to larger behaviors in social interaction.
The majority of the work in this field has been in NHPs using both fMRI and electrophysiology (Caggiano et al., 2009; Filimon et al., 2007; Fogassi et al., 2005; Fujii et al., 2008; Grèzes et al., 2003; Keysers et al., 2003; Rozzi et al., 2008). These studies have mostly found mirror neurons in brain regions involved in action planning such as premotor cortex and PPC.
The prevailing school of thought is that these mirror neurons are related to recognizing and understanding the actions and intentions of others, allowing people to imitate/mimic each other, and ultimately forming a basis for interactive social behaviors (Caggiano et al., 2011; Caramazza et al., 2014; Fogassi et al., 2005; Iacoboni, 2009; Keysers and Gazzola, 2006; Rizzolatti and Fabbri-Destro, 2008). Some even argue that mirror neurons are evidence of the biological hardwiring of empathy into animal/human behavior (Gazzola et al., 2006; Iacoboni, 2009); empathy that is critical for the formation of societies, altruistic behaviors, and morals (Adolphs, 2009; Tangney et al., 2007; Waal, 2008).
At the same time, however, some maintain that the motor mirror system is not the substrate for action understanding. They argue that there has not been any direct tests of the mirror neurons actually representing action understanding and that action understanding could be achieved through other higher level areas (Hickok, 2009). They also argue that mirror neurons could just be a natural emergent phenomena of associative learning over time, rather than a biologically-directed feature (Heyes, 2010).
someone else feeling a sensation similarly to how they process the actual experience of the sensation.
Single unit studies in NHPs have found evidence of tactile sensory mirroring in areas around the IPL in PPC (Ishida et al., 2010). In humans, fMRI studies have also found the IPL and the
secondary somatosensory cortices to respond similarly for observed and felt tactile sensations and even pain (Keysers et al., 2004; Osborn and Derbyshire, 2010).
In several studies, there have been cases of people with mirror-touch synesthesia, people who report being able to actually feel a sensation just from observing it (Banissy et al., 2009). fMRI studies on these people revealed hyperactivity in brain regions where sensory mirror neurons have been found (Blakemore et al., 2005). Subsequent studies have found that people with mirror-touch synesthesia tend to have higher levels of empathy, with some people even arguing that mirror-touch synesthesia could be linked to the ability to distinguish the identity of self from others (Banissy and Ward, 2013; Banissy and Ward, 2007). These studies further together suggest that the mirror system, and in particular the sensory side of the mirror system, could be related to empathy.
3
Partially Mixed Representations in Posterior Parietal Cortex
The following chapter’s contents are taken and adapted from Zhang et al. 2017, with modifications done to fit the dissertation format.
Zhang, C.Y. et. al. (2017). Partially Mixed Selectivity in Human Posterior Parietal Association Cortex. Neuron 95, 697-708. doi: 10.1016/j.neuron.2017.06.040.
3.1
Introduction
The posterior parietal cortex (PPC) of humans has historically been viewed as an association area that receives diverse inputs from sensory cortex, “associates” these inputs for processing more cognitive functions such as spatial awareness, attention and action planning, and delivers the outcomes of the associative process to more motor regions of the frontal cortex (Balint, 1909; Holmes, 1918; Mountcastle, 1975; Ungerleider and Mishkin, 1982). However, subsequent single neuron recording experiments with behaving non-human primates (NHPs) point to a systematic organization of functions in PPC (Andersen and Buneo, 2002). Of particular interest to the current investigation, separate cortical areas around the intraparietal sulcus (IPS) have concentrations of neurons selective for saccades (lateral intraparietal area, LIP) (Andersen et al., 1987), reach (parietal reach region, PRR) (Snyder et al., 1997) and grasping (anterior
More recent functional magnetic resonance imaging (fMRI) studies in humans have presented a mixed picture with some studies finding similar segregation for the types of intended movement in areas around the IPS (Astafiev, 2003; Connolly et al., 2003; Culham, 2003; Gallivan et al., 2011; Prado, 2005) and other studies finding largely an intermixing of effectors (Beurze, 2009; Heed et al., 2011a; Hinkley, 2009; Levy, 2007) as well as bimanual representation (Gallivan, 2013). These findings provide evidence for a degree of distributed and overlapping
representation of effectors on both sides of the body within PPC.
With the first chronic single neuron recordings of PPC in humans, we found similarities with the NHP studies. Neurons in human AIP are highly selective for different imagined grasp shapes while neurons in nearby Brodmann area (BA) 5 are not (Klaes, 2015). However, the human neural recordings also pointed to some degree of distributed representation, with AIP neurons also selective for reach direction and with AIP and BA5 neurons being selective for reaches with either the left or the right limb or both (Aflalo et al., 2015). While we have found evidence that multiple effectors are encoded in the same anatomical region of cortex, these studies were carried out in separate sessions and thus the functional organization of multiple effectors within the same population of neurons remains unclear.
Pertinent to how different effectors are coded within PPC are recent results that address encoding strategies for multiple dimensions of representations and their computational
2016), a neural encoding scheme in which different task variables and behavioral choices are combined indiscriminately in a non-linear fashion within the same population of neurons. This scheme generates a high-dimensional non-linear representational code that allows for a simple linear readout of multiple variables from the same network of neurons (Fusi et al., 2016). A basic question is whether such an organization of functional variables is universal or, rather, is in part due to the types of functional variables that were compared or the cortical subregions selected for study.
In the current study, we examine the anatomical and functional organization of different types of motor variables within a 4 x 4 mm patch of human AIP. We varied movements along three dimensions: the body part used to perform the movement (hand versus shoulder), the body side (ipsilateral versus contralateral), and the cognitive strategy (attempted versus imagined
movements). Each of these variables has been shown to modulate PPC activity (Andersen and Cui, 2009; Gallivan, 2013; Gerardin et al., 2000; Heed et al., 2011a). Thus we are able to look at how different dimensions of motor variables are encoded, and whether different variable types are treated in an equivalent manner (e.g., all variables exhibiting mixed-selectivity) or whether different functional organizations are found for different types of variables. Finally, we compare the hand and shoulder movements to speech movements, a very different type of motor behavior.
for specialized subpopulations of cells that selectively coded one movement type. However, the different motor dimensions were not indiscriminately mixed, as body side and cognitive strategy were fundamentally different from body part at the level of neural coding. There was a
high-degree of correlation between movement representations of the right and left side, within, but
not between body parts. The same was true for cognitive strategy. Thus, body part acted as a
superordinate variable that determined the structure of how the other variables were encoded.
Mixed-coding of some movement variables, but not others, argues in favor of PPC having a
partially-mixed encoding strategy. Finally, while AIP lacks anatomical segregation of body parts, the mixed-coding between body parts leads to what we call functional segregation of body
parts. Such segregation is hypothesized to enable multiple body parts to be coded in the same population with minimal interference.
3.2
Methods
3.2.1
Experimental Model and Subject Details
3.2.2
Behavioral setup
All tasks were performed with N.S. seated in her motorized wheel chair. Tasks were displayed on a 27-inch LCD monitor in a lit room. The monitor was positioned so that the screen occupied approximately 40 degrees of visual angle. Stimulus presentation was controlled using the Psychophysics Toolbox (Brainard, 1997) for MATLAB. No eye fixation was required or enforced.
3.2.3
Physiological recordings
Subject N.S. was implanted with two 96-channel Neuroport arrays (Blackrock Microsystems model numbers 4382 and 4383) in putative homologues of area AIP and Brodmann’s Area 5d. Array placement was determined based on preoperative fMRI (Aflalo et al., 2015) and the array was placed at Talairach coordinate [-36 lateral, 48 posterior, 53 superior]. Neural activity was amplified, digitized, and recorded with the Neuroport neural signal processor (NSP). The Neuroport System, comprising the arrays and NSP, has received FDA clearance for <30 days acute recordings. We received FDA IDE clearance (IDE #G120096, G120287) to extend the duration of the implant for the purposes of a brain-machine interface clinical study using signals from posterior parietal cortex.
components, where n was selected to account for 95% of waveform variance. Post-hoc review of sorted unit statistics showed that channels were sorted with between 2-4 principal
components (see Figure S 2A). Results of offline sorting were reviewed and adjusted if deemed necessary following standard practice (Harris et al., 2016). Only neurons recorded from the array implanted in putative AIP were analyzed. Pooling across all versions of the task, on average 93 sorted units were recorded from N.S. per session. Furthermore, to avoid bias, all spike sorting was performed prior to any analysis and blind to a unit or channel’s response during the task. We used several metrics to quantify sort quality (see Figure S 2B-F) including 1) the percentage of interspike intervals (ISIs) shorter than 3ms, 2) the signal-to-noise ratio (SNR) of the mean waveform, 3) the between spike projection distance (Pouzat et al., 2002), 4) the modified coefficient of variation of the ISI (CV2), and 5) the cluster isolation distance (Harris et al., 2000) of each sorted cluster.
We recorded electromyogram (EMG) activity over the right trapezius muscle using B&L
Engineering EMG electrodes. Raw analog EMG activity was fed into the NSP, aligned with neural signals, and sampled at 2 kHz. Signals were band-pass filtered (5th order Butterworth filter with
cut-off frequencies of 10 and 250Hz), full-wave rectified, and smoothed (box-car, 50ms window).
3.2.4
Task procedure
right), and body part (hand or shoulder) to use, e.g., attempting to squeeze the right hand. In total there were eight possible actions which were pseudorandomly interleaved such that each condition was performed once before repetition. After a delay of 1.5 seconds, N.S. was cued to perform the cued action. Between each trial there was a 3 second inter-trial interval (ITI). Hand movements were hand squeezes while shoulder movements were shoulder shrugs (contraction of the trapezius). We ran 64 trials (8 trials per condition) on each session. This task was run over the course of 4 non-consecutive days. In total 357 units were recorded across the four recording sessions. Unless otherwise indicated, all figures were generated from data collected from this version of the task.
In a separate set of sessions, we repeated the experiment with the modification that shoulder shrugging movements were replaced with shoulder abduction in the frontal plane. Attempted shoulder abduction resulted in no overt movement and thus allowed us to compare body part representations exclusively below the level of injury. Six sessions run over the course of 6 non-consecutive days were recorded resulting in 629 recorded units. Each session contained 64 trials (8 trials per condition).
Left, Speak Right). Three sessions were recorded for the hand and the shoulder separately, with each session containing 72 trials (12 trials for each condition). In total 299 units were recorded for sessions using the hand while 228 units were recorded for sessions using the shoulder.
3.2.5
Unit selection
Analyses were performed on all units regardless of sort quality for statistical power and ease of presentation. To ensure that such pooling did not bias the conclusions of this paper, we
performed the analyses separately on well isolated versus potentially multi-unit activity and found the results to be similar (see Figure S 1 for more details and also Unit quality classification below for how high-quality single units were identified). Units were pooled across days
assuming independent populations across recording days. Analysis of separate days was also performed to demonstrate stability of results across sessions (Figure S 5). Units with mean firing rates less than 1.5 Hz were excluded from the analysis so that low firing rate effects would be minimized.
3.2.6
Linear analysis 1
𝐹𝐹𝐹𝐹=� 𝛽𝛽𝑐𝑐𝑋𝑋𝑐𝑐 𝑐𝑐
+𝛽𝛽0
where 𝐹𝐹𝐹𝐹 is the firing rate, 𝑋𝑋𝑐𝑐 is the vector indicator variable for condition c, 𝛽𝛽𝑐𝑐 is the estimated scalar weighting coefficient for condition c, and 𝛽𝛽0 is a constant offset term. In such a model, the estimated Beta coefficients represent the expected firing rate changes from baseline for each condition. Tuning to each condition (Fig. 2A) was based on the p-value of the t statistic for each associated beta coefficient. This definition of whether a unit is significantly tuned to a condition is used as an inclusion criterion for some analyses, with the significance level (e.g., p < 0.05, uncorrected or Bonferroni corrected) depending on the specific analysis. The significance level of the differences between the number of units tuned to each condition was calculated using a two-sided Wilcoxon rank sum test on the distribution of p-values for each pair of conditions (Figure S 3).
3.2.7
AUC analysis
We performed a ROC analysis to quantify tuning strength for each condition. For each unit, strength of tuning was summarized as the area under the curve (AUC) when comparing each condition’s Go or Delay neural response to baseline. The AUC values can range from about 0 to 1, with 1 indicating that every go/delay measurement is greater than every baseline
measurement (excitatory response) and 0 indicating that every go/delay measurement is less than every baseline measurement (inhibitory response). To summarize the population (Figure
significant tuning to the condition.” Thus, this measure is descriptive and not a statistical assessment of significant tuning in the population. Pair-wise differences between the AUC for each condition were calculated using a two-sided Wilcoxon rank sum test on the significant AUC values (Figure S 3).
3.2.8
Linear analysis 2
Above we performed a linear regression analyses where firing rate was modeled as a function of each condition response. Here we perform an additional linear analysis where firing rate is modeled as the linear combination indicator variables for each motor variable (strategy, body side, and body part) and their interaction. All temporal epochs were identical, however the design matrix was updated to reflect the new model:
𝐹𝐹𝐹𝐹=𝛽𝛽1𝑆𝑆𝑆𝑆𝑆𝑆𝑆𝑆𝑆𝑆𝑆𝑆𝑆𝑆𝑆𝑆+𝛽𝛽2𝐵𝐵𝐵𝐵𝐵𝐵𝑆𝑆𝑆𝑆𝐵𝐵𝐵𝐵𝑆𝑆+𝛽𝛽3𝐵𝐵𝐵𝐵𝐵𝐵𝑆𝑆𝐵𝐵𝑆𝑆𝑆𝑆𝑆𝑆+𝛽𝛽4𝑆𝑆𝑆𝑆𝑆𝑆𝑆𝑆𝑆𝑆𝑆𝑆𝑆𝑆𝑆𝑆 ∗ 𝐵𝐵𝐵𝐵𝐵𝐵𝑆𝑆𝑆𝑆𝐵𝐵𝐵𝐵𝑆𝑆+𝛽𝛽5𝑆𝑆𝑆𝑆𝑆𝑆𝑆𝑆𝑆𝑆𝑆𝑆𝑆𝑆𝑆𝑆
∗ 𝐵𝐵𝐵𝐵𝐵𝐵𝑆𝑆𝐵𝐵𝑆𝑆𝑆𝑆𝑆𝑆+𝛽𝛽6𝐵𝐵𝐵𝐵𝐵𝐵𝑆𝑆𝑆𝑆𝐵𝐵𝐵𝐵𝑆𝑆 ∗ 𝐵𝐵𝐵𝐵𝐵𝐵𝑆𝑆𝐵𝐵𝑆𝑆𝑆𝑆𝑆𝑆+𝛽𝛽0
Each unit was classified as being tuned to a term if the p-value of the corresponding beta coefficient was significant (i.e., p < 0.05, uncorrected). To examine the effect of the different motor variables on firing rate patterns across the population we performed a MANOVA test on the linear beta coefficients of the model. All units were used in the test (regardless of whether they showed tuning to a variable or not).
3.2.9
Test of population bias in representing motor variables
firing rate of the neuron during the Go phase, and this baseline-subtracted firing rate was used in the test. All units were used in the test (regardless of whether they showed tuning to a variable or not).
In comparing between the 8 movement conditions and the speaking conditions, we performed a t-test on the baseline subtracted firing rates, with the 8 movement conditions pooled into one group and the 2 speaking conditions pooling into a second group. Once again, all units were used regardless of their tuning.
3.2.10
Degree of specificity
3.2.11
Correlation between representations
We used a population correlation analysis to measure the similarity between the neural
representations of each condition. For each neuron, the beta coefficient for each condition (see Linear Model 1) was normalized by the corresponding 95% confidence interval to ensure a common scale proportional to signal-to-noise. The normalized beta values for each unit and for each condition were used to create a vector summarizing the population response. We used the correlation between these vectors to measure the similarity in neural space between conditions. Only units with a significant beta coefficient for at least one condition (p < 0.05, Bonferroni corrected) were included in the analyses.
We used hierarchical clustering (agglomerative hierarchical cluster tree; using the built-in MATLAB 2016a linkage and dendrogram functions with unweighted average correlation as the measure) to summarize the structure in the patterns of correlation between the different conditions (McKenzie et al., 2014).
3.2.12
Decoder analysis
one level of a second motor variable and then applying the classifier to the other level. Cross-validated performance restricted to the first level was also computed as this provided an upper bound on classification accuracy given the signal to noise of our data. For instance, we trained a classifier to differentiate left from right movements on shoulder movement trials and tested it on hand movement trials, also computing cross-validated performance within shoulder trials (Figure 7C). For features, we used firing rates from the first 2 seconds of the “Go” phase for units with significant tuning to any of the eight movement conditions. Only units significantly tuned to at least one of the 8 movement conditions (p < 0.05, Bonferroni corrected) were included in the analysis. Classifier performance was determined to be above chance if its performance was greater than 95% of decoders trained on randomly shuffled data (1000 shuffles).
3.2.13
Condition classification
3.2.14
Unit quality classification
For the analysis in Figure S 1, we needed to separate spike sorted units into high-quality single units and multi-units. This classification was done based on the cluster isolation distance (Harris et al., 2000) with a threshold of 10^1.6 dividing high-quality single units and multi-units. This threshold was chosen based on visual inspection of the distribution of all cluster isolation distance values (see Figure S 2).
3.3
Results
Recording from AIP of a female, C3/C4 tetraplegic participant 7 years post-injury (N.S.), we compared neural responses of attempted and imagined actions of the hand or shoulder on the right and left side of the body. Hand movements involved squeezing the hand into a fist and shoulder movements involved shrugging the shoulder. Shoulder shrugs are a staple of the participant’s behavioral repertoire being a primary method to operate her motorized
wheelchair. For imagined movements, we instructed N.S. to visualize her limb performing the instructed action, while for attempted movements, she was instructed to send the appropriate motor command to move the instructed limb. In the case of shoulder movements, attempted movement resulted in overt motor execution, while for the hand, there was no resulting movement because of paralysis. For the shoulder, we confirmed behavioral compliance by measuring the presence of trapezius EMG activity during attempted but not imagined movement.
instruction was extinguished during a delay period. A generic “Go” cue, visually identical across trial conditions, prompted movement. From initial pilot data we knew that all hand and shoulder movements evoked activity in the population; however, we were unsure how the different conditions mapped onto individual neurons. Shoulder and hand movements are frequently performed together opening the possibility that hand and shoulder movements would frequently be localized to the same neural population. We therefore introduced speech as a fundamentally different action that could provide an additional movement for comparison. During the speech conditions, N.S. simply said “left” or “right” as instructed. Eight repetitions of each trial type were pseudorandomly inter-leaved such that one repetition of each condition was performed before repeating a condition.
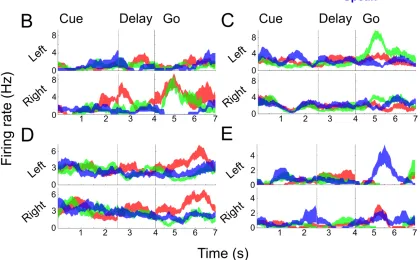
Figure 3.1. Neurons in PPC Exhibit Mixed Selectivity to Movement Variables
(A) Delayed movement paradigm. N.S. was cued as to what kind of movement to perform (e.g., imagine/attempt left/right hand/shoulder) and then cued to perform the movement after a brief delay. See Methods for more details. (B-E) Single unit example responses over time (mean ± SEM) demonstrating diverse coding to the different conditions.
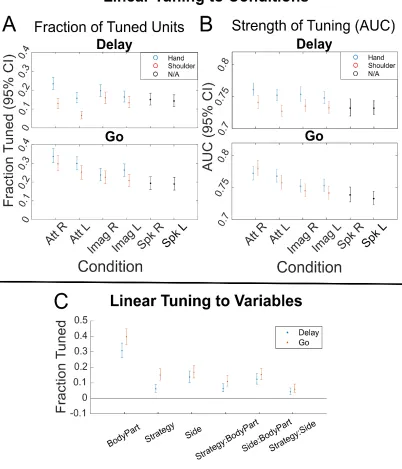
Figure 3.2. Significant Tuning to Each Movement Condition
We performed a second type of linear analysis, fitting a linear model that explained the firing rate relative to baseline as a function of the three motor variables of strategy, body side, and body part (Figure 3.2C). This analysis revealed an asymmetry in how body part is represented compared to body side or strategy. In particular, relatively larger non-linear interactions of strategy and body side with body part indicate that body part may in some way structure the functional responses to the other variables, a point we directly address below.
We found significant differences in mean firing rates between hand and shoulder movements (hand greater than shoulder, MANOVA p = 5.614e-8) and attempted and imagined movements (attempt greater than imagine, p = 0.0020), and no significant differences in mean firing rates between left- and right-sided movements (p = 0.2951). Comparing the firing rates of all 8 movement conditions (pooled together) with the firing rates of the speech conditions, we found a significant bias towards hand and shoulder movements over speaking (t-test p = 4.7048e-8).
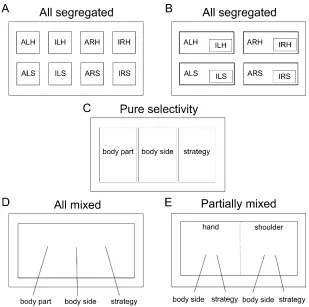
How are these different motor representations coded with respect to each other in the same region of cortex? Figure 3.3 shows five possibilities: (1) the 8 movement condition
could be randomly mixed together (Churchland and Cunningham, 2015; Fusi et al., 2016) (all mixed, Figure 3.3D); (5) some variables may be randomly mixed while others are organized with more structure (partially mixed, Figure 3.3E).
[image:51.612.172.481.77.384.2]We first performed a degree of specificity analysis (Figure 3.4) to determine the following: (1), whether highly specialized sub-populations of neurons are dedicated to each movement type, and, (2), whether some variables exist as subsets or suppressed versions of other variables. A
Figure 3.3. Possible Organizational Models of Neural Representations
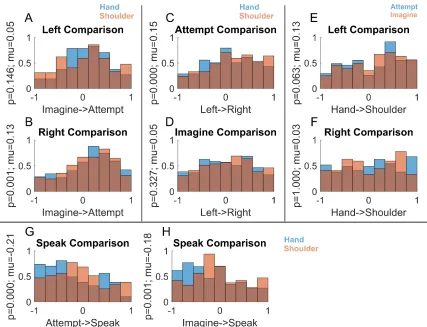
specificity index was computed as the normalized difference in beta values between motor variables for each neuron (taken from the linear models described above). Values near zero indicate equivalent neural responses to the two conditions being compared while values near 1 (or -1) indicate exclusive neural responses for one condition. By proposition one, we would expect values to be clustered near 1 (or -1) as, e.g., either a neuron is tuned to the right side or the left side. By proposition two, we would expect strong biases such that values would be clustered on one side of the range (between 0 and 1 or 0 and -1) as, e.g., a neuron tuned to imagine movement should be better (or equivalently) tuned to attempted movement.
Inconsistent with these proposals, we found that specificity values were distributed over the full range (Figure 3.4A-F). For instance, despite a small population bias for attempted movements, a sizable proportion of neurons were exclusively, or more strongly activated for imagined
We failed to find complete specialization of function across the population for single units, and the distributed and overlapping nature of responses makes it difficult to find structure in the responses of individual neurons. We therefore turned to population-based analyses to more readily identify how the different conditions are encoded with respect to each other. We measured all pairwise correlations between population responses for each of the eight
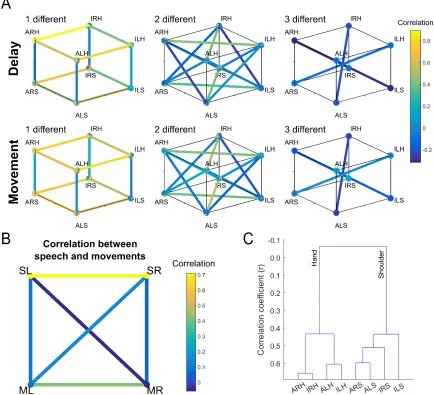
[image:53.612.113.540.68.395.2]movement conditions and looked for systematic structure in how the different motor variables (body part, body side, cognitive strategy) were coded (Figure 3.5). Correlation was used as a measure of similarity over other distance measures such as Euclidean or Mahalanobis distance
Figure 3.4. Specificity of Coding for Motor Variables
because the sign of the correlation is potentially informative of the underlying structure. For example, two conditions represented by distinct neural populations (e.g., sparse mixed selectivity) would manifest as a negative correlation between the two conditions, while a positive correlation would indicate a degree of overlap between the populations. Asymmetric relationships between the different variables were immediately apparent.
Figure 3.5. Functional Relationships between Movement Conditions
Correlations between conditions that differed in body side or cognitive strategy were high if the comparisons were made within a body part. In stark contrast, correlations between conditions that differed in body part were low even if cognitive strategy and body side were held constant (Figure 3.5A and Figure 3.6A). Low correlation between body parts was also apparent when comparing speech with shoulder or hand (Figure 3.5B). Such low correlations despite activating overlapping neural populations are a signature of network responses that occupy distinct neural subspaces thus minimizing crosstalk during planning and execution epochs (Churchland and Cunningham, 2015; Kaufman et al., 2014). Here the same principal may be at play for cortical representations of different effectors in an overlapping neural population. We term this
“functional segregation” of body parts. That the functional organization is based around effector is especially apparent when the distances between conditions were hierarchically clustered (Figure 3.5C), with body part being the primary differentiating variable. Further, for a given body part, movements with more shared traits are coded more similarly than movements with fewer shared traits (Figure 3.6B). For instance, a neuron tuned to imagined left hand movements was more likely tuned to imagined right hand movements (but not attempted right hand
movements). Likewise, a neuron tuned to right hand imagined movements was likely to be tuned to right hand attempted movements (but not left hand attempted movements). This functional segregation likely accounts for the non-linear interaction terms of Figure 3.2C.
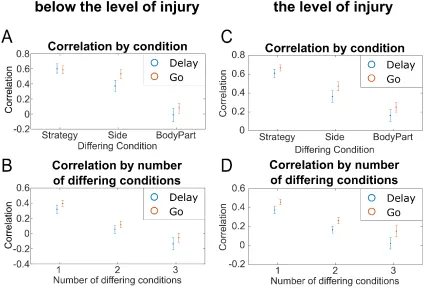
To address this issue, we replaced shoulder shrugging movements with shoulder abduction movements (shoulder abduction resulted in no overt movement) and repeated the correlation analyses. The results are similar when both body parts are chosen to be below the level of injury (Figure 3.6CD). In particular, the largest degree of separation exists between body parts.
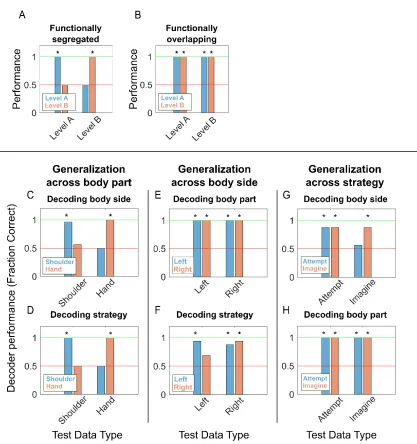
[image:56.612.113.538.100.390.2]Functional segregation of body parts should lead to minimal shared information about other motor variables when compared across body parts. The motor dimensions can be thought of as Figure 3.6. Segregation by Body Part
(A) Average correlation between movement conditions differing by exactly one task variable and grouped by the differing condition (e.g., for strategy, the average correlation of all movement condition pairs differing only by strategy). Intervals represent the 95% confidence intervals. (B) For movements above and below the level of injury, average correlation between movement conditions in the Delay and Go phases grouped by the number of differing traits (average of each cube in the movement phase). Intervals represent the 95% confidence intervals in the
categorical variables with two levels (e.g., body part has the levels of shoulder and hand). Given functional segregation, a classifier trained on one level (“Level A”) should fail to generalize to the other category (“Level B”) and vice versa (Figure 3.7A). Alternatively, for highly overlapping representations, a classifier trained on Level A should generalize to Level B and vice versa (Figure 3.7B). For example, given functional segregation between hand and shoulder, the neural signature that differentiates right from left sided movements for the hand should fail to
generalize to the shoulder. We tested for this possibility by looking at patterns of generalization
across trained classifiers. The results of such an analysis are shown in Figure 3.7C-H. For Figure 3.7C, we trained a linear discriminant classifier on all shoulder movement trials to differentiate between left and right-sided movements, regardless of strategy. The decoder performed well within its own training data as expected (leave-one-out cross-validation, Figure 3.7C, left blue bar), but performed at chance differentiating left from right-sided movements for hand trials (Figure 3.7C, right blue bar). The reverse was true when applying a classifier trained on hand trials to shoulder trials (Figure 3.7C, orange bars). Likewise, Figure 3.7D shows that a decoder trained to differentiate strategy using shoulder trials failed to generalize to hand trials, and vice versa. In contrast, decoders trained to differentiate strategy or body part were able to
Figure 3.7. Representations of Variables Generalize across Side and Strategy, not Body Part
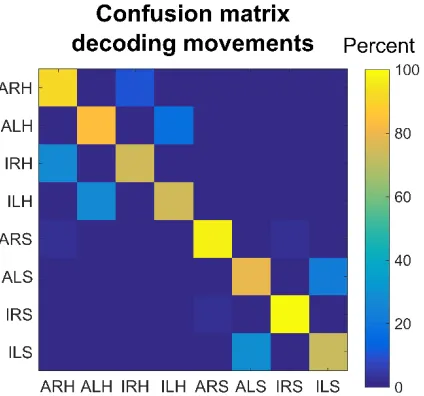
Given that some motor variables are similar in their neural encoding, is it possible to decode the body part, body side, and cognitive motor strategy from the neural population? We constructed a neural classifier to differentiate all conditions (Figure 3.8). Cross-validated classification performance was high. However, as expected, misclassification tended to occur between conditions with more variables in common. This is especially true between attempted and imagined movements as predictable from the high degree of similarity in the neural responses (Figure 3.6A).
3.4
Discussion
[image:59.612.113.325.74.272.2]We tested how a variety of motor variables were coded at the level of single neurons in human AIP. This allowed us to address several questions about how intent is coded in human AIP and to better understand how the motor variables are coded with respect to each other.
Figure 3.8. All Movement Variables Decodable from the Population
3.4.1
Effector specificity in PPC.
Classically, the regions around the IPS have been viewed as organizing around the control of different effectors such as the eye, hand, and arm. In a recent challenge to the centrality of an effector-based organization, Medendorp and colleagues have found that effector-specificity in the BOLD response of fMRI is much more pronounced between the hand and eye than the hand and other body parts arguing that effectors as such are not differentiated in the planning regions of PPC (Heed et al., 2011a). In line with these results, we found significant numbers of neurons tuned to movements of the hand and shoulder in a small patch of AIP. However, unlike the response at the level of voxels, the neural response to each effector was functionally segregated. Thus, while our results challenge the idea of strict anatomical segregation of effector representations across cortical areas, we do find local functional segregation of effectors within a cortical field. The current findings suggest that effector-specificity at the global anatomical scale could be thought of in terms of relative emphasis rather than strict specialization in humans.
areas also communicate with one another. For instance, inactivation produces a reach deficit in PRR when reaches are made alone, but both reach and saccade deficits when combined hand-eye movements are made (Hwang et al., 2014). Thus, the degree of effector overlap in AIP in human may reflect the coordination of movement and communication between effector specific areas.
An advantage of our human study is that the participant can perform a large number of tasks by verbal instruction. In NHP studies, the animals must be trained for long periods and thus the number of tasks and task variables are generally limited per study. Interestingly, area LIP has been studied by a number of groups using a number of different tasks. As a result, LIP has been found to modulate activity for tasks examining movement planning, attention, categorization, and decision making resulting in a variety of proposals for its function (Andersen and Cui, 2009). It may be that the large number of variables to which human AIP is selective may be a reflection of the versatility of using different tasks and that both human and NHP PPC areas are modulated by a very large number of variables. Indeed, several NHP studies in AIP have reported
overlapping populations of cells tuned to grasp type and reach target consistent with mixed selectivity between effectors as presented here (Asher et al., 2007; Fattori et al., 2009; Lehmann and Scherberger, 2013, 2015).
Differences between effector segregation in human and NHP studies of PPC may be a result of possible lack of homologies between human AIP of the current study and AIP of NHPs. In fact, we do not know the extent or number of grasp related areas defined by single neuron
NHPs. Finally, the lack of strict anatomical segregation of effectors may point towards a global topographic organization governed around more behaviorally meaningful aspects of behavior such as manipulation, reaching, climbing, and defense (Graziano and Aflalo, 2007; Jastorff et al., 2010). Whichever possibilities outlined above account for the large number of variable
encodings in human AIP, an exciting aspect of our results is that they open the possibility of decoding movements of many body parts from one small patch of cortex.
3.4.2
Asymmetric coding of motor variables and functional segregation of body parts
Recently there has been increased interest in not only the types of variables that are coded in a cortical region, but also how these variables are coded with respect to each other in an effort to understand the underlying logic of the computations performed within a cortical field (Fusi et al., 2016; Raposo et al., 2014). For instance, several papers have shown that higher cortical areas like PPC and prefrontal cortex may employ a computational strategy by which response
variables are randomly mixed (Raposo et al., 2014; Rigotti et al., 2013). While such a coding scheme can give rise to complex and difficult to interpret representations at the level of single neurons, the population code is information rich and enables simple linear classifiers to decode any variable of interest. In these papers, it was shown that response variables were randomly distributed across neurons, as illustrated in Figure 3.3D. Our data provides insights into
attempted or performed with the right or left side of the body. In contrast, when comparing within the same body part, knowing a neuron is tuned to movements of the right side makes it highly likely that the neuron will be tuned to the left side as well. The same is true for imagined and attempted movements. Thus while some variables seem to be randomly distributed across the population (e.g., body part) the relationship between other variables (e.g., body side, mental strategy) is organized in relationship to a third variable (body part). This effectively leads to functional segregation of body part at a population level. Such functional segregation between body parts is very similar in principal to the relationship between planning and execution related activity that has recently been described in frontal motor areas (Churchland et al., 2010;
Kaufman et al., 2014) where planning activity fails to excite subspaces that are hypothesized to produce muscle output.
But why are some variables functionally overlapping while others are functionally segregated? One possible answer is computationa