SUPERCONDUCTING PROXIMITY EFFECT CURRENTS IN INDIUM ABOVE ITS TRANSITION TEMPERATURE
Thesis by John B. Trenholme
In Partial Fulfillment of the Requirements For the Degree of
Doctor of Philosophy
California Institute of Technology Pasadena, California
1970
-iii-ACKNOWLEDGEMENTS
I am deeply indebted to Dr. Peter V. Mason, whose guiding inspiration and friendship made this work possible despite numerous difficulties. His constant assistance and interest have encouraged my efforts; his knowledge of superconductivity, both theoretical and experimental, has been of inestimable aid.
Dr. Jon Mathews has been a constant source of help with the many mathematical Questions raised in this work, and my numerous discussions with him on the subject of superconductivity have greatly helped my understanding of the subject.
I am grateful to the California Institute of Technology for permitting me to spend a year at the Indian Institute of Tech-nology in Kanpur, India. This sojourn did little to advance the present work, but was of incalculable educational value.
A number of suggestions of Dr. Floyd Humphrey have been incorporated in this work.
The cheerful assistance of Ruth Stratton has greatly aided in the preparation of the manuscript.
ABSTRACT
The superconducting proximity effect, in which superconduc-tivity diffuses from a superconductor into an adjacent
non-superconductor, was investigated using the SNS sandwich method in order to test the predictions of the de Gennes-Werthamer theory of temperature dependence of the Ginzburg-Landau equation. Sandwiches were made in which Pb injected superconductivity into a central layer of In, so that the maximum lossless current through the In could be found as a function of temperature down to the In transition tempera-ture (3.4K). Techniques were used to insure uniform current flow, and to avoid annealing. The log of the critical current density of the sandwiches decreased linearly with temperature above the In transition; the current became much larger below the transition. The de Gennes-Werthamer theory was extended by the addition of the nonlinear term in the Ginzburg-Landau equation; exact solutions of the one-dimensional Ginzburg-Landau equation in the presence of current (but with
! =
0) were used to find the theoretical tempera-ture variation of the critical current density. The experimental and theoretical curves showed the same linear behavior (although there were slope and value variations), thus verifying the
-v-TABLE OF CONTENTS
I. INTRODUCTION
A. The Superconducting State B. The Proximity Effect
C. Previous Measurements of the Proximity Effect D. The SNS Sandwich Method
E. Purpose of the Present Work II. PREPARATION OF THE SAMPLES
A. Preliminary Discussion B. Details of the Preparation
C. Effects of Annealing on the Samples III. MEASUREMENT OF THE SAMPLES
A. The Cryostat
B. N Material Mean Free Path and Transition Temperature
C. Apparatus for Sandwich Measurements D. Samples with Al Center Layers
E. Effects of an External Magnetic Field IV. RESULTS OF THE SANDWICH MEASUREMENTS
A. V-I Characteristics
B. Critical Current versus Temperature V. THEORETICAL MODEL AND PREDICTIONS
A. Ginzburg-Landau Equation B. Temperature Dependence of k2
C. S Region
D. N Region; Critical Current
E. Boundary Conditions
F. Magnetic Effects
VI. COMPARISON OF THEORY AND EXPERIMENT
A. Reduction of Sandwich Currents to Current
Densities
B. Numerical Computations from the Theory
C. Comparison of Theory and Experiment
D. Suggestions for Further Work
E. Summary
APPENDIX A. THE QUANTUM INTERFERENCE VOLTMETER
51
53
57 5966
66
67
79 86 87 90A. Introduction 90
B. Two-Junction Quantum Interference 90
C. The Principle of the Voltmeter
94
D. Fabrication of the Two-Junction Ring--The SLUG 97
E. Characteristics of the SLUG 100
F. The SLUG Voltmeter 100
G. Use of the Voltmeter to Measure the Sandwich Characteristics
APPENDIX B. EXACT CALCULATION OF THE CRITICAL CURRENT
DENSITY
106
108
A. Introductory Discussion 108
B. Simultaneous Solution of Eq. (24) and Eq. (28) 108
C. The Search for the Critical Current Density 112
-1-I. INTRODUCTION A. The Superconducting State
The superconducting state [lJ appears when many metals and alloys [2] are cooled to low temperatures (less than 25K for presently known materials). Below a temperature which is characteristic of the specific material (called the transition temperature or critical tem-perature) a number of unusual and interesting properties are seen.
These superconducting properties include the flow of electrical currents without any associated voltage drop (lossless currents), the expulsion of magnetic fields from the interior of the material (Meissner effect), the quantization of the magnetic flux through a hole in the material, and the appearance of an energy gap in the excitation spectrum of the electrons. The Bardeen-Cooper-Schrieffer (BCS) theory [3J has shown that these remarkable properties are the result of the formation of electron pairs (the so-called Cooper pairs) and a subsequent condensa-tion of these quasi-Boson pairs into a single cooperative state. The pairs form because of some attractive interaction between the electrons
(in many cases due to the electron-lattice interaction). The supercon-ducting properties arise from the fact that the cooperative condensed state acts in many ways as a single macroscopic quantum state, or "wave
[lJ E. Lynton, Superconductivity, John Wiley & Sons, New York, 1962; this is a good general reference on superconductivity.
[2] R. Weast (Ed.), Handbook of Chemistry and Physics (49th Edition), Chemical Rubber Co., Cleveland, 1968, p. E-81.
function of the superelectrons". Ginzburg and Landau
[4]
independently developed a very successful phenomenological theory of superconductivity based on this idea of a superelectron wave function; Gor'kov[5]
showed that the Ginzburg-Landau theory in fact followed from the BCS theory, if the wave function was interpreted as the (spatially varying) energy gap. In the Ginzburg-Landau theory, a partial differential equation describes the spatial behavior of the energy gap in a material (see Section V). The coefficients in the differential equation depend on the pairinginteraction in the material, and on the temperature. The temperature dependence of these Ginzburg-Landau coefficients has been derived on the basis of a semi-classical approximation by de Gennes
[6]
and Wert hamer[7].
Their derivation depended on the use of a diffusion kernel in the integral equations on which the results were based, and so the de Gennes-Werthamer temperature dependence of the Ginzburg-Landau coefficients is valid only in the "dirty limit" in which the electron mean free path is much shorter than the pure bulk coherence length of the superconductor (see Section V).[4] V. Ginzburg and L. Landau, Zh. Eksp. Teor. Fiz. 20,1064 (1950); Trans., D. ter Haar, Men of Physics: L. D. Landau I, Pergamon Press, New York, 1965.
[5] L. Gor'kov, Zh. Eksp. Teor. Fiz. 36,1918 (1959); Trans., Sov. Phys. JETP 36, 1364 (1959).
-3-Once the superconducting state is understood to be a condensed state of electrons, it is not hard to see that superconductivity might "leak" into a normal metal in contact with a superconductor, because the electrons can easily travel from one metal to the other. Such a leakage of superconductivity is known as the proximity effect.
B. The Proximity Effect
When a material below its transition temperature (henceforth referred to as an S material) is in contact with a nonconductor, the electron wave functions in the S material must terminate at the bound-ary because of the Coulomb barrier. The pair condensate (which is made up of electrons) therefore also terminates at the boundary. However, when the S material is in good electrical contact with a material above its transition temperature (henceforth called an N material), there is no strong Coulomb barrier. Instead, the Cooper pairs may travel across the SN interface, and the uncondensed or normal electrons may travel from the N material into the S material. Once the pairs have entered the N side, they will eventually depair. Likewise, the normal electrons will pair up once they are inside the S material. The result of these diffusions of pairs and normal electrons is that the amount of superconductivity is decreased in the S material near the SN boundary, and that induced superconductive properties extend
The de Gennes-Werthamer theory of the temperature dependence of the coefficients in the Ginzburg-Landau equation predicts the tempera-ture dependence of the behavior of superconductivity in a material. Comparison of the predictions with experiment is relatively easy below the transition temperature, but it is quite difficult above this tem-perature; an isolated specimen of N material has no measurable super-conducting properties (even close to its transition temperature)
because the pair state is not present. However, an S material in
contact with the N material injects pairs into it, as discussed above, and the way in which the amount of pair state decays with distance in the N material gives us information about the pairing interaction in that material. We thus have in the proximity effect a powerful tool for the measurement of the pairing properties of materials above their transition temperatures, and thus for a test of the de Gennes-Werthamer theory in that region.
C. Previous Measurements of the Proximity Effect
The proximity effect was first investigated by finding the transition temperature of superimposed thin films of two different materials [8J. Such double films have transition temperatures inter-mediate between the transition temperatures that the two components would have in isolation. The results of these experiments are explained well by the de Gennes-Werthamer theory. (At this point it is desirable to modify the definition of Sand N materials, since the proximity
-5-effect is seen to modify the transition temperature of different
materials in contact. An S material will therefore be defined as
one below the transition temperature it would have in isolation, and
an N material as one above that temperature.)
The double film experiment originally yielded information
only at one temperature. A modification [9] of this experiment, in which the critical current parallel to the plane of the interface
was measured as a function of temperature, depended largely on the
properties of the S material. This modification is thus not
suit-able for measurements of the pairing tendency in the N material.
The energy gap on the outside of the N material in a
double film was measured [10] in another experiment. The energy
gap is proportional to the pair density, so this type of experiment
is potentially capable of measuring the pair decay as a function of
temperature. Unfortunately, thermal effects smear the gap
measurement near the transition temperature, and so the techniQue is
precise only at low temperatures.
The penetration depth for a magnetic field in a material
de-pends inversely on the amount of superconductivity in the material, so
measurements of the penetration depth [11] supply information on the
[9] P. Smith, et al., Phys. Rev. Letters ~, 686 (1961).
[10] E. Guyon, et al., Phys. Condo Mat.
2,
123 (1966).amount of induced superconductivity in the N material of an SN
double film. However, the penetration depth depends on a spatial
average of the amount of pair state and so is not sensitive to the
details of the spatial distribution of superconductivity.
D. The SNS Sandwich Method
The SNS sandwich method is a method of investigating the decay
of superconducting electron pairs in N material which avoids many of
the difficulties of previous methods. This method was devised by
Meissner [12],[13] and improved by Clarke [14]. Their experiment
con-sisted of finding the maximum lossless current which could be carried
across a three-layer sandwich consisting of an N layer between two
S layers. Currents of many amperes per square centimeter can be
carried across micron-thick N layers ill such structures. This method
is ideally suited to the measurement of the pairing tendency in the N
material, because (as will be seen in Section V) the maximum lossless
current depends only weakly on the properties of the S regions, and
quite strongly on the N region properties.
E. Purpose of the Present Work
The present work was undertaken to make a direct test of the
de Gennes-Werthamer prediction of the temperature dependence of the
pairing properties of materials above their transition temperatures.
The proximity effect, especially as exploited in the SNS sandwich
[12] H. Meissner, Phys. Rev. 109, 686 (1958).
[13] H. Meissner, Phys. Rev. 117, 672 (1960).
-7-method, is an ideal measuring tool in this type of investigation for the reasons discussed above.
The choice of material is as important as the choice of method if we are to make a definitive test of the theory. The transition tem-perature of the material is the base point for calculations of the temperature dependences, and so any test of the theory should use a material of known transition temperature. In addition, comparison right down to the transition temperature is necessary for complete com-parison, and so the use of a material with a transition temperature which is experimentally accessible is desirable. In the work of Meissner, the N region was of materials such as Cu, Ag, Au, Pt, and Fe, which have never been observed to superconduct. Clarke used Cu, which has a transition temperature of less than .OOIK (if it supercon-ducts at all). Their results are thus not an effective test of the theory. The material chosen for this work was In (some Al samples were also made), which has a convenient transition temperature of about 3.4K. This choice makes a direct test of the theory possible.
Because Pb and In are quite soluble in each other [15] , some method of stabilizing the sandwich structures was necessary. Stabili-zation was accomplished by depositing the sandwiches on substrates cooled to about lOOK, thus reducing the amount of thermal energy avail-able for diffusion and other annealing effects. An added advantage of such low temperature deposition is that it produces short electron mean free paths in the materials. Theoretical interpretation is presently possible only in the case of short mean free paths, and so low tempera-ture deposition allows us to avoid the addition of impurities resorted to by Clarke to insure short mean free paths. In addition, the choice of materials for an SNS sandwich is severely limited at room tempera-ture (as Clarke has pointed out) by the effects of interdiffusion, chemical combination, electrochemical effects, and other destructive forces; the presently used method of low temperature deposition sharply reduces these effects and thus greatly broadens the choice of materials for experimentation.
The pattern of flow of the currents in the sandwiches of both Meissner and Clarke was non-uniform, making reduction of currents to current densities inexact. The results of the theory are in terms of current densities, and so comparison between theory and experiment was rendered difficult. Meissner produced his sandwiches by plating S wires with N layers, and then pressing the wires together. The area and thickness of the sandwiches was thus poorly controlled. Clarke
-9-produced his sandwiches by vacuum deposition through masks, and so he had good control of their geometry. However, he did not use a super-conducting ground plane to insure uniform current flow in the sandwiches and so it can be expected that the currents in his sandwiches tended to bunch at the edges of the thin films [16] when the currents were large. Thus Clarke's results for large critical currents were subject to unknown but appreciable errors. The sandwiches in this work (which were also produced by vacuum deposition through masks) were therefore
supplied with superconducting ground planes to insure uniform current flow. The resulting absence of nonlinearity allowed precise comparison with theory.
In summary, SNS sandwiches with In as the center layer were measured to determine the correctness of the de Gennes-Werthamer theory
of the temperature dependence of the pairing properties of materials above their transition temperatures. The sandwiches were deposited at low temperature to prevent diffusion of the materials (and to provide short electron mean free paths). They had superconducting ground planes to insure uniform current flow.
II. PREPARATION OF THE SAMPLES
A. Preliminary Discussion
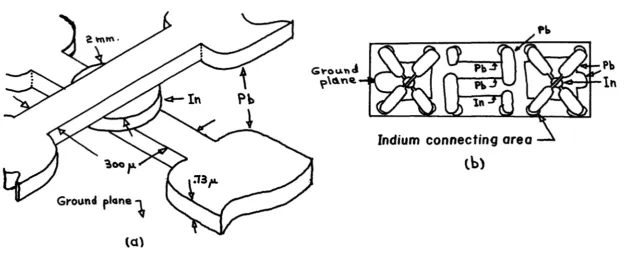
The sandwich samples (see Fig. 1) were made of an upper strip of
Pb about 300~ wide and 7300E thick, a center dot of In about 5 mm wide and varying in thickness from l~ to 8.3~
,
and a lower Pb strip similar to the upper strip and at right angles to it. The fabrication in theform of an X made the geometry of the actual crossover of the Pb strips insensitive to the exact positions of the masks used, and also
made possible four-terminal measurements of the V-I characteristics of
the sandwiches (such four-terminal measurement avoids any problem of
non-superconducting connections to the sample). Although the In spot
was considerably larger than the actual crossover area of the Pb strips,
the current flow was confined to the area of crossover because the
thickness of the In spot was much smaller than its other dimensions.
Any currents which did not travel directly from one Pb strip to the
other thus would have had to travel much greater distances through the
In than direct currents, and so would have been correspondingly smaller.
A thin plastic insulating layer separated the sandwich structure
from a Pb ground plane, which was needed to assure uniformity of the
current flow. A superconductor thicker than a few penetration depths
expels all flux from inside it, and so the ground plane and Pb strips
capture between them the flux due to currents in the Pb strips. When
the ground plane is close to the Pb strips and parallel to them, the
trapped flux is uniform, and so the current flow in the strips is also
Ground plane
~(ell
G~ou.,..d ~\c1n~
Indium connecting area
lb)
Ph
~ 11
In
Fig. 1. (a) Enlarged view (thickness exaggerated) of the sandwich structure. (b) Top view (actual size) showing two sandwiches deposited on their glass substrate; also shown are the
resistivity test strips deposited at the same time as the various layers of the sandwich.
[image:17.794.76.704.101.367.2]Long, narrow strips of the materials used in the sandwich
layers were deposited simultaneously with the layers, so that their
electron mean free paths and material transition temperatures could be
det ermined.
B. Details of the Preparation
The substrates on which the samples were prepared were 1" by 3" soft glass microscope slides. The slides were manually scrubbed with
water and detergent. They were then ultrasonically agitated in
deter-gent solution, immersed in acetone for several minutes, washed with
methanol, and degreased in hot trichloroethene vapor. They were then
clamped to a eu block at room temperature and placed in the vacuum
chamber.
The Pb ground planes were deposited by vacuum evaporation (from
a resistance heated Ta boat about 20 cm below the substrate) in a
liquid-nitrogen-trapped vacuum system at a pressure of about 10-
6
Torr. The ground plane thickness was about 7300~; it was measured (to5%)
bya quartz crystal deposition monitor calibrated (for Pb, In, and AI)
against measurements of film thickness made with an interferometer. To
assure current uniformity, the ground plane had to be several
penetra-tion depths thick; the penetrapenetra-tion depth for Pb is about 400~, so the
thickness used was quite sufficient. After deposition of the ground
planes, the sample was removed from the vacuum, and the ground planes
were checked visually for uniformity.
Indium connecting areas for the attachment of external
-13-soldering iron; they were positioned so as to fall under the future positions of the connecting strips from the sandwich structures and test strips. The purpose of such areas was to act as thermal ballast during the soldering of the external connections, so that the thin Pb strips would not be destroyed in the process of lead attachment.
An insulating layer was then applied to isolate the ground planes electrically from the sandwiches. Such a layer had to be thin compared to the width of the Pb strips to assure uniform current flow, and pinhole free to maintain electrical isolation. Experiments with thin layers of polystyrene, methyl methacrylate, photoresist
[17],
andFormva~[18]
revealed that no single layer would simultaneously bepinhole free and of suitable thinness. It was therefore decided to use a double layer,so that pinholes in one layer would be covered by the other. If such a double layer is to be formed, the formation of the second layer must not disturb the first, and so the solvent for the second layer material must not dissolve the first layer. Therefore, the solubilities in various solvents of the substances mentioned above were determined; the solvents tried were acetic acid, trichloroethene, p-dioxane, toluol, xylol, benzene, ethylene dichloride, and a mixture of
.6
toluol and.4
ethanol (by volume). The best combination of layers and solvents was found to be an initial layer of photoresist diluted in [17] Kodak thin film resist.xylol, followed by a layer of Formvar dissolved in p-dioxane. The con-centration of the photoresist in the xylol was adjusted until coatings made from the solution displayed several interference fringes in white light, implying a thickness of several wavelengths of visible light
(.5~). The substrate, with its attached ground plane and connecting areas, was dipped into the solution, allowed to drain, and dried in an inverted position to avoid dust adhesion. It was then dipped into the solution of Formvar in p-dioxane (whose concentration was also adjusted to give several-optical-fringe thickness coatings) and dried as before. Once the second layer had dried, the connecting areas were remelted with the low wattage soldering iron to remove the insulating layers on them, so that good contact with the Pb strips would be made.
The fabrication of the sandwiches was then undertaken. The substrate was clamped to a Cu block; small amounts of silicone vacuum grease between the block and the substrate just below the future posi-tions of the cross-overs insured good thermal contact to the block. The block and substrate were then placed into the vacuum chamber, pumped
-15-the In layer deposited. Again the mask was changed, and the top Pb
layer deposited. During the depositions, the indicated pressure rose
-6
into the 10 Torr range. The time to evaporate the layers varied,
but was usually several hundred seconds per layer. Two sandwiches were
deposited simultaneously to increase the chances of producing a working
sample (see Fig. 1). The thicknesses of the layers were measured by
the crystal monitor. The Pb strips had 7300~ thickness; the In spots
varied from l~ to 8.3~ in thickness.
Once they had been deposited, the sandwiches were removed from
the vacuum chamber and placed Quickly in liQuid nitrogen (the time of
exposure to room temperature air was less than a minute). They were
then tested for shorts between the ground plane and the sandwich; such
shorts, if detected, were vaporized by discharging a .l~f capacitor
charged to 30 volts between the layers. About half of the samples
dis-played such shorts; no correlation with the preparation procedure was
noted. If a short was seen in the actual crossover area of the
sandwich, the sample was rejected (the vaporization produced a visible
flash which allowed the position of any shorts to be determined).
Electrical leads were then soldered to the sample. It was attached
to the test fixture and transferred to the liQuid helium dewar for
testing. The samples were kept under liQuid nitrogen at all times
from their removal from the vacuum chamber until their placement into
the helium dewar; the various operations on them were all carried out
under liQuid nitrogen. This maintenance of low sample temperature
avoided any stresses due to thermal cycling, and also reduced any
c.
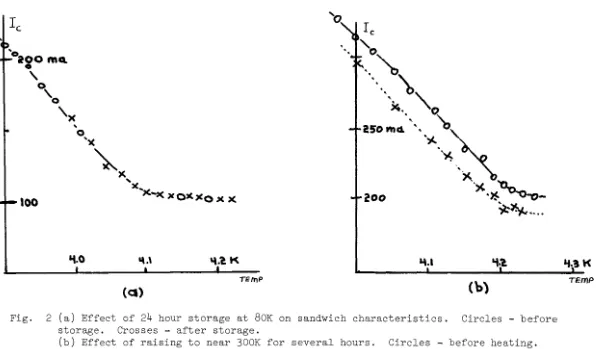
Effects of Annealing on the SamplesTo find out if any annealing of the samples was taking place at liquid nitrogen temperatures, one of the samples (which had been measured within an hour of preparation) was remeasured after a day's storage in liquid nitrogen. There was essentially no change in the critical current versus temperature curve, as shown in Fig. 2a (the critical current
versus temperature is the most important property of the sandwiches). Practically all the samples were measured within a day of preparation, so the storage did not introduce any measurable annealing effects.
b
"
Ie
"0'00 mel.
o
,
0,
o'x
'00
..
o "'X~X
'i.O
'x
""--x
"O)(,c 0 .)(x
".\
'4:~ K(ca)
'a
TEmPIe
'0
..
~\
"~
"0
-"', 'b
25'0 mel. ' ')I...
~
~
" )to, "0.,.,.
200
....
,
')(..*
-0-0-*~
....
'i,!.
(0)
Fig. 2 (a) Effect of 24 hour storage at 80K on sandwich characteristics. Circles - before storage. Crosses - after storage.
(b) Effect of raising to near 300K for several hours. Circles - before heating. Crosses - after heating.
[image:23.797.101.713.109.458.2]III. MEASUREMENT OF THE SAMPLES
A. The Cryostat
The cryostat was a standard liQuid nitrogen jacketed glass double dewar. A pump and manostat allowed regulation of the tempera-ture of the liQuid helium bath from 4.2 K to below 2 K. The temperature of the bath was determined to .001 K from its pressure as measured by mercury and oil manometers (using the 1958 He
4
pressure-temperaturerelationship), and by a carbon resistance thermometer calibrated against the manometers. The observed fluctuations in the readings of the resistance thermometer suggest that the manostat held the tempera-ture to well within .001 K at any given setting. Measurements were normally taken with the temperature decreasing, to avoid temperature stratification in the liQuid helium [19J.
B. N Material Mean Free Path and Transition Temperature
The N material mean free path and transition temperature were found by displaying the V-I curve of the test strip of N material on an oscilloscope. A 60 Hz sinusoidal current was applied to the strip from leads attached to its ends, and the resulting voltage was brought out on separate shielded leads attached at the same points (a test with Pb strips showed that the common resistance of the leads was negligible). The resistance of the strip at 4.2 K was thus determined, and the mean free path was then calculated from the relationship p£
=
2 x 10 -11 ~cm, 2
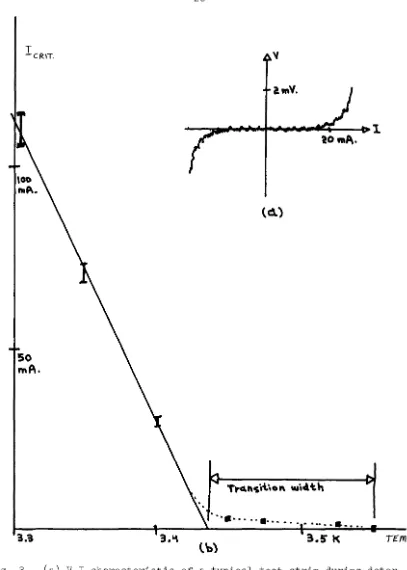
-19-where p is the resistivity and £ is the mean free path [20J. The resistivity was found from the resistance using the length and width of the strip (determined by the use of a calibrated microscope after the samples had warmed up) and its thickness (as measured by the crys-tal deposition monitor). Once the 4.2 K resistance had been found, the sample temperature was lowered until a zero-resistance region was seen on the V-I plot at low currents. The critical current at which voltage appeared was then measured for several temperatures at and below the first appearance of superconductivity. The appearance of voltage was gradual rather than abrupt, so the critical currents thus measured were accurate only to 10%. The transition temperature of the test strip was found from a plot of critical temperature versus temp-erature such as Fig. 3. Plots for the test strips always had gradual rather than abrupt increases of critical current as the temperature was lowered; such a broad transition is indicative of inhomogeneities in the test strip. The width of the transition was typically .05 K (the transition of Fig. 3 was broader than average).
50
MA.
"
imV.
(c1)
".~"
...
...
..
.
..
.
... ......
...l'o)
T£!YIPFig. 3. (a) V-I characteristic of a typical test strip during deter-mination of the critical current. Critical current ~16mA.
[image:26.617.126.533.75.645.2]
-21-the sandwich properties depend only weakly on -21-the properties of -21-the S
regions (see Section VI).
C. AEparatus for Sandwich Measurements
The electrical eQuipment used in the measurements of the sandwich
V-I characteristics and critical currents is indicated in Fig.
4
Current was introduced into two arms of the sandwich from a floating
source; the current leads were run through low-pass filters to bypass
high freQuency interference from outside the dewar. The sandwich
voltage resulting from this current was measured across the other two
arms by a voltmeter of nanovolt resolution based on the use of a
Quan-tum interference device called a SLUG (the voltmeter is discussed in
detail in Appendix A). The output of a SLUG voltmeter depends on the
input voltage in an oscillatory manner, so it was considerably easier
to observe the first appearance of voltage across the device than to
plot the full V-I curve. (Production of a complete V-I curve involved
manual nulling of the total input voltage to the voltmeter by means of
an external offset voltage--see Appendix A). Thus most of the data is
in the form of critical current versus temperature curves. The
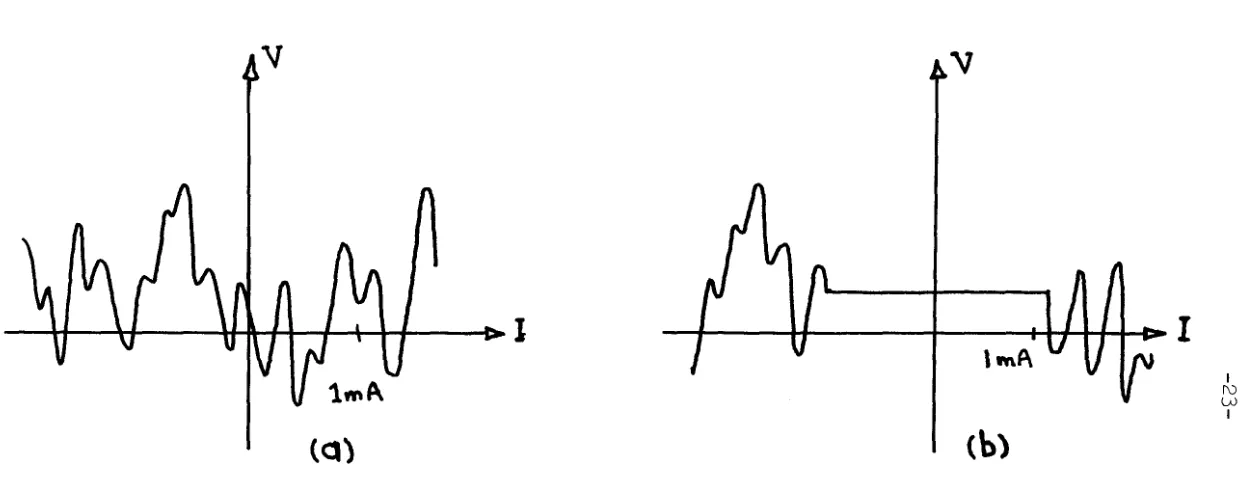
criti-cal current was found by plotting the output of the voltmeter versus
the sandwich current on an X-Y plotter; when there was a non-zero
critical current a flat region appeared in the normally oscillatory
output of the voltmeter, as Fig.
5
shows. The transition was always Quite abrupt, and the critical current could be determined to within10 ~a.
The critical current versus temperature characteristics of the
...
...
...
...
...
..
...
H ([)
-
-I
L - - - -
-...15
Fig.4. Diagram of the electrical setup during measurements on the samples. A - sandwich
current supply. B - sandwich. C - SLUG. D - Nb wire current supply. E - supply
of small ac current. F - SLUG current supply. G - current supply for nulling
device voltage. H - Amplifier and synchronous detector (phase locked to ac
cur-rent). R - small resistor (approx. l~~). S - superconducting shield. See
Appendix A for details.
I
[\) [\)
v
v
\f \I \lRII I \ I I
1>1
hnA
(Q)
(b)
Fig. 5. (a) SLUG output voltage versus sandwich input current when the sandwich is resistive (i.e., when its critical current is zero). (b) The same when the sandwich
critical current is non-zero.
I
I
r\)
W
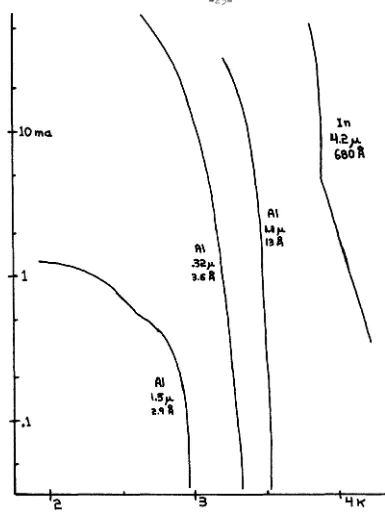
[image:29.799.107.728.124.370.2]D. Samples with Al Center Layers
An attempt to measure the critical current for temperatures all
the way from the transition of the central N layer to the transition
of the outer S layers was made by preparing sandwiches with Al center
layers and In outer layers. This choice of materials put both the
center layer transition temperature (1.19 K for bulk Al) and the outer
layer transition temperature
(3.40
K for bulk In) in the range ofcon-venient experimentation. Unfortunately, the Al films invariably had
very short electron mean free paths of 3 to 12
R.
The de Gennes-Werthamer theory predicts that such short electron mean free pathswill lead to a very rapid decrease of critical current with temperature
above the transition temperature of the N layer (see Section VI). The
theory therefore predicts that the region of currents due to induced
superconductivity will be indistinguishable from the region of rapid
decrease of critical current caused by the rapid decrease with
tempera-ture of the strength of ordinary superconductivity just below the
critical temperature. Indeed, any theory in which the superconducting
state is made up of paired combinations of normal-state electron wave
functions ought to show such behavior for short mean free paths,
because the many collisions with the lattice which the electrons must
undergo to get across the N region when the mean free path is short
will give the pairs numerous opportunities to relax to the unpaired
eQuilibrium state of the N region.
A rapid decrease of current with temperature is just what was
lOma.
1
Fig. 6.
-25-3
A\
..ItA-13~
[image:31.615.105.490.61.587.2]comparison, the curve for a Pb-In-Pb sandwich is also shown; at higher temperatures it shows a characteristic region of lesser slope due to induced superconductivity (see Section IV). The In-AI-In sandwich measurements thus support the de Gennes-Werthamer theory (or any
pair-ing theory) by verifypair-ing that proximity effect currents are not observed in the region of short mean free paths (where they are not expected).
The rise above the bulk value of the Al transition temperature (as defined by the temperature where the critical current goes to zero) in the sandwiches was even more marked in the case of the Al films than in that of the In films.
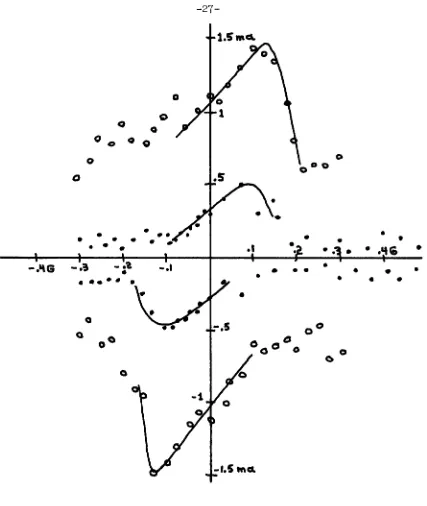
E. Effects of an External Magnetic Field
An external magnetic field could be applied along the long axis of the substrate by means of a coil in the nitrogen dewar surrounding the helium dewar. A weak-link superconducting bridge like the sand-wiches of the present work is sensitive to fields of a few Gauss [21], but filamentary bridges of a strongly superconducting material such as Pb are affected only by kilogauss fields. Magnetic field dependence of the critical current thus is a test of the Quality of a sandwich. This test was not applied to the Pb-In-Pb sandwiches, but was used with the In-AI-In sandwiches. The critical current versus external field curves for one of the Al samples are shown in Fig.
7
for two different-.'\G
Fig. 7.
-27-o
Q°0
o
0o o
Q
•
•
•
•
•
•
•
••
•
• •
•
.s
•
•
•
.
...
•
• •
-.~ - .'a
•
•
••••
•
Qo
o-.,
•
•
•
•
•
•
•
•
•
•
0 0o
o
CS D 00
C)
Critical current (in both directions) versus external magnetic field at two different temperatures. Circles-3.2IK. Dots - 3.28K. The curves are for an In-AI-In sandwich.
•
•
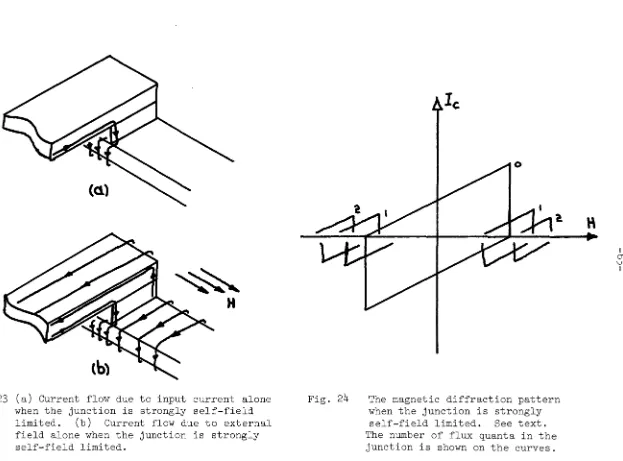
[image:33.612.115.542.62.568.2]temperatures, and thus for two different zero-field critical currents. This sandwich was strongly self-field limited (see Section V) at both temperatures, which causes the maxima to be displaced from zero field; curves of the type expected from self-field limiting have been drawn through the points.
Because the critical currents of the sandwiches were so sensi-tive to external magnetic fields, the experimental dewar was surrounded during all measurements by a magnetic shield which reduced the field at the sample to less than
5
mG.
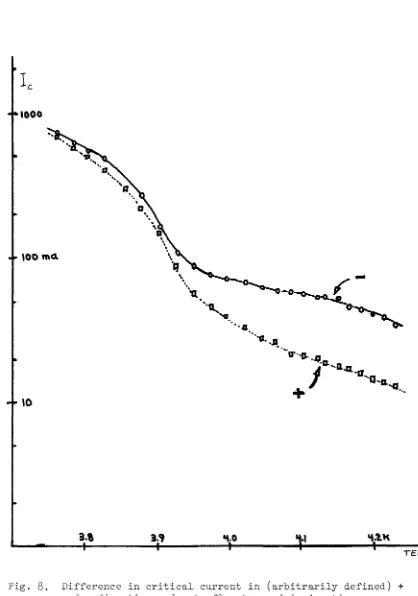
-29-\00 ",4
\0
'\.0
Fig.
8.
Difference in critical current in (arbitrarily defined) +and - directions, due to flux trapped in junction.
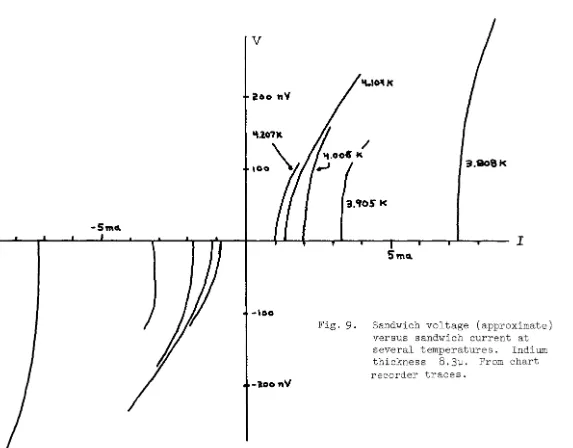
[image:35.613.105.523.75.671.2]IV. RESULTS OF THE SANDWICH MEASUREMENTS A. V-I Characteristics
The V-I curves for one of the samples (as taken on a chart recorder--see Appendix A) are shown in Fig. 9 for various tempera-tures. As the current is increased from zero, a region with no measurable voltage drop is first seen; such current without any
asso-ciated voltage drop indicates superconductive transport of current. At some current the superconductive transport ceases, and voltage abruptly appears. The current at which the voltage appears is the critical current of the sandwich; the critical current determination is quite precise, because the transition is so sharp. The V-I characteristic approaches a straight line through the origin when the current is well above the critical current; more of this line is traced out near the origin when the critical current is smaller, so we conclude that all of it would be traced out for zero critical current (that is, for no superconductivity) and identify the slope of the line with the normal resistance of the sandwich N layer. Therefore the V-I plot at any given temperature consists of a zero-voltage region at low currents, an abrupt appearance of voltage at the critical current of the sand-wich, and a fairly rapid approach to the normal-state behavior of the
v
200 raV
-5",4
-\00
-1.00 "V
3.8081<
3.,o5 I<
1
Fig.
9.
Sandwich voltage (approximate) versus sandwich current at several temperatures. Indium thickness 8.3~. From chart recorder traces.I LA!
[image:37.798.92.665.85.533.2]B. Critical Current versus Temperature
The critical current increases as the temperature is lowered, as
Fig. 9 shows. The critical current versus temperature curve for a
sample can be plotted as in Fig. 10 ; the plot consists of discrete
points because the temperature was lowered in discrete increments.
This figure shows the effect of using a material with an experimentally
accessible transition temperature for the N layer; there are clearly
two different regions, with a sharp corner or knee between them. Such
a knee was not seen in the experiments of Meissner and Clarke, who used
materials which did not have transition temperatures in the measured
temperature range. We thus conclude that the knee represents the
tran-sition of the In layer from the normal state to the superconducting
state. To check this conclusion, we test to see if the region below
the knee in temperature has a critical current which varies
paraboli-cally with temperature. This would be expected from an intrinsic
superconductor because Silsbee's rule [22J predicts that the critical
current of a material which is superconducting in its own right is
proportional to the critical magnetic field of the material, and
because the critical field varies parabolically with temperature.
Figure 11 shows a plot of the critical current of the sample of
Fig. 10 versus T2 for temperatures below the knee, along with a
straight line representing Silsbee's rule. The agreement is good
except for a tail near, but below, the knee temperature. Recalling
[22J E. Lyton, Superconductivity, John Wiley
&
Sons, New York, 1962;
-33-SOmCl
lO
'0
8:r
600
mAo
,,",00
\<.nee
.
'.)
"'0 ..-35-the broad transition of -35-the test strips (Section III.B), we ascribe this effect to inhomogeneities in the In layer. The identification of the temperature region below the knee as the region of ordinary superconductivity is thus verified. The knee is therefore the transi-tion temperature of the In layer above which the In has no intrinsic superconductive properties. This means that the region above the knee is the experimentally interesting region of induced superconductivity. The temperature region above the knee due to the In transition is best presented on a plot of log -critical current versus temperature, because of the large range of critical currents in this region. Such
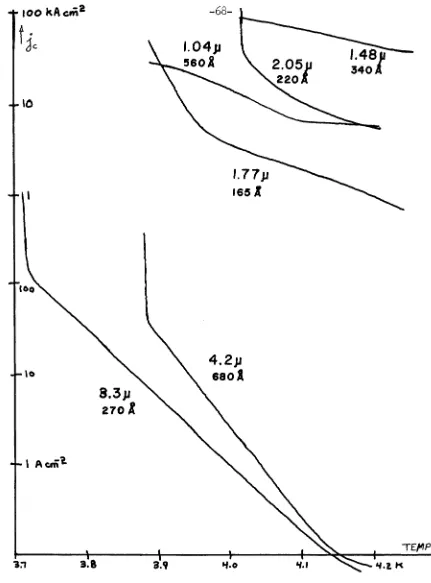
a plot is shown in Fig. 12 This figure shows the curves for two sandwiches on the same substrate when both happened to work, and gives some idea of the reproducibility of the results (the rise at high temperatures of one of the curves is atypical and the curve was not used.) Lines of best fit have been drawn by eye through the data
points. Figure 13 shows such best fit lines for all reliable samples. For comparison, the curves for a sandwich made with eu as the center layer (and with no ground plane) and ~or a thin In sample with no ground plane are also shown. The curves are marked with the thickness
o~ the In layer and with the electron mean ~ree path in the In layer (the mean ~ree path is important to the theory). The fact that the curves in the region of induced superconductivity above the knee are
~airly good straight lines indicates that the current varies
essen-tially exponenessen-tially with temperature in this region (the peculiar behavior o~ the 4.14~ sample, which seems to show no proximity ef~ect
~oo
500 ~
\
~
,0\
20
\\
\ 0
\
'0
'0
m4.\
,
5
.'i.
'f.o
'f.r
Fig.12 Log critical current versus temperature, showing
-.-A-._~
\0
---.
•
-.~S.3~
1
~"tol-/,
-37--'-
4-."t\
't.o
evident. As the thickness of the In increases, the current at any given temperature decreases, and the slope of the exponential region of the curves increases. This is just what we might expect from our pic-ture of the diffusion of superconducting Cooper pairs into the N region. At any given temperature the reduction of current with thick-ness is due to the smaller density of pairs at the center of the
thicker regions, while the increase of slope with thickness is expected from a model in which the current decreases by a given fraction in length L, and thus depends on exp(-2W
N/L), where 2WN is the thick-ness of the N region and L is a temperature-dependent length characteristic of the pair diffusion process.
Another interesting feature is apparent from Fig. 13 As the In becomes thinner, its transition temperature becomes higher. Even for films many microns thick, it is above the transition temperature of pure In in bulk, which is 3.40 K. The transition temperatures of the mean free path test strips were also above the bulk value, although not as much as the sandwich In. Figure 14 shows the transition temperatures of the sandwiches and test strips for the various samples as a function of thickness. It is clear that there is a tendency for the thinner films to have a larger increase (at least in the sandwiches). The most likely cause of the rise is strain in the films, which is known to
increase the transition temperature [23]. Deposition at low temperatures produces a built-in strain in thin films [24], and additional strain
[23] A. Toxen, Phys. Rev. 123, 442 (1961)
'1.'
't.o
3.8
3.&
o
Fig. 14.
-39-Transition temperatures of sandwich and test strip
versus thickness. Black dot - sandwich knee
-41-V. THEORETICAL MODEL AND PREDICTIONS A. Ginzburg-Landau Equation
Gor'kov
[25]
has shown that the superconductivity in a metal near its superconducting transition temperature Tc can be described in terms of a spatially varying energy gap D(r) This gap obeys a Ginzburg-Landau
[26]
type equation(IJ - i ~ A) 2D b
-where e is the charge of a Cooper pair of electrons (twice the elec-tronic charge), A is the vector potential, k is the (temperature dependent) characteristic inverse length for variations of D, and r
B is the (temperature dependent) equilibrium amplitude of D in the interior of a bulk superconductor. Gor'kov also showed that the
current density is given by
j
=
C Im[D*(1J - i ~!) D] (2 )where C is a constant; we see that D*D can be thought of as a
"density of superelectrons". De Gennes
[27J
has shown that in a dirty metal (one in which the electron mean free path 51, is much less than[25J
L. Gor'kov, Zh. Eksp. Teor. Fiz.36,1918 (1959);
[Trans.--Sov. Phys. JETP36, 1364 (1959)J.
[26J
V. Ginzburg and L. Landau, Zh. Eksp. Teor. Fiz.20, 1064 (1950);
Trans.--D. ter Haar, Men of Physics: L. D. Landau I, Pergamon Press, New York,1965)J.
the pure bulk coherence length E, (which in the BCS [28J theory is
o
given by ~o
=
e nv/ Y 'IT 2 kBTc ' where vf is the Fermi velocity of the
metal, and e Y
=
1.7810724 ... ) an equation like Eq. (1) holds at alltemperatures. We shall thus use Eq. (1) as a model for the
supercon-ductivity in our sandwiches; in this formalism the difference between
the S and N regions arises from the fact that
in the two regions. (k is Boltzmann's constant.) B
k and differ
We shall make two simplifying assumptions in order to make
solution of Eq. (1) possible. Firstly, we assume that magnetic field
effects due to external fields, and due to currents in the sample, are
negligible; we thus set A
=
O. Secondly, we suppose that the twosuperconductors on both sides of the center metal impose uniform
bound-ary conditions in the plane of the sandwich, so that the gap in the N
region will vary only across the sandwich, and not in its plane.
Taking a coordinate system with its x axis across the sandwich (see
Fig. 15 ) we can then simplify Eq. (1) to
(Hereafter we denote differentiation with respect to x by a prime.)
The current density becomes
j = C Im(D*D') (4 )
-43-Fig. 15. Schematic illustration of sandwich structure, showing
Writing D in terms of its amplitude and phase D
=
re i0 , we find thatthe real part of Eq. (3) becomes
and the imaginary part can be written in the form
(6)
Equation
(4)
becomesfrom which we see that Eq.
(6)
implies conservation of current, as long as r ~ O. We can use Eq.(7)
to eliminate 0' from Eq.(5)
which then becomes
"
r =
.2 J
B. Temperature Dependence
The constants
k
2
of
2 2
- k (1 - ~) r
2
rB
k
2
and rB 2and r
2
in Eq. Bperature; as we shall see, both are positive
perature T
c and negative above it.
(8)
(8) both vary with
below the transition
tem-According to the de Gennes-Werthamer dirty limit theory
[29J,
the temperature dependence of k2 is found from the implicit equation
where
The quantity 12 is given
the form of Eq. (9 ) that
-45-T 2n ( TC)
and ljJ is the digamma function [30]
12= hv f2
I
6ITkB Tc ITby
=
-~ 2 We see6eY 0
2 2
only on the ratio TIT ,
k 1 depends or
c
from
that k2/T depends on TIT alone. Solutions of Eq. (9 ) are shown
c c
in Fig. 16 for various values of T ; the most interesting feature of c
these curves is the fact that k2 approaches its limiting behavior at
high temperatures only logarithmically, a situation which offers hope
of detecting incipient superconductivity at temperatures above the
tran-sition temperature by measurement of k2. As T becomes much larger
than T we have from Eq. (9) c
2
[1 - 2n(T/T )] c
while near T we find
c
T » T
c
T - T c
At low temperatures k2 approaches a constant value
T « T
c
(10)
For numerical computations it is convenient to have an expression for
-47-k2 which is simpler to use than EQ.
(9)
Above T very accurate c2 Tf2
by =--+2+(--2)x for
l+x 4
results are achieved by approximating X(x)
x < O. (This reproduces the behavior as x approaches -1, and matches value and slope at the origin.) The result (accurate to better than
1%)
of this approximation is2
T
j
2T (Tf4 + Q,n - )
~
4 (Tf4 - 2) Q,n-J '
T ,k212
-
-
T T c T c TT 2 Tf2 T 2 c
c
2(Tf4 - 2) (-+ Q,n - )
4 T
c
Below T the solution of EQ.
(9)
can be fitted with a polynomial inc
(1 -
~)
to give the result (again, good to1%)
c=
~(l
2
1-)
T 8 (T) 2 4 (
1-)
6.0 1 - ~ - . 0 5 1 - T ,T < Tc
Tf c c c
The de Gennes-Werthamer theory is based on the assumption that D is infinitesimal, and thus does not treat the nonlinear term (in
However, de Gennes has discussed this term in the dirty limit [31J; he finds that
r~
is the same as the BCS value, which is found from the implicit integral eQuationflw VE2+ r2 tanh ( 2k T B) c
1
f
B dE (11 )=
NV~
0 \ E + r Bwhere N is the energy density of the states per unit volume at the
Fermi surface, and
V
is the BCS interaction parameter (wc is the
cutoff frequency for the interaction). Equation (11) has been numeri-cally integrated in the limit hw » k T by Muhlschlegel [32J ; we
c B c
can reproduce his results to
1%
accuracy with the polynomialT < T
c
in which we have used the results of BCS that at and that when T is near T
c
The term of Eq. (8)
2
in is dominant only if is small compared to r
,
and so we are not interested in the behavior2
far above T long it is large. Thus approximate the r
B c as as we
behavior above T by a linear extension of the behavior near T
c c
of
r
B
2
=
-3.016(~
kBT )2
(~-
1)y c T T > T c (12)
e c
If needed, a more accurate result could be derived by integrating
(11)
for temperatures above Tc
-49-A physical understanding of k 2 and can be gained from
examining Eq. (8) ( with j = 0 for simplicity) for various temperatures.
When T is below T , r" initially decreases from zero linearly with r c
(see Fig. 17 ). Such negative curvature for positive r indicates stable solutions of the sin or cos type to Eq. (8), and thus shows that
Superconductivity is initially favored. This is because the gain in
energy due to the pairing interaction is greater than the loss of free
energy due to the reduced entropy of the pair state. However, as the
fraction of paired electrons increases (i.e., as r increases), the
pair-ing gain per pair becomes less, and r" increases through zero under the
continued influence of the entropy reduction. At higher temperatures the
entropy contribution is larger, and the initial decrease of r" with r
has smaller slope. Above T it is in fact disadvantageous for the elec-c
trons to pair, and the initial slope of r" is positive; at larger r the
same pair energy decrease as at lower temperatures causes upward
curva-ture of the rtl curve (F' 19. 1'7 ) I •
The initial slope of the r" versus r curve is described by the
coefficient k2, and so we see that this coefficient describes the
bal-ance of pairing and entropy effects. When pairing outweighs entropy
(for small r) k2 is positive, and when entropy outweighs pairing k2 is
negative. The upturning at larger r is due to the term
describes the dropoff of pairing. (We see from Fig.18 that this term
varies slowly with temperature, and because the pairing interaction is
essentially temperature independent while the entropy effects are
strongly temperature dependent, we ascribe this second term to the
pair-ing effects).
From the above argument, the extension of
r~
above Tc is seen as ar"
Fig. 17. r" versus r (from Eq.
(8)
with j= 0) for temperatures
below, at, and above the transition temperature T. Values of r" less than zero indicate that superconductivity is energetically favored.
. ....
:5
1
-51-The variation of r2
B with temperature is shown in Fig. 19
for various values of T ,along with the presumed extension above
c
T
c
We note here that the BCS theory gives the relation
=
C. S Region
1
-(-)
NV e
We will assume that the maximum current through the N region is small enough that in the S region (where r is much larger than
in the N region) the current term j2/C2r 3 in EQ.
(8)
can be ignored. We then have the eQuationr"
=
-k (1 -2 E-)r 22 rB
which can be solved by the standard method of letting p
=
r ' , so thatp
£E.
=
r" , resulting in the first integral dr2
=
B k (1-1
2
r ) 2 -2- r
2rB
(14)
where Bl is the constant of integration. In general, the solution
for r will be in terms of elliptic functions; however when the S
region is thick compared to k -1 (a condition which holds unless
is near T ) r approaches r
B and r' approaches zero in the cs
interior of the S region, and so EQuation (14)
then becomes
,
r:l(L)i
e
1f'ke
50
1.
--.
2
J
-ao
,
\
\
•
..,
8
\
\
,
which integrates to
r'
=
-53-k (2 r - r 2)
12
Br B
k
r =rBtanh[-(x-x)]
12
0D. N Region; Critical Current
In the N region,where T is greater than T , both
c and
k2 are negative, and it is convenient to define the positive
quanti-ties and 2 r m 2
= -r B
From this point we will reserve k and
properties of the S region, and use
region.
for reference to the
a and r to describe the N
m
We first consider the situation r « r
m Equation (3)
then becomes approximately linear
(16)
This equation has the standard solution
D = E cosh(ax) + F sinh(ax)
where E and F are constants set by the boundary conditions. We
presume that the two S regions on either side of the central N
region are identical in their effect on the boundary conditions; D
at the two interfaces. Let the boundaries of the N region be at
x
=
±WN ' and take the total phase difference to be 9 ; without lossof generality we write
±i9j2 e
where rN is the amplitude of D at the N side of the SN interface.
We find
(1'7 )
from which, using Eq.
(4),
we derive the Josephson-type[33J
relationbetween current and phase difference
2 earN
j = --...;;.;.-- sin 9 sinh(2aW
N)
If rN does not depend on 9 (this is true when
(18)
aW » 1 ) , then the
N
largest possible current density comes for sin(g)
=
1 ; this definesthe critical current density jc as
r « r
N m
In the derivation of Eq. (19) we have assumed that r « r
m and as
the maximum value of r is rN we must therefore have rN« rm
When is comparable to or larger than r ,Eq.
(8)
is nom
longer approximately linear, and the calculation of the critical
-55-current is more difficult. We must write down the solution to the
equation for r and then try to match the boundary conditions. Above
the critical current, such matching will not be possible, and so we
can find the critical current as the maximum current for which we can
find a boundary-matched solution to Eq.
(8).
The fundamental equation for r is
r"
=
a2 3
+ - r
2
r
m
(20)
For algebraic simplicity, we utilize the variables
a
=
ax p=
r/rm
and Eq. (20) becomes
d2p
=
~+
+ 3da2 3
p p
p
(21a)
where
A
=
j )2Ca r 2
(21b)
m
We now assume a symmetric solution with and dp do
=
0 atthe center of the N region, where a
=
0 The first integral ofEq.
(21)
is then found by the same method used in theS
region, and isThe change of variable
o
=
p 2 [34] allows the transformation of the second integralo
=
p/2
o
into the standard elliptic integral form
do
=
0/2
(23)0(0 + 2) + 211./0 ]
o 0
The solution for r is then found by standard methods [35] in terms of elliptic fUnctions. There are two types of solution, depending on the relative values of j
1)
Car
j ~ _ _ 0 _
212
r mand r
o
1 2 2
~
2 2 jr 2Y 1
= -
("2 r 0 + r m) +II
(~
r~
+ r m) - 2 (Ca~
)o
~
jr( 1
2
ro 2 + r2)2_ 2( m Ca r m)2 o2
2 r - Y
Y l +
0 1
r
2
)'2
- Y Yl- Y2 (ax 0 2 1cn
2 2r r - Y
m o 2
[34] J. Mathews (private communication).
[35) M. Abramowitz and 1. Stegun, op. cit. p. 591.
-51-COl, r
(r2 2 2) j ~ 0 + 2r )
212 r 0 m
m
/2r2(r2 2
jr )2
I;; = + r ) + 2(C m
o 0 m a r
0
2 2 21;;
r = r - l; + (24b)
0
3r2 2
fi
1 0 + 2r m 1+ cn(ax r2 2 41;;m
These solutions must be fitted to the boundary conditions at the SN interface.
E. Boundary Conditions
De Gennes, on the basis of the dirty approximation
(t
« ~ ) haso
derived [36] the boundary conditions
rN r s
=
NNVN N V s s (25a)
v fN9..N
r' v
fs9..s r'
=
V
N N V s s
(25b)
where the subscripts sand N indicate the values at the edges of the respective regions.
EQuation (15) relates
r'
=
s
r
s and r' by s
[36J P. de Gennes, Rev. Mod. Phys. 36, 225 (1964).
and rN and r'
N can be related by EQ. (22);
2 .2 1 1 2 2 2 2 4
r4) ( r ,)
=
J_ ( - _ - ) + a (r - r ) + a (rN (27 )
N 2 2 2 N 0 2r2 0
c r rN
0 m
We may now eliminate r , r ' , and rN' from EQ. (25), EQ. (26), and EQ.
s s
(27) to yield a relation between
.2 1 1
J_ ( _ _ _ )+
2 2 2 c ro rN
where
r a n d
o rN at the boundary:
(28a)
(28b)
EQuations (24) and (28) must be solved simultaneously (putting
x
=
into EQ. (24) so that r , and thus determineo
the complete solution. (If j > j , no solution exists.) c
In the case where rN« rm ' the situation is considerably
sim-plified. EQuation (17) then applies, and (once more assuming aWN» 1)
we have
Elimination of
then yields
rN
where
G
r r' and s' s' r' N
NNVN
G( /1
=