Article
Temporal Changes in Precipitation and Temperature
and their Implications on the Streamflow of Rosi
River, Central Nepal
Ngamindra Dahal1 , Uttam Babu Shrestha2,*, Anita Tuitui3and Hemant Raj Ojha4
1 South Asia Institute of Advanced Studies (SIAS), Min Bhawan-34, N.K.Singh Marga 306, Kathmandu 44600, Nepal; [email protected]
2 Institute for Life Sciences and the Environment, University of Southern Queensland, Toowoomba 4350,
Australia
3 Central Department of Hydrology and Meteorology, Tribhuvan University, Kathmandu 44618, Nepal;
4 Institute for Studies and Development Worldwide (IFSD) and University of Canberra, Sydney 2000,
Australia; [email protected]
* Correspondence: [email protected]; Tel.: +61-481-098-529
Received: 23 October 2018; Accepted: 21 December 2018; Published: 28 December 2018
Abstract:Nepal has experienced recent changes in two crucial climatic variables: temperature and precipitation. Therefore, climate-induced water security concerns have now become more pronounced in Nepal as changes in temperature and precipitation have already altered some hydrological processes such as the river runoff in some river systems. However, the linkage between precipitation patterns and streamflow characteristics are poorly understood, especially in small rivers. We analysed the temporal trends of temperature, precipitation, and extreme indices of wet and dry spells in the Rosi watershed in Central Nepal, and observed the temporal patterns of the streamflow of the Rosi river. We also examined the linkages between the average and extreme climate indices and streamflow. We found that the area has warmed up by an average of 0.03◦C/year, and has seen a significant decline in precipitation. The dry spell as represented by the maximum length of the dry spell (CDD) and the magnitude of dryness (AII) has become more pronounced, while the wet spell as represented by the number of heavy rainfall days (R5D) and the precipitation intensity on wet days (SDII) has diminished significantly. Our analysis shows that recent changes in precipitation patterns have affected the streamflow of the Rosi river, as manifested in the observed decline in annual and seasonal streamflows. The decrease in the availability of water in the river is likely to have severe consequences for water security in the area.
Keywords:Himalaya; streamflow; extreme rainfall; watershed
1. Introduction
The impact of climate change on water availability is a major concern worldwide, and the question of how water systems remain resilient under changing climate conditions has dominated the world’s science and policy agenda recently [1,2]. Such a climate-induced water security concern is nowhere more visible than in the Himalayan region. Climate change has significantly impacted the glaciers and water resources in the Himalayan region, which is the water tower of Asia that provides water and related hydrological services to 1.3 billion people downstream, from Afghanistan in the west to Vietnam in the east [3,4]. The melting of snow and glaciers is a significant hydrological process in this region that sustains the flows of rivers during the dry season [3], and this crucial hydrological process is being affected by climate change, particularly regarding changes in temperature and precipitation [5].
Climate2019,7, 3 2 of 15
Furthermore, rising temperature and changes in precipitation alter some components of hydrological systems such as precipitation extremes, increasing evaporation, and changes in river runoff [6,7]. Due to these climate-induced changes, two major impacts on hydrological systems are expected to escalate. First, the availability of water and related hydrological services are likely to decrease due to the recession of glaciers in the Himalaya [8]. Second, climate hazards such as flood and drought due to precipitation extremes are expected to increase with climate change [7]. Such fundamental alterations in the hydrological regime, which are attributed primarily to climate change, will have a cascading impact on the irrigated agriculture and installed hydropower capacity, as well as the biodiversity and natural resources [9], and will eventually intensify the regional conflicts in this region [10].
When aggregated at the national level, water is one of the most abundant natural resources in the Himalayan country of Nepal [11]. Most of the rivers of Nepal are snow and glacier-fed, and the melting of snow and glaciers provides sustained flows during dry seasons [12,13]. However, the narrative of a national-scale water surplus hides the stark reality of many localities and regions facing acute water shortages [14]. A higher rate of warming than the global average [11,15], erratic rainfall with a greater spatial and temporal variability [16], and a prolonged drought spell [17] have been reported recently in Nepal, which clearly indicate the growing impact of climate change in the country. Consistent with these research findings, Nepal is already considered the 14 most vulnerable country in the world in terms of the climate change vulnerability index [18]. As reported elsewhere, the observed and predicted changes in the climate are likely to alter Nepal’s hydrological systems. Combined with the rapid land-use transformations taking place across many of the mountain landscapes of Nepal, climate change is poised to escalate water insecurity in many water-deficit regions of the country, including several hilltop cities such as Dhulikhel in the central Nepal Himalaya, which could have severe consequences for the amount and seasonality of water availability. The effect of water scarcity has already been pronounced in many villages due to the drying up of local water sources that have, in some instances, created competitions and conflicts [19], as well as forced migration [20].
Streamflow is an important hydrological variable that can be used as an indicator of hydrological responses to climate change and variability [21–23]. It is determined by catchment heterogeneity (land use, anthropogenic water usage) along with hydroclimatic processes such as precipitation, temperature, infiltration, and evapotranspiration [4,24]. Climate change or variability contribute to the increased variability of stream runoff due to changes in the timing, frequency, and intensity of precipitation events [13]. Therefore, analysing streamflow trends in watersheds and identifying the causes and drivers of changes has been a focus of hydrological research globally [21,23], including in Nepal [24,25]. In recent decades, runoff changes in Nepalese rivers have been reported as being associated with the effects of climate change [11,24]. Fluctuations in the natural streamflow affect water availability, which has direct consequences on the livelihood of the people who are heavily dependent on streamflow for agriculture. It also has a potential impact on the economic development of the country, whose economy largely depends on agriculture and hydropower development.
association between streamflow and climatic parameters. The streamflow dynamic in Rosi is directly linked to the availability of water for anthropogenic usage such as drinking.
The Rosi watershed supplies drinking water to three municipalities in the Kavre district in central Nepal: namely, Panauti, Banepa, and Dhulikhel. For the last few decades, a large part of Rosi water has been diverted to cater to the drinking water needs of Dhulikhel, and more recently to the two other cities, too. The Rosi-based water supply scheme also has a history of conflict and cooperation between upstream rural and downstream urban communities, which are themselves undergoing rapid change in relation to urbanisation, livelihood trajectories, and farming practices. The results of this study could be useful to the similar watersheds of Nepal and in other mountainous countries. The three specific objectives of this study are to: (a) investigate the spatial and temporal trends of temperature and precipitation as well as moderate extreme indices related to precipitation; (b) analyse the temporal streamflow trends of the Rosi river based on the available dataset (from 1971 to 2014); and (c) assess the linkage between the river discharge with precipitation parameters in the Rosi river watershed.
2. Materials and Methods
2.1. Study Area
Climate2019,7, 3 4 of 15
[image:4.595.179.416.88.339.2]Climate 2018, 6, x FOR PEER REVIEW 4 of 15
Figure 1. Map of the study area showing average monthly temperature and precipitation (climatology) calculated for the period between 1971–2014.
2.2. Data
The historical meteorological and hydrological data for the Rosi river basin were collected from the Department of Hydrology and Meteorology (DHM), Nepal. There are three meteorological stations (Kophasi, Dhulikhel: index number 1024, and Godavari: index number 1022) located in and around the watershed boundary area (Figure 1). However, temperature data were available only for the Godavari meteorological station. The meteorological data from the year 1971 to 2014 that were used in this analysis include the daily precipitation, as well as the minimum and maximum temperature. The gauge flow data measured at Panauti gauging station (index number 1049) was also collected from the DHM. The hydrological station in Panauti and meteorological station in Kophasi were located within a kilometer distance.
2.3. Data Analysis
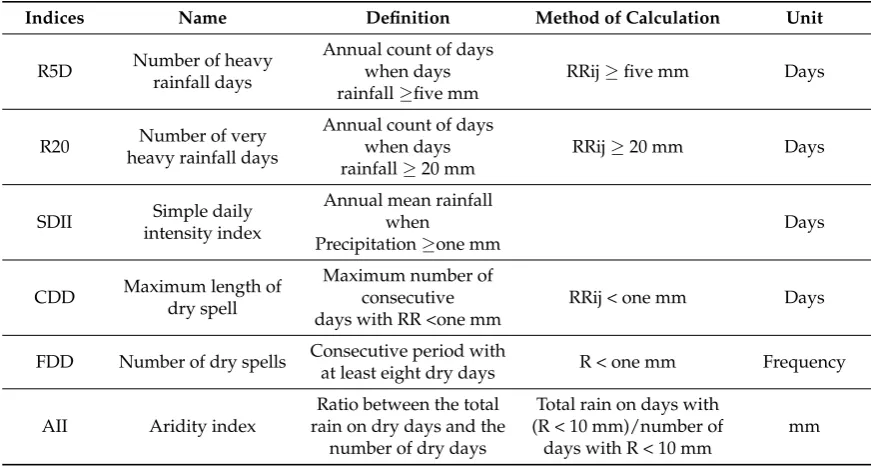
We calculated trends of annual, seasonal, and maximum (extreme) discharge on the streamflow. We conducted a regression analysis to identify the trends in the river discharge. We also compared the spatial variation in precipitation trends among three stations, and analysed temporal changes in the precipitation and temperature trends using linear regression. Seasonal analysis was based on four seasons: winter (December–February), pre-monsoon (March–May), monsoon (June–September), and post-monsoon (October–November). To understand the climate dynamics, moderate climate extreme indices that describe events with short return periods are appropriate [37]. Currently, 27 different climate extreme indices were suggested by CCl/CLIVAR (Commission for Climatology/Climate and Ocean: Variability, Predictability and Change)/JCOMM (Joint World Meteorological Organization(WMO)-Intergovernmental Oceanographic Commission(IOC), Technical Commission for Oceanography and Marine Meteorology Expert Team (ET) on Climate Change Detection and Indices (ETCCDI) [38]. We selected six indices; three were related to the dry spell (CDD, maximum length of the dry spell; FDD, the number of dry spells; and AII, the magnitude of dryness) and three were related to the wet spell (SDII, the precipitation intensity on wet days; R5D, the number of heavy rainfall days; and R20, the frequency of extremely heavy precipitation) for moderate precipitation extremes. These indices represent both the intensity and duration of dry and wet spells and are directly related to the streamflow. The details of those indices are given in Table 1. We used the Mann–Kendall test [39,40] for detecting trends in temperature, precipitation, precipitation extremes,
Figure 1.Map of the study area showing average monthly temperature and precipitation (climatology) calculated for the period between 1971–2014.
2.2. Data
The historical meteorological and hydrological data for the Rosi river basin were collected from the Department of Hydrology and Meteorology (DHM), Nepal. There are three meteorological stations (Kophasi, Dhulikhel: index number 1024, and Godavari: index number 1022) located in and around the watershed boundary area (Figure1). However, temperature data were available only for the Godavari meteorological station. The meteorological data from the year 1971 to 2014 that were used in this analysis include the daily precipitation, as well as the minimum and maximum temperature. The gauge flow data measured at Panauti gauging station (index number 1049) was also collected from the DHM. The hydrological station in Panauti and meteorological station in Kophasi were located within a kilometer distance.
2.3. Data Analysis
wet spells and are directly related to the streamflow. The details of those indices are given in Table1. We used the Mann–Kendall test [39,40] for detecting trends in temperature, precipitation, precipitation extremes, and streamflow. The Mann–Kendall test is a non-parametric test that is used to identify a trends in time-series data such as precipitation and temperature. This test is a widely-used test to detect significant trends in hydroclimatic data [16,21,27,29]. This test is not affected by the actual distribution of the data and is less sensitive to outliers. Therefore, it is more suitable for detecting trends in climatic and hydrological data, which are usually skewed, and may contain outlier observations [41]. We used Sen’s non-parametric estimate of the slope to determine the magnitude of trends [42], as the Mann–Kendall test can examine the time series trend, but not the extent. The relationship between precipitation parameters (annual and monthly averages, and precipitation extremes) and discharge was calculated using Pearson’s correlation.
Table 1.Description of the indices.
Indices Name Definition Method of Calculation Unit
R5D Number of heavy
rainfall days
Annual count of days when days rainfall≥five mm
RRij≥five mm Days
R20 Number of very
heavy rainfall days
Annual count of days when days rainfall≥20 mm
RRij≥20 mm Days
SDII Simple daily
intensity index
Annual mean rainfall when
Precipitation≥one mm
Days
CDD Maximum length of
dry spell
Maximum number of consecutive days with RR <one mm
RRij < one mm Days
FDD Number of dry spells Consecutive period with
at least eight dry days R < one mm Frequency
AII Aridity index
Ratio between the total rain on dry days and the
number of dry days
Total rain on days with (R < 10 mm)/number of
days with R < 10 mm
mm
RR is the daily precipitation amount on the day in a period. R5D is the number of heavy rainfall days. R20 is the frequency of extremely heavy precipitation. SDII is the precipitation intensity on wet days. CDD is the maximum length of the dry spell. FDD is the number of dry spells. AII is the magnitude of dryness.
3. Results
3.1. Spatial and Temporal Patterns of Precipitation
Climate2019,7, 3 6 of 15
[image:6.595.178.419.88.256.2]Climate 2018, 6, x FOR PEER REVIEW 6 of 15
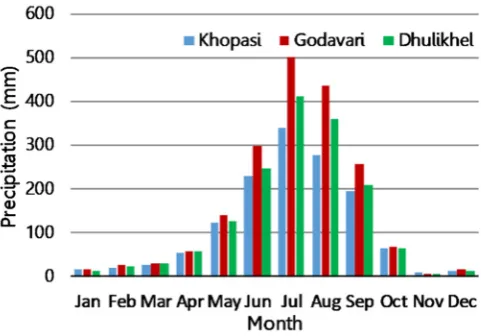
[image:6.595.89.509.623.678.2]Figure 2. Variations in averaged (1971–2014) monthly precipitation patterns in three meteorological stations.
Figure 3. Temporal trends of annual precipitation in three meteorological stations. The grey shadows represent the standard error of the regression line.
3.2. Trends in Precipitation Extremes
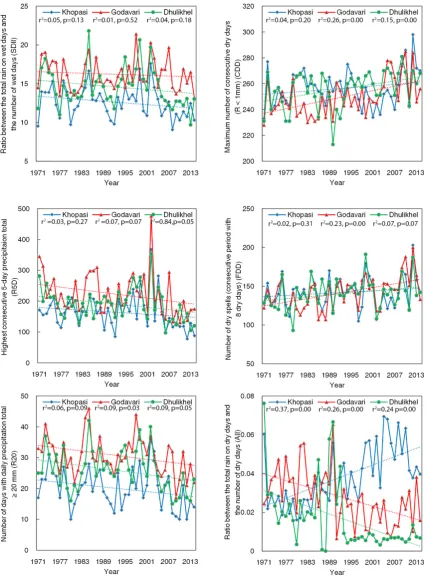
Overall, the dry spell in the study area was increasing, while the wet spell was decreasing (Figure 4). Three wetness indices (SDII, R5D, and R20) showed a significant decrease in the study area, suggesting that the duration and intensity of the heavy precipitation events in the area have declined over the study period. SDII, which measures the precipitation intensity on wet days, showed a significant decreasing trend in Khopasi (−0.047/year, p= 0.040). The Godavari had a maximum decrease (−1.451/year, p= 0.018) in the number of heavy rainfall days (R5D), and Dhulikhel had a maximum decrease (0.167/year, p =0.038) in the frequency of extremely heavy precipitation, R20 (Table 3).
Figure 2. Variations in averaged (1971–2014) monthly precipitation patterns in three meteorological stations.
Climate 2018, 6, x FOR PEER REVIEW 6 of 15
Figure 2. Variations in averaged (1971–2014) monthly precipitation patterns in three meteorological stations.
Figure 3. Temporal trends of annual precipitation in three meteorological stations. The grey shadows represent the standard error of the regression line.
3.2. Trends in Precipitation Extremes
Overall, the dry spell in the study area was increasing, while the wet spell was decreasing (Figure 4). Three wetness indices (SDII, R5D, and R20) showed a significant decrease in the study area, suggesting that the duration and intensity of the heavy precipitation events in the area have declined over the study period. SDII, which measures the precipitation intensity on wet days, showed a significant decreasing trend in Khopasi (−0.047/year, p= 0.040). The Godavari had a maximum decrease (−1.451/year, p= 0.018) in the number of heavy rainfall days (R5D), and Dhulikhel had a maximum decrease (0.167/year, p =0.038) in the frequency of extremely heavy precipitation, R20 (Table 3).
Figure 3.Temporal trends of annual precipitation in three meteorological stations. The grey shadows represent the standard error of the regression line.
Table 2.Trends in the annual and seasonal precipitation.
Weather Stations Annual Pre-Monsoon Monsoon Post-Monsoon Winter
Khopasi −6.296 0.300 −6.260 * −0.386 −0.215
Godavari −10.435 * 0.501 −10.358 * −0.207 −0.117
Dhulikhel −9.122 * −0.349 −7.120 * −0.922 −0.162
*p=< 0.05.
3.2. Trends in Precipitation Extremes
declined over the study period. SDII, which measures the precipitation intensity on wet days, showed a significant decreasing trend in Khopasi (−0.047/year,p= 0.040). The Godavari had a maximum decrease (−1.451/year,p= 0.018) in the number of heavy rainfall days (R5D), and Dhulikhel had a maximum decrease (0.167/year,p= 0.038) in the frequency of extremely heavy precipitation, R20
(TableClimate 32018). , 6, x FOR PEER REVIEW 7 of 15
Figure 4. Trends of different wet and dry indices.
[image:7.595.85.512.166.744.2]AII, CDD, and FDD are dryness indices that are used to study trends in the dry spell. The magnitude of dryness (AII) has significantly increased, albeit at a small rate in Khopasi and Dhulikhel, but decreased in Godavari. A maximum number of consecutive dry days as measured by CDD (maximum length of the dry spell) significantly increased in Godavari and Dhulikhel. A significant increase in FDD (number of dry spells) was observed only in Godavari.
Climate2019,7, 3 8 of 15
[image:8.595.105.493.185.275.2]AII, CDD, and FDD are dryness indices that are used to study trends in the dry spell. The magnitude of dryness (AII) has significantly increased, albeit at a small rate in Khopasi and Dhulikhel, but decreased in Godavari. A maximum number of consecutive dry days as measured by CDD (maximum length of the dry spell) significantly increased in Godavari and Dhulikhel. A significant increase in FDD (number of dry spells) was observed only in Godavari.
Table 3.Trends (Sen’s slope) in the dryness and wetness indices.
Khopasi Godavari Dhulikhel
AII 0.0007 *** −0.0005 *** 0.0004 ***
CDD 0.0001 0.148 *** 0.537 ***
FDD 0.250 0.707 ** 0.375
SDII −0.047 ** −0.018 −0.041 *
R5D −1.125 ** −1.452 ** −1.363 **
R20 −0.143 * −0.149 * −0.167 **
*** = 0.001, ** = < 0.05, * = < 0.10
3.3. Temporal Patterns of Temperature
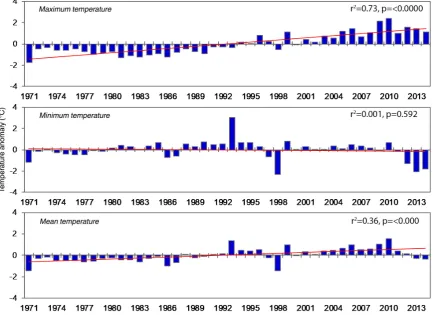
The annual mean, maximum, and minimum temperature recorded only at the Godavari station were analysed (Figure5), as the data were available only to this station. The annual mean temperature trend showed that the area warmed up by 0.03◦C/year (p=< 0.0001). The maximum temperature in the study area increased at a rate of 0.067◦C/year, and the minimum temperature increased at a rate of 0.005◦C/year over the last 44 years. The increasing trend in mean annual temperature over the past four decades is consistent with the national and global averages.
Climate 2018, 6, x FOR PEER REVIEW 8 of 15
Table3. Trends (Sen’s slope) in the dryness and wetness indices.
Khopasi Godavari Dhulikhel
AII 0.0007 *** −0.0005 *** 0.0004 *** CDD 0.0001 0.148 *** 0.537 ***
FDD 0.250 0.707 ** 0.375
SDII −0.047 ** −0.018 −0.041 * R5D −1.125 ** −1.452 ** −1.363 ** R20 −0.143 * −0.149 * −0.167 **
*** = 0.001, ** = < 0.05, * = < 0.10
3.3. Temporal Patterns of Temperature
[image:8.595.83.518.427.742.2]The annual mean, maximum, and minimum temperature recorded only at the Godavari station were analysed (Figure 5), as the data were available only to this station. The annual mean temperature trend showed that the area warmed up by 0.03 °C/year (p =< 0.0001). The maximum temperature in the study area increased at a rate of 0.067 °C/year, and the minimum temperature increased at a rate of 0.005 °C/year over the last 44 years. The increasing trend in mean annual temperature over the past four decades is consistent with the national and global averages.
Figure 5. Mean, maximum, and minimum temperature anomalies with respect to 1971–2014.
3.4. Hydrological Change and Its Linkage with Precipitation Indices
The annual river discharge pattern from 1971 to 2014 indicates a gradual decline of the river flow, and the trend is statistically significant at the 10% significance level based on the Mann–Kendall test (Figure 6). The trend slope based on Sen’s method showed that the rate of decrease in the mean annual discharge of the Rosi river was −0.015m3/s/year (p = 0.08) over the last 44 years. The monthly
3.4. Hydrological Change and Its Linkage with Precipitation Indices
The annual river discharge pattern from 1971 to 2014 indicates a gradual decline of the river flow, and the trend is statistically significant at the 10% significance level based on the Mann–Kendall test (Figure 6). The trend slope based on Sen’s method showed that the rate of decrease in the mean annual discharge of the Rosi river was−0.015m3/s/year (p= 0.08) over the last 44 years. The monthly average discharge reached a maximum in August and a minimum in December (Figure7). Seasonally, the maximum flow of river occurred during the monsoon season (June–September), whereas the minimum flow occurred during the winter (December–February). In the post-monsoon season (October–November), the flow in the river is sustained by the infiltration supply available in the monsoon season. The trends of seasonal flows in the winter, monsoon, and post-monsoon showed negative trends except for the pre-monsoon, and a positive but statistically significant trend was found only in the streamflow in the monsoon season (−0.041m3/s/year,p= 0.04).
Climate 2018, 6, x FOR PEER REVIEW 9 of 15
[image:9.595.171.424.273.681.2]Seasonally, the maximum flow of river occurred during the monsoon season (June–September), whereas the minimum flow occurred during the winter (December–February). In the post-monsoon season (October–November), the flow in the river is sustained by the infiltration supply available in the monsoon season. The trends of seasonal flows in the winter, monsoon, and post-monsoon showed negative trends except for the pre-monsoon, and a positive but statistically significant trend was found only in the streamflow in the monsoon season (−0.041m3/s/year, p = 0.04).
Figure 6. Trends of annual discharge.
Figure 7. Monthly average of the discharge calculated for the period between 1971–2014.
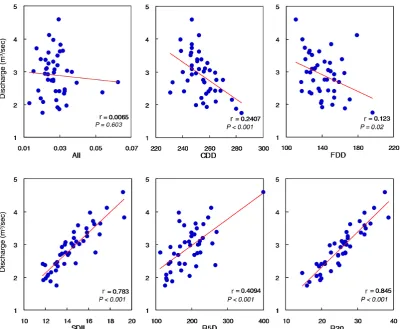
[image:9.595.175.426.494.709.2]The annual streamflow in the Rosi river was highly correlated with annual precipitation. Figure 8 illustrates a high correlation between the annual precipitation and the runoff in the Rosi river (Pearson correlation (r) = 0.83, p =< 0.001). Not only the annual precipitation and annual runoff were significantly correlated, a strong correlation between the runoff and the dry spell and wet spell indices was also observed in the study area. CCD and FDD were negatively correlated with discharge, while SDII, R5D, and R20 showed a significant positive correlation, suggesting that the flow of the river was highly dependent on the extreme precipitation events (Figure 9). We did not find any significant correlation between the annual temperature and the annual discharge, indicating
Figure 6.Trends of annual discharge.
Climate 2018, 6, x FOR PEER REVIEW 9 of 15
Seasonally, the maximum flow of river occurred during the monsoon season (June–September), whereas the minimum flow occurred during the winter (December–February). In the post-monsoon season (October–November), the flow in the river is sustained by the infiltration supply available in the monsoon season. The trends of seasonal flows in the winter, monsoon, and post-monsoon showed negative trends except for the pre-monsoon, and a positive but statistically significant trend was found only in the streamflow in the monsoon season (−0.041m3/s/year, p = 0.04).
Figure 6. Trends of annual discharge.
Figure 7. Monthly average of the discharge calculated for the period between 1971–2014.
The annual streamflow in the Rosi river was highly correlated with annual precipitation. Figure 8 illustrates a high correlation between the annual precipitation and the runoff in the Rosi river (Pearson correlation (r) = 0.83, p =< 0.001). Not only the annual precipitation and annual runoff were significantly correlated, a strong correlation between the runoff and the dry spell and wet spell indices was also observed in the study area. CCD and FDD were negatively correlated with discharge, while SDII, R5D, and R20 showed a significant positive correlation, suggesting that the flow of the river was highly dependent on the extreme precipitation events (Figure 9). We did not find any significant correlation between the annual temperature and the annual discharge, indicating
Figure 7.Monthly average of the discharge calculated for the period between 1971–2014.
Climate2019,7, 3 10 of 15
correlation (r) = 0.83,p=< 0.001). Not only the annual precipitation and annual runoff were significantly correlated, a strong correlation between the runoff and the dry spell and wet spell indices was also observed in the study area. CCD and FDD were negatively correlated with discharge, while SDII, R5D, and R20 showed a significant positive correlation, suggesting that the flow of the river was highly dependent on the extreme precipitation events (Figure9). We did not find any significant correlation between the annual temperature and the annual discharge, indicating that the increasing temperature in the Rosi watershed may have had a minimum role in the streamflow.
Climate 2018, 6, x FOR PEER REVIEW 10 of 15
[image:10.595.83.514.197.376.2]that the increasing temperature in the Rosi watershed may have had a minimum role in the streamflow.
Figure 8. (a) Temporal trends of annual discharge and annual precipitation; (b) correlation between annual discharge and annual precipitation.
[image:10.595.99.501.414.743.2]Figure 9. Correlation of annual discharge with different wet and dry spells.
Figure 8.(a) Temporal trends of annual discharge and annual precipitation; (b) correlation between annual discharge and annual precipitation.
Climate 2018, 6, x FOR PEER REVIEW 10 of 15
that the increasing temperature in the Rosi watershed may have had a minimum role in the streamflow.
Figure 8. (a) Temporal trends of annual discharge and annual precipitation; (b) correlation between annual discharge and annual precipitation.
Figure 9. Correlation of annual discharge with different wet and dry spells.
4. Discussion
We analysed runoff trends and assessed various climatic drivers of the runoff change, along with the trends in the temperature, precipitation, and extreme precipitation indices. Our results of the decreasing annual precipitation and increasing warming and precipitation extremes resonate with the results that have been reported in previous studies [16,17,27]. Although, at the national level, the precipitation pattern has remained more or less stable, a large spatial variability in precipitation has been observed across various localities in Nepal [16]. In western Nepal’s Karnali basin, for example, the annual precipitation is following a declining trend [27], while in the Gandaki Basin in central Nepal, annual rainfall has remained stable [26]. The seasonality and magnitude of rainfall were found to be more or less constant in the high mountain areas of Nepal [43]. We did not observe any trends in seasonal rainfalls except in the monsoon, which was declining, although some studies [26] reported a significant increase in monsoon rainfall, while post-monsoon, pre-monsoon, and winter rainfalls were decreasing. This indicates not only spatial heterogeneity in the precipitation pattern, but also a seasonal variation in the precipitation trends in different localities of Nepal.
Our results of an increasing dry spell (the number of consecutive dry days) and decreasing wet spell (the number of rainy days) are consistent with the findings of Karki et al. (2017), who reported a significant positive trend in the number of consecutive dry days and a significant negative trend in the number of rainy days. This implies the prolongation of the dry spell of the study area. More importantly, our finding reinforces the commonly reported experience of the local people of Nepal. In a recent national survey, about 86.1% (n = 5060) of the respondents reported that they had experienced drought, and 99.3% respondents reported increasing drought over the past 25 years [44]. Likewise, our findings on warming trends are similar to those reported in previous studies that have been conducted in other areas of the country [11,43,45].
On a national-level analysis, both increasing (59%) and decreasing (41%) streamflow trends were found in Nepal [24]. Our result of a decline in streamflow parallels with the streamflow in the Bagmati river [32], but contradicts with the streamflow of the Jhikhu river, where an upward trend of streamflow was reported [24]. The streamflows of Nepalese rivers are determined by several factors such as the quantum of melting snow, glacier, groundwater, and precipitation [12,24,27]. In the small and non-snowfed rivers such as Bagmati and Jhikhu, streamflow is highly dependent on precipitation events [24,32], which means that runoff events in the mid-hills catchments of such small rivers are closely correlated to the rainfall intensity [46].
In the glacier-fed or snowfed river, temperature and discharge are correlated, as an increasing temperature accelerates the ablation process [47]. The role of temperature in non-snowfed river system such as that of the Rosi river is expected to be minimal; therefore, as shown in our results, temperature has a minimum role in the river discharge. Increasing temperature causes the melting of snow and glaciers, enhancing river flows noticeably in the pre-monsoon and winter season in snowfed rivers [24]. In such snowfed river systems, the role of temperature is more pronounced than the role of precipitation. For example, the streamflow in the snowfed Karnali river remains constant with a decreasing precipitation trend [27]. A significant increase in the annual runoff with increasing air temperature and decreasing precipitation was observed on the Tibetan side of the Himalayan region [48]. Therefore, global phenomena such as increasing temperature might have a lesser effect in a non-snowfed river such as Rosi compared to snowfed river systems.
Climate2019,7, 3 12 of 15
1976 to 2014, with a decrease in the agricultural and barren land [53]. In the headstream of Rosi, there are several small streams (Muldole Khola, Khar Khola, Gudgude Khola, Bairamahadev Kholsi, and Shishakhani Kholsi), and most of the headstream is under forest cover. Due to the difficult and steep terrain, water usage in the upstream areas is very low. However, our research does not make a final claim between forest condition and streamflow, as there is a range of other factors, such as stone quarrying, agricultural intensification, and others are at play in the catchment, all collectively impacting the runoff. Therefore, changes in land use, particularly a recent increase in the forest in the upper part of the watershed, might have contributed to the decline in runoff downstream by increasing the use of water for evapotranspiration and reducing infiltration.
This study shows that the Rosi watershed has undergone changes in climatic parameters. We also observed that the region has undergone significant land-use transformation. The area has warmed up and received less rainfall, with increasing dry spells and decreasing wet spells. Both the change in climatic factors—particularly precipitation—and local land use have impacted the streamflow of the Rosi river, leading to a decline in the annual and seasonal discharges. While our analysis demonstrates a significant causal association between precipitation parameters and streamflow trends, this study has not been able to segregate the impact of land-use change in the upstream regions. Our fieldwork and interviews with local seniors conducted between November 2014 and May 2016 confirm their experience of receiving increasingly less rainfall in recent years, and that the condition of forest in the watershed has improved. Therefore, a more detailed study is needed to understand the role of land use and management, particularly regarding how the increased area of forest affects water availability in the downstream of the Rosi river.
Considering the projected impact of climate change, proper adaptation strategies and plans need to be formulated and implemented in order to cope with the escalating water insecurity challenge in the study area. The strategy for securing water access should also incorporate measures to monitor the impact of changing land use, including how increasing forest areas affect the hydrological cycle in the small watershed of the Rosi river. Such monitoring of the forest–hydrology relationship is particularly important, given the contradictory scientific claims being made on the link [52]: it is widely anticipated that forests play a crucial role in water recharge; however, the opposite was true in many cases [51]. While this study has generated some insights into the relationship among the changes in precipitation and hydrological systems, a robust monitoring system needs to be established in order to help the adaptive management of water and watersheds to secure the water future of the region. Neither national nor a large river basin-based approach can generate the evidence that is needed to ensure locality-specific sustainable water management systems in the Himalayan region.
5. Conclusions
The decline of streamflow would cause a shortage of water for domestic, agricultural, and industrial uses in the downstream. If the current trend of declining water flows and increasing population growth continue, water insecurity will be exacerbated. The decline in the availability of water, especially in the dry season will have severe consequences for water security in the Rosi Valley. While the national level studies showed a vast heterogeneity in precipitation and streamflow patterns, local research such as this provides vital evidence to inform local-level water management planning.
Author Contributions: N.D.—Study design, data collection and manuscript writing, U.B.S.—Data analysis, manuscript writing, A.T.—Data analysis, manuscript writing, H.R.O.—Study design, manuscript writing.
Funding:UK Ecosystem Services and Poverty Alleviation (ESPA) supported project “The political economy of water Security, ecosystem services and livelihoods in the Western Himalayas” and Canadian International Development Research Center funded project “Climate Adaptive Water Management Plans for Cities in South Asia”.
Cambridge University. The analysis of data and follow up study for this paper was supported by Canadian International Development Research Center funded project “Climate Adaptive Water Management Plans for Cities in South Asia”.
Conflicts of Interest:No conflict of Interest.
References
1. Vörösmarty, C.J.; Green, P.; Salisbury, J.; Lammers, R.B. Global water resources: Vulnerability from climate change and population growth.Science2000,289, 284–288. [CrossRef] [PubMed]
2. Arnell, N.W.; van Vuuren, D.P.; Isaac, M. The implications of climate policy for the impacts of climate change on global water resources.Glob. Environ. Chang.2011,21, 592–603. [CrossRef]
3. Immerzeel, W.W.; Droogers, P.; De Jong, S.M.; Bierkens, M.F.P. Large-scale monitoring of snow cover and runoff simulation in Himalayan river basins using remote sensing.Remote Sens. Environ.2009,113, 40–49. [CrossRef]
4. Li, H.; Xu, C.Y.; Beldring, S.; Tallaksen, L.M.; Jain, S.K. Water resources under climate change in Himalayan basins.Water Resour. Manag.2016,30, 843–859. [CrossRef]
5. Barnett, T.P.; Adam, J.C.; Lettenmaier, D.P. Potential impacts of a warming climate on water availability in snow-dominated regions.Nature2005,438, 303. [CrossRef] [PubMed]
6. Xu, H.; Taylor, R.G.; Xu, Y. Quantifying uncertainty in the impacts of climate change on river discharge in sub-catchments of the Yangtze and Yellow River Basins, China.Hydrol. Earth Syst. Sci.2011,15, 333–344. [CrossRef]
7. Bolch, T.; Kulkarni, A.; Kääb, A.; Huggel, C.; Paul, F.; Cogley, J.G.; Frey, H.; Kargel, J.S.; Fujita, K.; Scheel, M.; et al. The state and fate of Himalayan glaciers.Science2012,336, 310–314. [CrossRef]
8. Immerzeel, W.W.; Van Beek, L.P.; Bierkens, M.F. Climate change will affect the Asian water towers.Science
2010,328, 1382–1385. [CrossRef]
9. Xu, J.; Grumbine, R.E.; Shrestha, A.; Eriksson, M.; Yang, X.; Wang, Y.U.N.; Wilkes, A. The melting Himalayas: Cascading effects of climate change on water, biodiversity, and livelihoods.Conserv. Biol.2009,23, 520–530. [CrossRef]
10. Akhtar, M.; Ahmad, N.; Booij, M.J. The impact of climate change on the water resources of Hindukush–Karakorum–Himalaya region under different glacier coverage scenarios. J. Hydrol. 2008, 355, 148–163. [CrossRef]
11. Shrestha, A.B.; Aryal, R. Climate change in Nepal and its impact on Himalayan glaciers.Reg. Environ. Chang.
2011,11, 65–77. [CrossRef]
12. Nepal, S.; Krause, P.; Flügel, W.A.; Fink, M.; Fischer, C. Understanding the hydrological system dynamics of a glaciated alpine catchment in the Himalayan region using the J2000 hydrological model.Hydrol. Process.
2014,28, 1329–1344. [CrossRef]
13. Pradhananga, N.S.; Kayastha, R.B.; Bhattarai, B.C.; Adhikari, T.R.; Pradhan, S.C.; Devkota, L.P.; Shrestha, A.B.; Mool, P.K. Estimation of discharge from Langtang River basin, Rasuwa, Nepal, using a glacio-hydrological model.Ann. Glaciol.2014,55, 223–230. [CrossRef]
14. Ojha, H. High and Dry. Kathmandu Post, 21 October 2016. Available online: http://kathmandupost. ekantipur.com/news/2016-10-21/high-and-dry-20161021081608.html(accessed on 14 June 2017).
15. Shrestha, U.B.; Gautam, S.; Bawa, K.S. Widespread climate change in the Himalayas and associated changes in local ecosystems.PLoS ONE2012,7, e36741. [CrossRef] [PubMed]
16. Duncan, J.M.; Biggs, E.M.; Dash, J.; Atkinson, P.M. Spatio-temporal trends in precipitation and their implications for water resources management in climate-sensitive Nepal.Appl. Geogr. 2013,43, 138–146. [CrossRef]
17. Karki, R.; Schickhoff, U.; Scholten, T.; Böhner, J. Rising precipitation extremes across Nepal.Climate2017, 5, 4. [CrossRef]
18. Eckstein, D.; Kunzel, V.; Schafer, L.Global Climate Risk Index 2018; Germanwatch e.V.: Bonn, Germany, 2017; Available online:https://germanwatch.org/sites/germanwatch.org/files/publication/20432.pdf(accessed on 27 December 2018).
Climate2019,7, 3 14 of 15
20. Bernet, D. Fleeing Drought D+C Development and Cooperation. 29 April 2013. Available online: https://www.dandc.eu/en/article/climate-change-nepal-entire-villages-must-relocate-because-water-scarcity-getting-worse(accessed on 16 June 2017).
21. Tao, H.; Gemmer, M.; Bai, Y.; Su, B.; Mao, W. Trends of streamflow in the Tarim River Basin during the past 50 years: Human impact or climate change?J. Hydrol.2011,400, 1–9. [CrossRef]
22. Fu, G.; Charles, S.P.; Viney, N.R.; Chen, S.; Wu, J.Q. Impacts of climate variability on stream-flow in the Yellow River.Hydrol. Process. Int. J.2007,21, 3431–3439. [CrossRef]
23. Zhao, J.; Qiang, H.; Jianxia, C.; Dengfeng, L.; Shengzhi, H.; Xiaoyu, S. Analysis of temporal and spatial trends of hydro-climatic variables in the Wei River Basin.Environ. Res.2015,139, 55–64. [CrossRef]
24. Gautam, M.R.; Acharya, K. Streamflow trends in Nepal.Hydrol. Sci. J.2012,57, 344–357. [CrossRef] 25. Immerzeel, W.W.; Van Beek, L.P.H.; Konz, M.; Shrestha, A.B.; Bierkens, M.F.P. Hydrological response to
climate change in a glacierized catchment in the Himalayas.Clim. Chang.2012,110, 721–736. [CrossRef] [PubMed]
26. Panthi, J.; Dahal, P.; Shrestha, M.L.; Aryal, S.; Krakauer, N.Y.; Pradhanang, S.M.; Lakhankar, T.; Jha, A.; Sharma, M.; Karki, R. Spatial and temporal variability of rainfall in the Gandaki River Basin of Nepal Himalaya.Climate2015,3, 210–226. [CrossRef]
27. Khatiwada, K.R.; Panthi, J.; Shrestha, M.L.; Nepal, S. Hydro-climatic variability in the Karnali River Basin of Nepal Himalaya.Climate2016,4, 17. [CrossRef]
28. Shrestha, S.; Shrestha, M.; Babel, M.S. Modelling the potential impacts of climate change on hydrology and water resources in the Indrawati River Basin, Nepal.Environ. Earth Sci.2016,75, 280. [CrossRef]
29. Nepal, S. Impacts of climate change on the hydrological regime of the Koshi river basin in the Himalayan region.J. Hydro-Environ. Res.2016,10, 76–89. [CrossRef]
30. Agarwal, A.; Babel, M.S.; Maskey, S. Analysis of future precipitation in the Koshi river basin, Nepal.J. Hydrol.
2014,513, 422–434. [CrossRef]
31. Devkota, L.P.; Gyawali, D.R. Impacts of climate change on hydrological regime and water resources management of the Koshi River Basin, Nepal.J. Hydrol. Reg. Stud.2015,4, 502–515. [CrossRef]
32. Sharma, R.H.; Shakya, N.M. Hydrological changes and its impact on water resources of Bagmati watershed, Nepal.J. Hydrol.2006,327, 315–322. [CrossRef]
33. Babel, M.S.; Bhusal, S.P.; Wahid, S.M.; Agarwal, A. Climate change and water resources in the Bagmati River Basin, Nepal.Theor. Appl. Climatol.2014,115, 639–654. [CrossRef]
34. Dahal, V.; Shakya, N.M.; Bhattarai, R. Estimating the impact of climate change on water availability in Bagmati Basin, Nepal.Environ. Process.2016,3, 1–17. [CrossRef]
35. Neupane, R.P.; White, J.D.; Alexander, S.E. Projected hydrologic changes in monsoon-dominated Himalaya Mountain basins with changing climate and deforestation.J. Hydrol.2015,525, 216–230. [CrossRef] 36. DWIDP.Hydrological Study and Data Collection of Rosi River Catchment; A Technical Report of Department of
Water Induced Disaster Prevention; Government of Nepal and Recham Consulting Pvt Ltd.: Kathmandu, Nepal, 2011.
37. Costa, A.C.; Soares, A. Trends in extreme precipitation indices derived from a daily rainfall database for the South of Portugal.Int. J. Climatol.2009,29, 1956–1975. [CrossRef]
38. Peterson, T.; Folland, C.; Gruza, G.; Hogg, W.; Mokssit, A.; Plummer, N.Report on the Activities of the Working Group on Climate Change Detection and Related Rapporteurs; World Meteorological Organization: Geneva, Switzerland, 2001.
39. Mann, H.B. Nonparametric tests against trend.Econom. J. Econom. Soc.1945,3, 245–259. [CrossRef] 40. Kendall, M.G.Rank Correlation Methods; Oxford University Press: Oxford, UK, 1948.
41. Hamed, K.H. Trend detection in hydrologic data: The Mann–Kendall trend test under the scaling hypothesis. J. Hydrol.2008,349, 350–363. [CrossRef]
42. Sen, P.K. Estimates of the regression coefficient based on Kendall’s tau.J. Am. Stat. Assoc.1968,63, 1379–1389. [CrossRef]
43. Uprety, Y.; Shrestha, U.B.; Rokaya, M.B.; Shrestha, S.; Chaudhary, R.P.; Thakali, A.; Cockfield, G.; Asselin, H. Perceptions of climate change by highland communities in the Nepal Himalaya.Clim. Dev.2017,9, 649–661. [CrossRef]
45. Practical Action.Temporal and Spatial Variability of Climate Change over Nepal (1976–2005); Practical Action Nepal Office: Kathmandu, Nepal, 2009.
46. Merz, J.; Dangol, P.M.; Dhakal, M.P.; Dongol, B.S.; Nakarmi, G.; Weingartner, R. Rainfall-runoff events in a middle mountain catchment of Nepal.J. Hydrol.2006,331, 446–458. [CrossRef]
47. Olsson, O.; Gassmann, M.; Wegerich, K.; Bauer, M. Identification of the effective water availability from streamflows in the Zerafshan river basin, Central Asia.J. Hydrol.2010,390, 190–197. [CrossRef]
48. Liu, J.; Wang, Z.; Gong, T.; Uygen, T. Comparative analysis of hydroclimatic changes in glacier-fed rivers in the Tibet-and Bhutan-Himalayas.Quat. Int.2012,282, 104–112. [CrossRef]
49. Blöschl, G.; Ardoin-Bardin, S.; Bonell, M.; Dorninger, M.; Goodrich, D.; Gutknecht, D.; Matamoros, D.; Merz, B.; Shand, P.; Szolgay, J. At what scales do climate variability and land cover change impact on flooding and low flows?Hydrol. Process. Int. J.2007,21, 1241–1247. [CrossRef]
50. Hao, X.; Chen, Y.; Xu, C.; Li, W. Impacts of climate change and human activities on the surface runoff in the Tarim River Basin over the last fifty years.Water Resour. Manag.2008,22, 1159–1171. [CrossRef]
51. Ghimire, C.P.; Bruijnzeel, L.A.; Lubczynski, M.W.; Bonell, M. Rainfall interception by natural and planted forests in the Middle Mountains of Central Nepal.J. Hydrol.2012,475, 270–280. [CrossRef]
52. Ellison, D.; Futter, N.; Bishop, K. On the forest cover–water yield debate: From demand-to supply-side thinking.Glob. Chang. Biol.2012,18, 806–820. [CrossRef]
53. ICIMOD (International Centre for Integrated Mountain Development). Land cover of Nepal 2010. Available online:http://rds.icimod.org/Home/DataDetail?metadataId=9224(accessed on 3 March 2016).