Tidal predictions in ungauged estuaries
for boat-ramp access windows
A dissertation submitted by
Patrick W McFadden
In fulfilment of the requirements of
ENG4111 and ENG4112 Research Project
Towards the degree of
Bachelor of Spatial Science (Honours) (Surveying)
i
Abstract
Many boat ramps in Central Queensland are only accessible in the upper half of the tidal cycle.
Currently predicting when the ramp is accessible is a mixture of local knowledge and some
educated guesses. Central Queensland, like most areas in Queensland has experienced a huge
growth in recreational boating. This has increased pressure on the boat ramp access and created
demand for greater use of marginal ramps. The ability to optimize the use of availably time at
these ramps may reduce the pressure on more established ramps.
The aim of this study is to predict access times at tide dependant boat-ramps using a novel and
innovative method at three locations in central Queensland. Two models were tested.
At each site sea level was recorded at regular time intervals. This was done once during one of
the larger tides of the month, and again during one of the smaller tides. From each set of data,
the time that the boat-ramp was accessible (access window) and the actual time of the high tide
was derived. A comparison was made between the observed windows and the simultaneously
obtained times and amplitudes of the same tide at a nearby standard port, Mackay Outer
Harbour (MoH). Model 1 used the relationship between the measured access windows at each
site, and the predicted amplitudes at MoH. Model 2, in an attempt to negate some of the
meteorological impacts, used the actual recorded amplitudes at MoH rather than the predicted
as in Model 1. Each model than used the MoH predicted time and amplitude of a tide to predict
access times at each site for that same tide.
This study showed that from a two tide observation at each location and using nearby standard
port tide table, the access times was predicted at two of the three test sites. Model 1 and 2
produced similar predictions. It also showed that access times and lag vary accordingly to the
amplitude of the tide. It also suggests that atmospheric factors can influence the arrival and
departure times of tides.
Currently, to do an accurate prediction of tide levels, a full harmonic analysis of a particular
location is required. This is usually a continuous observation of the tidal cycle for 29 days.
Trends of diminishing Government resources means the communities can’t rely on government
agencies to provide this information for all sites. Using this method many more tide restricted
boat ramps can have an adequate predictor of access times for a fraction of the cost of a full
harmonic analysis.
ii
University of Southern Queensland
Faculty of Health, Engineering and Sciences
ENG4111 & ENG4112 Research Project
Limitations of use
The Council of the University of Southern Queensland, its Faculty of Health, Engineering &
Sciences, and the staff of the University of Southern Queensland, do not accept any
responsibility for the truth, accuracy or completeness of material contained within or associated
with this dissertation.
Persons using all or any part of this material do so at their own risk, and not at the risk of the
Council of the University of Southern Queensland, its Faculty of Health, Engineering &
Sciences or the staff of the University of Southern Queensland.
This dissertation reports an educational exercise and has no purpose or validity beyond this
exercise. The sole purpose of the course pair entitled “Research Project” is to contribute to the
overall education within the student’s chosen degree program. This document, the associated
hardware, software, drawings, and other material set out in the associated appendices should not
iii
University of Southern Queensland
Faculty of Health, Engineering and Sciences
ENG4111/ENG4112 Research Project
Certification of Dissertation
I certify that the ideas, designs and experimental work, results, analyses and conclusions set out
in this dissertation are entirely my own effort, except where otherwise indicated and
acknowledged.
I further certify that the work is original and has not been previously submitted for assessment
in and other course or institution, except where specifically stated.
Patrick McFadden
iv
Acknowledgement
I am heartily thankful to my supervisor, Dr Zhenyu Zhang, whose encouragement and support,
particularly in the initial stages enabled me to produce this dissertation.
I would also like to thank my sister, Dr Sally McFadden, for her limitless patience with guiding
me with the structure and content of this report. I would have been lost without her. My other
sister, Sue Hassall was also invaluable for proofing the spelling and grammar.
Lastly, I would like to thank my brother Paul, for his never-ending emotional support and
encouragement. He suggested that after every low point, a high point follows, just like a tide.
Patrick McFadden
‘Never give in--never, never, never, never, in nothing great or small, large or petty,
never give in except to convictions of honour and good sense. Never yield to force;
never yield to the apparently overwhelming might of the enemy.’
v
Glossary of terms
Earliest Launch Time (ELT) The earliest time for that a boat can be launched
Latest retrieval time (LRT) The latest time that a boat can be retrieved Navigable level (NL) An arbitrary datum that is judged to be the
lowest accessible level for each boat-ramp Height of high tide measured (Ma) The measured maximum amplitude of a
particular high tide.
Height of high tide predicted (M’a) The predicted amplitude of a high tide Time of high tide measured (Ht) The actual time high tide occurs Time of high tide predicted (H’t) The predicted time of high tide
Mackay Outer Harbour (MoH) Standard Port
Predicted launch time (PLT) The predicted earliest launch time on a particular tide
Predicted retrieval time (PLT) The predicted latest retrieval time on a particular tide
Vertical speed The rate of change of a tide vertically over
time.
Maritime Safety Queensland (MSQ) Government agency Access window before high tide measured
(Wb)
The time between the ELT and the Ht Access window after high tide measured
(Wa)
The time Between the Ht and the LRT Access window before high tide predicted
(W’b)
The predicted time between ELT and Ht Access window after high tide measured
(W’a)
The predicted time between Ht and LRT
Lag The time difference between tides at different
locations
Access Window The total time that the ramp can be accessed
vi
Table of Contents
Abstract ... i
Limitations of use ... ii
Certification of Dissertation ... iii
Acknowledgement ... iv
Glossary of terms ... v
Table of Contents ... vi
List of Photographs ... viii
List of Figures ... ix
List of Tables ... xi
List of Appendices ... xiii
Chapter 1: Introduction... 1
1.1. Introduction ... 1
1.2. Objectives and research questions ... 2
1.3. Structure of the dissertation ... 3
1.4. Definition of tides ... 4
1.5. Types of tides ... 4
Chapter 2: Literature Review ... 6
2.1. Factors that influence tides ... 6
2.2. Variations in the range of the tides: tidal inequalities ... 8
2.3. Factors influencing the local heights and times of arrival of the tides ... 11
2.4. Atmospheric and meteorological influences on tides ... 12
2.5. Tidal distortion in estuaries ... 13
2.6. Benefits of tidal prediction ... 14
2.7. Tidal measurement ... 14
2.8. Datum ... 16
2.9. Predicting tides... 17
2.10. The gap in the literature ... 19
2.11. Hypothesis ... 19
vii
Chapter 3: Methodology ... 25
3.1. Design ... 25
3.2. Reducing the impact of meteorological conditions ... 27
3.3. Site selection ... 28
3.4. Datum ... 34
3.5. Equipment ... 37
3.6. Innovative methods ... 37
3.7. Methods ... 39
3.8. Preliminary analysis... 40
3.9. Making a prediction ... 42
3.10. Testing the prediction ... 43
Chapter 4: Results ... 44
4.1. Camila Results ... 44
4.2. Bucasia ... 49
4.3. Murray Creek ... 53
4.4. Predicted launch time (PLT) and predicted retrieval time (PRT) ... 57
4.5. Testing the prediction ... 59
4.6. Summary ... 67
Chapter 5: Discussion ... 69
5.1. Model 1 ... 69
5.2. Model 2 ... 70
5.3. Results at Camila ... 72
5.4. Results at Bucasia ... 72
5.5. Results at Murray Creek ... 72
5.6. Adequate prediction times ... 74
5.7. Time vs height ... 74
5.8. Vertical resolution of site data ... 75
5.9. Vertical resolution of MoH data ... 76
5.10. Data acquisition... 76
5.11. Justification ... 77
5.12. Future work ... 78
Chapter 6: Conclusion ... 79
LIST OF REFERENCES ... 81
viii
Appendix B ... 85
Appendix C ... 94
Appendix D ... 103
List of Photographs
Photo 1-A Stranded boat on a sandbank ... 1Photo 2-A Early tide recording device ... 15
Photo 3-A Camila location ... 28
Photo 3-B Camila Flood tide... 29
Photo 3-C Camila boat-ramp ... 29
Photo 3-D Bucasia location ... 30
Photo 3-E Bucasia boat-ramp... 31
Photo 3-F Bucasia boat-ramp ... 31
Photo 3-G Murray Creek location ... 32
Photo 3-H Murray Creek boat-ramp ... 33
Photo 3-I Murray Creek boat-ramp ... 33
Photo 3-J New tide measuring device ... 38
Photo 3-K Detail of prism setup... 39
Photo 3-L Navigable level pin ... 43
Photo 4-A Camila datum pin... 61
Photo 4-B Camila datum pin ... 61
ix
Photo 4-D Bucasia datum pin ... 64
Photo 4-E Murray Creek datum pin ... 65
[image:10.595.94.524.166.759.2]List of Figures
Figure 1-1 Types of tides ... 5Figure 2-1 Sun and Moon orientations ... 8
Figure 2-2 Earth and Moon orbits ... 9
Figure 2-3 Distribution of tidal phases ... 10
Figure 2-4 Astronomical cycles ... 12
Figure 2-5 Tidal planes ... 17
Figure 3-1 Bucasia sea levels 25th March ... 26
Figure 3-2 Tidal datums 2016 ... 34
Figure 3-3 Semisiurnal tidal planes ... 35
Figure 3-4 Camila sea level 24th May ... 41
Figure 4-1 Camila sea level 23rd March ... 44
Figure 4-2 Camila sea level 24th May ... 45
Figure 4-3 MoH sea level 23rd March ... 46
Figure 4-4 Enlargement A ... 46
Figure 4-5 MoH sea levels 24th May ... 47
Figure 4-6 Enlargement B ... 47
x
Figure 4-8 Bucasia sea levels 23rd May ... 50
Figure 4-9 MoH sea level 25th March ... 51
Figure 4-10 MoH sea level enlargement C ... 51
Figure 4-11 MoH sea levels 23rd May ... 52
Figure 4-12 Enlargement D ... 52
Figure 4-13 Murray Creek sea level 24th March ... 54
Figure 4-14 Murray Creek sea level 25th May ... 54
Figure 4-15 MoH sea levels 24th March ... 55
Figure 4-16 Enlargement B ... 55
Figure 4-17 MoH sea level 25th May ... 56
Figure 4-18 Enlargement F ... 56
xi
List of Tables
Table 2-I Model 1 formulae ... 21
Table 2-II Measured variables ... 22
Table 2-III Predicted variables ... 22
Table 2-IV Derived variables ... 22
Table 2-V Mackay real time sea levels ... 23
Table 2-VI Model 2 formulae ... 24
Table 3-I Design elements ... 25
Table 3-II equipment list ... 37
Table 3-III Project time-line... 39
Table 3-IV Example of data download ... 40
Table 3-V Model 1 ... 42
Table 3-VI Model 2 ratio ... 42
Table 4-I Camila measured variables ... 48
Table 4-II Session 1 and 2 summary ... 48
Table 4-III Summary of Bucasia variables ... 53
Table 4-IV Bucasia session 1 and 2 ... 53
Table 4-V Summary of Murray Creek measurements ... 57
Table 4-VI Murray Creek session 1 and 2 ... 57
Table 4-VII MoH tide times and heights ... 58
Table 4-VIII Camila model 1 predictions ... 58
xii
Table 4-X Camila model 2 predictions ... 59
Table 4-XI Camila model 1 result ... 60
Table 4-XII Camila model 2 results ... 60
Table 4-XIII Bucasia model 1 results ... 62
Table 4-XIV Bucasia model 2 results ... 63
Table 4-XV Murray Creek model 1 results ... 64
Table 4-XVI Murray Creek model 2 results ... 65
Table 4-XVII Summary of variables - all sites ... 67
Table 4-XVIII Summary model 1 results ... 68
Table 4-XIX Summary model 2 results ... 68
Table 5-I Model 1 ... 70
Table 5-II Example MoH actual sea level data ... 70
Table 5-III Model 2 ... 71
xiii
List of Appendices
Appendix A Project Specification……….84
Appendix B Site session 1 and 2 data………..…….85
Appendix C Mackay outer harbour session 1 sea levels……….94
1
Chapter 1: Introduction
1.1. Introduction
The idea for this project came from a trip to Stanage Bay in central Queensland. The boat-ramp
is a tide dependant ramp meaning that it is only accessible during the upper part of the tide.
Currently predicting when the ramp is accessible is a mixture of local knowledge and some
educated guesses. In this case, local information said it was accessible two hours either side of
high tide and to add 30 minutes to Mackay Outer Harbour tides. An early start resulted in a
successful launch, but others in our group slept in and were able to launch much later in the
morning. It was obvious that the local knowledge was not quite right and access times depended
on more than one variable. In fact during a neap tide the ramp was accessible for a much longer
period of time.
Queensland has experience a huge growth in recreational boating. This has increased pressure
on the boat ramp access and created demand for greater use of marginal ramps (Boon et al.
2011). The ability to optimize the use of availably time at these marginal ramps may reduce the
pressure on more established ramps.
Having the knowledge of what times a particular boat-ramp is accessible can be valuable.
Stakeholders who could benefit from more precise predictions include professional fishers,
recreational fishers, tourism operators and Government agencies like police, search and rescue.
2
Knowing that on a particular date in the future you will be able to launch your boat at 8:00 am
and will need to retrieve it before 4:00 pm is of great benefit. Turning up at a ramp and having
to wait for the tide is inconvenient but returning from a day on the water to find the boat-ramp
high and dry can lead to a long wait for the next tide. Tourist operators could plan excursions
with a secure knowledge of when to return to the ramp. Safety and sustainability goals can be
improved for government and private agencies.
Currently, to do an accurate prediction of tide levels, a full harmonic analysis of a particular
location is required. To obtain most of the tidal constituents and hence maximum accuracy, the
tides needs to be observed for a full cycle of 18.6 years (National Ocean and Atmospheric
Administration 2015a). This is the case at standard ports in Queensland (Maritime Safety
Queensland 2014). A shorter observation period of one lunar month, 29 days, is common
practice to obtain the most significant constituents.
At standard ports in Queensland this analysis has been done and tide predictions are readily
available in tide charts. From tide charts, times and height of high and low are easily extracted.
Also times that the tide passes an elevation can be derived from tidal curve tables (Maritime
Safety Queensland 2016a).
At other ports called secondary ports, information can be obtained that makes it possible to
predict the amplitude and time difference of high and low water. A table of time differences
between high and low water as well as a ratio and constant, are applied to the amplitude which
converts the standard tide information to equivalent secondary port data (Maritime Safety
Queensland 2015a). The locations in this study are neither primary nor secondary ports.
Many of Queensland’s boat-ramps are located in tide dependant estuarine locations which
makes predicting access times for a boat difficult. The shape of the tidal curve gets distorted as
it enters shallow water (Zetler & Cummings 1967). This asymmetric shape means that the
access window may not be equally distributed around the time of high tide.
1.2. Objectives and research questions
The aim of this study is to predict times at which a boat can be launched and retrieved at three
specific locations using a new and innovative method. This time period referred to is the access
window. This access window is the usable time that a tide dependant boat-ramp can be used on
3
In this study it is not the absolute height and time of the high or low tide that is required, but
moreover the time between when the sea level passes a set elevation at a known location. This
elevation or lowest navigable level (NL) is usually the bottom of the boat ramp, and can be
different for each location.
1.3. Structure of the dissertation
A basic summary of tides including definitions and types of tides follows in this chapter. Chapter 2 investigates the literature about tides and tidal predictions. This research is limited
predicting the times that a tide passes a specific elevation at each location. This being the case
some complexities can be removed to find an adequate solution. Tidal movements are also
influenced by meteorological factors (Dronkers 1975). This will be covered more in chapter 2
and again in chapter 3. A method is discussed and tested to try to reduce the influence of some
of the meteorological factors. This leads to a proposed model to predict access times at specific
locations.
In chapter 3 an empirical method is developed and relies on the inherent repeatability of the
tidal phenomenon and used a linear relationship between the observed windows, and the
amplitudes at the nearby standard port. At each site, tide levels and times were logged at regular
intervals as the tide approached, covered, peaked and retreated passed the lowest navigable
level. This was done once during a larger tide, and again during a smaller size tide. At each site
the earliest launch time (ELT), the latest retrieval time (LRT) and the time of high tide (Ht) was
measured.
A comparison was made between the observed access times (windows) and the simultaneously
obtained times and amplitudes of the tide at a nearby standard port. Using predicted times at the
standard port, and the comparisons with the two sets of test data, a prediction was made for
access times at each site.
A datum mark was placed at the navigable level and the time the water arrived and departed
recorded. This was compared with the predicted times. In chapter 4 the results from two models
of predicted launch and retrieval times where reviewed. The differences and possible reasons
are discussed in Chapter 5. The dissertation finalises in chapter 6 with a conclusion that looks at
4
1.4. Definition of tides
The movement of tides are due to fundamentally two forces. The first being gravitational forces
of the Sun, Moon and Earth. The second is the centrifugal force of the Earth’s rotation around
centroid of the Earth’s and Moon’s gravitational field. Tides also occur in a much smaller
degree are in large lakes, the atmosphere and the Earth crusts (Earth tides) (National Ocean and
Atmospheric Administration 2015b).
Tides start in the oceans of the world and move towards the coastline where they can be
observed as the regular rise and fall of the sea level. The high tide is when the highest part of
the wave passes a particular location and the low tide when the trough passes. The difference
between these is called the tidal range (National Ocean and Atmospheric Administration
2015b).
The rise and fall of the sea level causes a horizontal movement of water, called the tidal current.
An incoming tide in a bay or estuary is called a flood tide and the outgoing an ebb tide.
Tides are a form of large wave that move around the globe. The high tides are when the crest
passes a point and similarly a low tide is when the trough passes a point. These waves interact
with each other to create great variety around the Earth. Usually to be able to predict a natural
event like tides we must have a fundamental understanding to the factors that influence it.
While the basic laws of fluid dynamic and geophysics are well understood there is a huge
amount of unknowns caused by terrestrial factors (Hicks 2006).
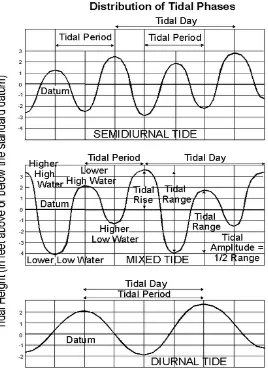
1.5. Types of tides
Tides can be divided into 3 types, semidiurnal, diurnal and mixed tides. This is based on the
number of high and low tides and their relative amplitude each tidal day (25 hours).
Semidiurnal have two highs and two lows each day. Diurnal tides have only one low and one
high per day. This comes from the position of the Moon relative to the equator. When the Moon
is over the equator the Earth has two equal tidal bulges per day. Semi-diurnal tides have a wave
length of 12 hours 25 min. Most areas not on the equator have two unequal bulges per day. This
is called a mixed tide. In the area far from the equator, the Earth only get one high and one low
per day. These diurnal tides have a period of 24 hrs and 50 min (National Ocean and
Atmospheric Administration 2015b). There are exceptions to the rule in places like the Gulf of
5
Tides are made up of both semi-diurnal and diurnal components. The division between the two
types is arbitrary. In the special Publication No 9 - Australian Tides Manual (SP9) they use the
ratio of (K1+O1)/ (M2+S2) is less than 0.5 the tide is semi-diurnal (two highs and two lows in
one day) (Permanent committee on tides and mean sea level (PCTMSL) 2014).
(Ocean motion and surface currents 2015)
6
Chapter 2: Literature Review
2.1. Factors that influence tides
2.1.1. Astronomical motions
The world oceans are held in place by the gravitation force of the Earth. This is an equipotential
surface. In addition the gravitational forces of the Sun and the Moon influence the surface. This
tractive force is the cause of tidal motion (National Ocean and Atmospheric Administration
(NOAA) 2013). The Earth’s waters are “bulged” by these external forces and resulting
horizontal flow towards areas of maximum gravitational attraction produces a high tide. On the
opposite side to this bulge is a corresponding “lag”. The low tide is the result of the evacuation
of this flow and is located half way between these two peaks. The daily rotation of the Earth,
(diurnal) causes movement of these two tidal humps and two tidal depressions. This is what is
known as high and low tide (National Ocean and Atmospheric Administration (NOAA) 2013).
The forces that influence the tide at the tides at the Earth’s surface are a combination of the
gravitational forces of the Moon and Sun and the centrifugal forces of the Earth-Moon system (
and Earth-Sun) rotating around each barycentre. These rotations, while the systems remain in
complete balance, the forces are not equal on all points of the Earth’s surface and tides are the
result (National Ocean and Atmospheric Administration (NOAA) 2013).
2.1.2. The effect of centrifugal force
The Earth and the Moon are locked in a rotating relationship around the centre-of-mass of the
Earth-Moon system (G). This centre G, this lies on a line between the two centres of gravity of
each and some 1719 km below the surface of the Earth. The centrifugal force component from
this rotation is what is needed for the production of tides. The same system applies to the
relationship between the Sun and the Earth (National Ocean and Atmospheric Administration
(NOAA) 2013).
The direction of the centrifugal force is always away from the location of the centre-of-mass G.
It is important to note the difference between the centrifugal force caused by this “dance”
between the Earth and the Moon, is completely separate to the centrifugal force caused by the
Earth own rotation around its axis. This rotation has no influence on tides because for
centrifugal force is equal at all points around the centre of mass of the Earth because the
distance from the centre of mass is the same (equipotential surface) (National Ocean and
7 2.1.3. The effect of gravitational force
Newton’s Universal Law of Gravity states that gravitational force varies inversely as the second
power of the distance from the attracting body. This means that if the distance between different
gravitation bodies varies, so does the magnitude of the force that it exerts. In tide theory the
movement of Sun and Moon cause variations to the gravitation forces on the Earth surface and
this variation moves around the globe (McCully 2006).
2.1.4. The net or differential tide-raising forces: direct and opposite tides
It has to be understood that the centrifugal force described above is equal to the gravitational
force at the centre of mass of the Earth. This is because the system is in equilibrium. This means
that at the centre of the Earth the net tide forces add to zero (National Ocean and Atmospheric
Administration (NOAA) 2013).
At a point on the Earth’s surface closest to the Moon, the gravitational force now out-weights
the centrifugal force. This is because the centrifugal force remains the same but the distance
between the Earth and Moon is now shorter, so the gravitational force is larger. The resultant
disturbance of the sea level at this point is known as the direct tide.
Another point on the Earth’s surface furthest from the Moon will again have the same
centrifugal force but because the distance is greater the gravitational force is now less. This
means the resultant net tide producing force is directed away from the Moon. This point,
coincidentally with the direct tide, is called the opposite tide (National Ocean and Atmospheric
Administration (NOAA) 2013).
2.1.5. The tractive force
It has to be noted at this point that the gravitational force of the Moon is far less that Earth’s
own gravitational force. The Moons force is only about one nine millionth as strong as the
Earths. The gravitational force can be divided into two components, one is vertical the other
tangential to the surface. This tangential or horizontal force acts to move particles of water
around the surface of the Earth towards the sub-lunar and antipodal points (points closest and
furthest from the Moon). This drawing of water is known as the tractive component and is what
produces the tides. The movement of water tends to gather and remain stable at that location,
called the tidal “bulge”.
Any water accumulated in these locations by tractive flow from other points on the Earth's
8
degrees to these water is drained away leaving a tidal depression (National Ocean and
Atmospheric Administration (NOAA) 2013).
2.1.6. The tidal force envelope
In a simplified model if the Earth was covered in uniform depth ocean, with no continents the
tidal envelop of the Moon would result in a high tide followed 6 hours later by a low, then a
second high after 12 hours and so on. This would be caused by the rotation of the Moon and the
precession of the two tidal bulges and depressions. This is far from the actual case. First we
have to identical setup from the Earth-Sun relationship. Although the distance between the two
objects is much larger so is the mass of the Sun. This equals a net effect in the order of 2.5
times less than the Moon’s. Now let’s add the influences of land masses, ocean currents, and
other retarding factors as well as the astronomical variables in the orbits of the Moon, Sun and
Earth. All these factors are superimposed onto the Earth’s tidal envelope.
2.2. Variations in the range of the tides: tidal inequalities
2.2.1. Lunar phase effect
The effects of the Moon and the Sun will vary as the relationship between them change. When
the Sun and Moon are aligned, called the new Moon both act together to produce larger than
average tides and lower than average low tides. These larger tidal ranges are called spring tides.
9
This also exists when the Sun and Moon are aligned but on opposite side to each other, as in the
full Moon.
At the 1st and 3rd quarters of the Moon, the Sun and Moon are at 90 degrees to each other. These
are the neap tides, where the tidal range is at minimum (Hicks 2006).
2.2.2. Parallax effects (Moon and Sun)
The distance between the Earth and the Moon will change during its monthly orbit. When the
Moon is closest (perigee) to the Earth the gravitational forces are greater (Newton’s Law of
Gravitation) and hence producing higher than average tides. Two weeks later, when the Moon is
furthest from the Earth (at apogee) the tides are less. This is also apparent in the Earth –Sun
orbit with the Earth being closest at perihelion on 2nd January and furthest during aphelion on
2nd July each year (National Ocean and Atmospheric Administration (NOAA) 2013).
2.2.3. Lunar declination effects: the diurnal inequality
Due to the fact that the Moon’s orbit is inclined to the plane of the Earth’s own orbit, the Moon
passes twice each month over the equator. This is not dissimilar to the Sun’s movement about
the equator, causing the seasons. When the Moon passes over the equator the two high and low
[image:23.595.79.513.339.617.2]tides are at same at the same height and duration at a specific location. This is a semidiurnal
10
tide. As the Moon moves away from the equator a difference between the two tides emerges.
The phenomenon is known as the diurnal inequality.
When a point on the Earth’s surface lies beneath the tidal envelope and 12 hours later lies
beneath a significantly smaller envelope, this results in a successive high and low tides of
unequal height. This tide is called a mixed tide. Lastly, a diurnal tide is when the point is
beneath the tidal envelope and 12 hours later lies above the envelope, then tidal forces produce
[image:24.595.148.416.238.622.2]only one high tide and one low tide a day
11
2.3. Factors influencing the local heights and times of arrival of the
tides
From the previous section it was shown successive tides can have difference ranges. From
observations of tides at specific locations also shows a variation in the arrival time. These
variations are the result of many factors, some of which are the harmonic motions and
oscillations of the Earth and Moon. There are two principle astronomical effects that cause
variation in arrival time of tides.
The Earth rotates around it axis every solar day or 24 hours. The Moon also rotates around the
Earth at a slower rate, 12.2 degrees per day and in the same direction. So for the tidal force
applied to the tidal envelope to “line up” again over up a particular location takes longer than 1
day. In fact it is about 360 degrees plus the 12.2 degrees. This phenomenon is the lunar
retardation. If this single astronomical influence is considered equates to about 24 hours 50
mins between successive sub-lunar tides (the point when the tide-raising influence is highest).
This is why the tidal day is 24 hours and 50 minutes.
The idea that the maximum forces, hence the arrival of the tide as the Moon passes over that
meridian is not always the case. Priming of the tide is the result of the alignment of the Sun and
the Moon. Between the new Moon and the first quarter of the cycle and again between the full
Moon and the third quarter the tidal forces can accelerate the arrival of the tide, before the
Moon passes over that meridian. The reverse is the case during second and fourth quarters of
the Moon’s path, known as lagging of the tide.
In addition to these two astronomical phenomenon, tides have many other forces to deal with.
These include bathymetric complications (sea floor restrictions, friction, shape), hydraulic and
hydrodynamic factors. Overlaying these are meteorological conditions, significant in their own
12
2.4. Atmospheric and meteorological influences on tides
The weather can have a significant influence on sea levels. Factors like barometric pressure,
wind speed, duration and direction can cause distortions from predicted tides. During a period
of high pressure, the sea is depressed and lower than predicted, and conversely during periods
of low pressure the sea level is elevated. Tidal predictions are made with an average value of
barometric pressure. This means that variations to the actual barometric pressure will cause
differences in the observed sea level. A change of about 10 hectopascals (hPa) from the value
used in the prediction can change sea level by 0.1m. This is called the inverted barometric
effect. These effects rarely exceed 0.3m but because changes in barometric pressure are related
to wind speed and direction the result can be compounded (Bureau of Meteorology 2016).
Severe changes in barometric weather can cause changes in sea level of 30 cm (McCully 2006)
.
Wind can influence sea levels when it pushes oceans into landmasses. In deep oceans wind has
negligible influence, but in the shallower seas restricted by landmasses, the wind can cause a
gradient on the ocean (McCully 2006). Wind blowing onshore will cause the sea level to pile
up, raising the level of the ocean to above the predicted level. This is labelled the wind setup.
The same is true for the opposite direction with sea level less than predicted. Longitudinal wind,
[image:26.595.110.459.101.364.2]along the coast, can increase the tidal range. These influences are variable and very reliant on
13
local topography (Bureau of Meteorology 2016).Together these terrestrial influences of wind,
runoff into rivers and barometric pressure can cause differences between predicted to observed
tidal level (Hicks 2006) .
Some other terrestrial factors are.
1. The depth variations of the oceans
2. Shallow sections the deform the tidal wave
3. Land masses
4. Friction factors of the sea floor
5. Water viscosity
6. Turbulence
(Hicks 2006)
2.5. Tidal distortion in estuaries
As tide move into an estuary a complex set of interactions occurs. When the progressive wave
enters an estuary and hits a barrier, the harmonics of each wave can reflect off each other to
form a standing wave. Bottom friction complicates this, as the tide is attenuated. This damping
effect on the inward and outward reflection results in a complex wave that has some progressive
component. The change of the tidal form as its hits shallow water makes tide prediction more
difficult (Zetler & Cummings 1967). Depending on the shape of the estuary and the location of
the standing wave nodes, the tide can be greatly increased or dampened (Hicks 2006). An
example is in the Minas Basin where the tide is amplified in the gulf of Maine and again as it
passes into the Bay of Fundy resulting in the one of the highest tides in the world (15.4 m
range).
Another example of wave attenuation is a wave rebounding from the head of the estuary. This
additional tidal surge can cause net wave increase or decrease (Quinn et al. 2012). The
bathymetry of the sea floor also has a huge influence. Studies have shown that the friction
factor is significant controller of wave properties. This causes lags in the periods of waves
(Tang & Grimshaw 2003).
Tidal asymmetry can be defined as variations in the period and amplitude of the incoming
(flood) tide and the outgoing (ebb) tide. In a flood dominated system, the incoming wave has a
shorter period and higher current magnitudes. This is typical in a restricted or ‘choked’ estuary
(MacMahan et al. 2014). In an ebb dominated system the outgoing tide has the higher velocity
14
In the UK, the National Tidal and Sea Level Facility attempted to overcome the inherent
problems with predicting high water events with an empirical approach to improving tidal
predictions using recent real-time tide gauge data. The Empirical Correction Method was shown
to reduce prediction errors by up to 10 cm (Hibbert et al. 2015).
A 2d hydrodynamic study of the Solant-Southampton estuarine system used the MIKE-21
software and data from tide gauges was able to predict tidal surges up to an accuracy of 0.09m
(Quinn et al. 2012).
2.6. Benefits of tidal prediction
Knowledge of tidal movement and more importantly being able to predict it has always been
vital for coastal peoples around the world. Navigation into ports, particularly with sailing ships,
had to take into account not only depths but strength and direction of currents. This is still
important today with ships becoming larger all the time and little margin for error. The
determination of a Lowest Astronomic Tide (LAT) is used on hydrological charts. Real time
sea level measurements are used in many major ports to provide safety and efficiency (National
Ocean and Atmospheric Administration 2015b).
Professional fishermen rely on knowledge of tides for improving their catch. Even recreational
users, surfers, fishers and beach walkers all need information about tides.
Engineering works associated with the coast zone, like construction of bridges, wharfs,
walk-ways and boat-ramps all require tidal knowledge.
Establishment of legal boundaries often have definitions relating to tides. Highest Astronomical
Tide (HAT) is commonly used.
Scientists are also concerned with tides, sea level changes, currents and a mirage of other
related phenomenon. The Mean Sea level (MSL) is used in geodesy and datum establishment.
2.7. Tidal measurement
2.7.1. History
Historically a tide was measured with the tide pole or stick. This was replaced by more
automated mechanical systems involving a float in a tube connected to a pen and ink strip. This
15
cm pipe with the float suspended inside. This float was connected to the recording device
(National Ocean and Atmospheric Administration 2015b).
Time line of tide measuring techniques
1831 – Henry R Palmer. A float in a well is connected to a recording device using
wheels and shafts. The pencil creates a line as a function of tide and time.
1834 – In Le Havre, France a self-recording tide gauge built.
1846 – United States and India.
1858 – Australia.
1870 – 15 tide gauges on the shores of Europe.
1883 – The first determination of mean sea level around Europe 67 tide gauges.
(Matthäus 1972)
This is a mechanical “punch” recorder that was brought into service when computers first
became available for analysing tidal patterns (National Ocean and Atmospheric Administration
2015b). Later in the 1960s it was replaced by a punched paper tape that could be feed into early
computers (National Ocean and Atmospheric Administration 2015b).
2.7.2. Current methods
The latest measuring method uses advanced electronic and an acoustic signal that is transmitted
though the water column. The time it takes to return is recorded and water depth calculated.
This is now an automated process and the data is stored and transmitted. Other data like wind
speed, current, air and water temperature and atmospheric pressure can be recorded. In the
16
United States this data can be accessed remotely through the Geostationary Operational
Environment Satellites (GOES) (National Ocean and Atmospheric Administration 2015b). The
main types of water level sensors in use in standard ports in Australia are the microwave
(radar), acoustic and pressure sensors. Also used, but less common are laser ranging and ADCP
current meters. Radar units have not direct contact with the water so are easy to maintain. They
send a microwave signal down to water surface and measure’s its return. Acoustic sensors send
a pulse down an environmental tube. Pressure sensors are lowered to sea floor and measure
depth of water above. They have to be calibrated to a datum and to air pressure (Permanent
committee on tides and mean sea level (PCTMSL) 2014).
2.8. Datum
Tidal measurements are connected to bench marks located on an adjacent stable location. A
tidal datum is defined, and used for hydrographical maps. In Australia it is the lowest
astronomical tide (LAT) (Maritime Safety Queensland 2014).
The tidal epoch is the time over which continuous observations are made to establish a tidal
datum or plane. In Australia we have adopted the 20-year tidal datum epoch 1992 to 2011
(inclusive) (Maritime Safety Queensland 2012). It is intended to keep these values fixed until
the tidal datum epoch review in 2018. In Australia the tide height is in decimal meters above the
17 (Maritime Safety Queensland 2014)
Observations are made to establish a datum point over a period of time. This is normally longer
than 18.6 years so as to include full lunar cycle. The original Australia Height Datum, AHD
was created in 1971 by connecting bench marks based on mean sea observations from only a
two year period. (This is one of the reasons that AHD is not a true equipotential surface and has
errors in it.)
2.9. Predicting tides
2.9.1. Tidal harmonic method
Newton is considered the founder of tidal theory. Laplace (1799) worked on tide theory in
France and Whenwell (1833) in England. These methods were improved by English
mathematician, Sir George Darwin. In particular was the focus on the study of the forces that
caused tides. Early tide prediction used the lunitidal interval method. This measured the time
interval of the transit of the Moon over the local meridian to the first high tide. By the 1870’s
the harmonic method was introduced. In the United States the Maxima and Minima Tide
Predictor of William Ferrel summed 19 constituents in 1885. Rollin A. Harris and E. G. Fischer
summed 37 constituents and was used from 1912 through 1965 (National Ocean and
Atmospheric Administration 2015a). This involved a tedious calculation involving cosine curve
additions. A series of mechanical machines were developed to add this calculation. In 1921
‘The harmonic development of the tide-generating potential’ by AT Doodson (1921) is seen as
a benchmark work at harmonic analysis. Doodson expanded on George Darwin’s work using a
purely harmonic method and added constituents ignored by Darwin (Doodson 1921; Matthäus
1972; Foreman 1977; Hicks 2006; National Ocean and Atmospheric Administration 2015b).
The many great works of J.J. Dronkers of the hydraulic department, Netherlands, are considered
fundamental to tide prediction calculations. Dronkers developed mathematical methods of
computing the constituents of the harmonic method. This was during the development of the
computer so previously cumbersome hand calculations of matrices were often required. With
the aid of computers these calculations greatly simplified and more complex solutions
developed (Dronkers 1975).
In the deep oceans, tides may be predicted with 60 tidal constituents for 12 months predictions,
(Doodson 1921). In shallow seas, tide are distorted by friction factors so additional higher
18
frequency constituents are needed. Extended Harmonic Method (EHM) uses 114 constituents to
achieve 1 year of predictions (Hibbert et al. 2015).
The harmonic method is used to this day for tide prediction. With the benefit of ever more
powerful computers, more constituents can be extracted from the observed data.
When the tide height is plotted against time, a simple looking cosine curve is apparent. This
curve is actually the result of many small curves and takes into account all effects including,
currents, hydrological effects and meteorological factors.
Due to the many unknown variables that influence tides, the knowledge of the position and
movement of the Sun and Moon is not sufficient to predict tides. This is why the empirical
approach of taking many continuous measurements at a particular location is used.
Standard analysis involves the derivation of 37 constituents. The period of the regression of the
Moons nose is about 18.6 years and results in very slowly variations in the tidal cycle. This
means that a full harmonic analysis needs about 19 years of data to extract all of the individual
curves that make up the tide. Generally while 19 years is desirable, lesser time periods of 1 year
can extract most of the significant constituents and even I month in semidiurnal dominated
tides. (Hicks 2006; Maritime Safety Queensland 2012; National Ocean and Atmospheric
Administration (NOAA) 2013).
To predict the tide at a particular location it is a simple process of measuring the tide for a
period of time, extracting the tidal harmonics and adding the extracted cosine curves to get the
predicted curve.
While all these processors may not be fully understood, the tide phenomenon is reflected in that
the Earth is a consistent responder to these tide generating forces (National Ocean and
Atmospheric Administration 2015a). What this means is, if we ignore the meteorological
factors, the tide will repeat its behaviour at a specific location and a period of time.
2.9.2. Empirical Correction method
The Harmonic method High water (HW) or empirical Correction method used some recent HW
observations to self-correct predicted HW levels. Deals with HW only and interested in flood
forecasting. Does not apply to whole tidal curve just HW. Ignores the lag or time difference in
19 2.9.3. Species Concordance technique
The Species Concordance technique uses long records at a reference location that does not have
any distortion to predict short term surges. An extension of the Response Method and used to
reduce distortions from shallow water and flood flows.
2.9.4. Artificial Neural Network (ANN)
In more current times the process of harmonic analysis refined by using an Artificial Neural
Network (ANN) model for forecasting the tidal-levels using the limited measured data (Lee &
Jeng 2002; Makarynskyy et al. 2004; Karimi et al. 2013; Meena & Agrawal 2015). ANN
models use a series of data sets to first train a network and then validate it. The model uses a
training data set and tries to adjust itself by iteration to minimize the error by comparing itself
the authentication data set. ANN allows whole of tidal curve prediction (Hibbert et al. 2015).
2.10. The gap in the literature
This literature review presents information that shows how gravity and centrifugal force are the
basic drivers of tides. Tides are then made more complex by the motions and interactions of
these celestial bodies. As tides approach land, they are again modified. In addition to this
meteorological influences impact on sea level and are hard to predict. It was shown that tides
can be measured, and if over a long enough time, the underlying constituent curves extracted
and predictions made. These predictions are used mostly to find the highest or lowest point of
the tide and the time to do this prediction means continual observation at each site for a period
of time.
What this review does not show is how much data is required to just work out the interaction
between a known elevation (boat-ramp) and the tide at a specific site. We don’t need all the
information about the tide, just its “footprint duration” over a known location.
2.11. Hypothesis
From the literature it can be stated that
At any particular site the tidal pattern will be repeatable.
20
The time between the arrival of a tide and high tide may not always equal to the time from high tide to the departure of the tide. This is due to asymmetrical nature of the
tidal curve in constricted estuaries.
Atmospherics influence tide height and hence tide arrival times and are hard to predict. In this paper the following hypothesis will be investigated
That different tidal amplitudes impact on access time duration (windows).
Adequate access time predictions at specific locations can be made using the relationship between the simultaneous measured amplitudes at a nearby standard port
and the sites corresponding access times.
2.12. A model for predicting access times
2.12.1. Model 1
The basic assumption for this model is that tides are the result of a combination of forces that
result in variations in sea level (ref). This includes the gravitational, centrifugal forces and local
bathymetric conditions. These forces, while ever changing, are repeatable. This means for each
site, with the local bathymetric conditions being constant, a tide should react the same way as
any other tide under the same forces. Draped over these forces are meteorological influences. It
has been shown that prolonged wind, barometric pressure, salinity and flood waters can
influence sea level (Bureau of Meteorology 2016).
The earliest time that a boat can be launched at a particular boat ramp (ELT) and the latest
retrieval time (LRT) can also be recorded for a particular site and tide. The total access time for
that ramp is LRT – ELT.
As tides move into shallow water the tidal form can be distorted (Friedrichs & Aubrey 1988).
This means the shape of the tide is no longer symmetrical, like it would be in the open ocean.
The level of the distortion or asymmetry depends on the local bathymetry and the amplitude of
the tide. For this reason the access window has been divided into two parts. At each location,
Wb is the access time from ELT to the time of high tide (Ht) and Wa is the time between Ht
through to LRT. The total access window for each site is Wb + Wa.
To predict access times we need more than the access window, the prediction needs to be in real
time that is 8.00 am to 3.00 pm for example. The time difference between a high tide in Mackay
21
The predicted launch time (PLT) at a specific location is equal to the time of the standard ports
high tide plus/minus the lag, minus access window before high tide.
PLT = M΄t₃ + Lag - W΄b
It also follows that the predicted retrieval time (PRT) is equal to the time of the standard ports
high tide plus/minus the lag, plus access window after high tide.
PRT = M΄t₃ + Lag + W΄a
This means that by measuring a repeatable phenomenon at a specific location, once during a
large tide and again during a small tide, and using simultaneous observations at a nearby
standard port, a prediction can be made at each of the measured sites using the its relationship to
the standard ports tidal amplitude.
The last point means that if for example, a 5m amplitude tide at Standard port equates to an 8
hour window, and a 4m tide at the same Standard port equates to a 7 hour window, then a 4.5 m
tide will be mid-way between the two, equating to 7.5 hours long. This proportional
relationship will be applied to the time periods of Wb and Wa, and the lag.
At each test site we can measure the ELT, LRT and time of actual high tide (Ht) twice. Once
during a large Mackay tide, and again during a smaller Mackay tide. The predicted tide will
hopefully lie somewhere in between. This means we get the measured data for session 1 and 2
and make a prediction for session 3.
The ratio R is a linear factor based where the amplitude of the predicted tide for session 3 in
relation to the session 1 and 2 amplitudes. If the predicted high tide was 4.5 m and the range of
tides observed at the site was between 4 m and 5 m than the ratio is
R = (4.5-4) / (5-4) = 0.5/1 = 0.5
In conclusion, if the access windows are measured at a site for two sessions, we can calculate a
future window based on its corresponding amplitudes at a nearby standard port.
Table 2-I Model 1 formulae
22
W΄a = (Ht₁-LRT₁)-(Ht₂-LRT₂)*R+(Ht₂-LRT₂)
With Lag = ((Ht₁-M΄t₁)-(Ht₂-M΄t₂))*R+(Ht₂-M΄t₂) Ratio R = (M΄a₃-M’a₂)/(M’a₁-M’a₂)
Table 2-II Measured variables
Measured Variables Description
ELTₑ The actual measured earliest launch time at each site for session ₑ LRTₑ The actual measured Latest Retrieval Time at each site for session ₑ Htₑ The actual measured time of high tide at each site for session ₑ
Maₑ The actual amplitude of high tide at Mackay Outer Harbour for session ₑ
Mtₑ The actual time of high tide at Mackay Outer Harbour for session ₑ
Table 2-III Predicted variables
Predicted Variables
M΄tₑ The predicted time of high tide at Mackay Outer Harbour for session ₑ
M΄aₑ The predicted amplitude of high tide at Mackay Outer Harbour for session ₑ
Table 2-IV Derived variables
Derived Variables
PLT is the Predicted Launch Time at a specific tertiary port for a given day
PRT is the Predicted Retrieval Time at a specific tertiary port for a given day
W΄a Is the predicted access time after high tide at the tertiary port
W΄b Is the predicted access time before high tide at the tertiary port
Lag is the measured time difference between high tides at the Standard port
23
Ratio R The ration between the test day predicted MOH amplitude, and the range
of amplitudes measured at each site.
The subscript ₑ refers to the session that the data come from. Session 1 and 2 are the two data
gathering sessions, session 3 is the test session.
2.12.2. Model 2
Model 1 above used the predicted amplitudes of the nearby standard port’s amplitude to
determine the ratio factor R. It has been shown in Section 2.6 above that meteorological factors
can influence sea level. Some factors like prolonged wind and barometric pressure can be seen
as regional rather than local. If the test sites for this paper are located in the same area than it is
assumed that the same region’s forces impact simultaneously at the standard port and at each
site.
As mentioned in the section 2.6 above, meteorological influence impact of sea level. Model 2
attempts to negate some of these influences in the two data sets from each site. Model 1 used a
relationship between the windows at each site and the predicted amplitudes at Mackay for the
same tide. Those predicted amplitudes were surmised to be the underlying force behind the
resultant window at each site. If the actual measured amplitudes at the standard port were used
instead of the predicted, then this may negate some of the regional meteorological factors. The
meteorological forces that deflected the sea level at the standard port could be assumed to be of
the same magnitude as at the nearby test location. For example a predicted tide at Mackay could
be 5 m but the actual measure same tide was 5.1 m meaning that the access window should be
related to the larger tide. This data is available from The Queensland Government at
https://data.qld.gov.au/dataset/coastal-data-system-near-real-time-storm-tide-data/resource/7afe7233-fae0-4024-bc98-3a72f05675bd
Example of real time data at Mackay on the 24th March 2016
Table 2-V Mackay real time sea levels
Date / Time Actual Predicted Residual
2016-03-24T10:40 5.098 5.202 -0.104
2016-03-24T10:50 5.149 5.264 -0.115
2016-03-24T11:00 5.195 5.308 -0.113
24
2016-03-24T11:20 5.236 5.34 -0.104
2016-03-24T11:30 5.23 5.326 -0.096
2016-03-24T11:40 5.201 5.292 -0.091
The difference is called the residual. These residuals are regularly up to 100 mm during normal
weather conditions.
Model 2 is the same except for the ratio factor, which uses the actual amplitudes of the high
tides.
Table 2-VI Model 2 formulae
Model 2
PLT = M΄t₃+Lag-W΄b
And PRT = M΄t₃+Lag-W΄a
Where: W΄b = (Ht₁-ELT₁)-(Ht₂-ELT₂)*R+(Ht₂ -ELT₂)
W΄a = (Ht₁-LRT₁)-(Ht₂-LRT₂)*R+(Ht₂
-LRT₂)
With Lag = ((Ht₁-M΄t₁)-(Ht₂-M΄t₂))*R+(Ht₂-M΄t₂)
25
Chapter 3: Methodology
[image:39.595.70.531.178.425.2]3.1. Design
Table 3-I Design elements
Group Site
Data Set
Source time of measurement
Variables N
P A Hrs Sample
rate (min)
1 Mackay OH y 66h 20
m 72 h 10 10 23/03/16 24/07/16
M΄t, M΄a 1
2 Mackay OH y 66h 20
m 72h 72 h 10 10 10 23/03/16 23/05/16 24/07/16
Mt, Ma 3
3 Site 1 Camila y 9h 33m
8h 00m 5 5, 2.5
23/03/16 24/05/16
ELT, Ht, LRT 2
4 Site 2 Bucasia y 7h 40m
4h 00m 5 5, 2.5, 1
25/03/16 23/05/16
ELT, Ht, LRT 2
5 Site 3 Murray y 10 h
9h 30m 5 5,2.5,1
24/03/16 25/05/16
ELT, Ht, LRT 2
As mentioned in the previous chapter, one of the hypotheses is to
• Adequate predictions of access times at specific locations can be made using the relationship between the simultaneous measured amplitudes at a nearby standard port,
and the sites corresponding amplitudes and access times.
Group 1 refers to the predicted tide levels at a standard port, Mackay Outer Harbour (MoH).
This data represents a predicted level at 10 minute intervals. Group 2 is the corresponding
actual tide levels at MOH. The difference between the actual and predicted is the residual,
which reflect how atmospheric influences can impact on local sea levels. The 10 minute
predicted tide data for May was not available although the predicted time and level for all tide
changes are available through tide charts.
These were obtained online from the Queensland Government at
26 The measured variables in group 3, 4 and 5 were
Earliest Launch Time (ELT)
Latest Retrieval Time (LRT)
The actual time of high tide (Ht)
[image:40.595.74.524.193.472.2]These variables were extracted from the tidal shape curve, a plot of sea level over time.
Figure 3-1 Bucasia sea levels 25th March
At each site the sea level was observed and heights recorded at regular intervals. This was done
from before the tide reached the ramps navigable level, continuously through the ebb (high
tide), until the tide dropped below the navigable level, a period of many hours. This varied
between sites as the elevation of each ramp was in a different part of the tidal curve. This
process was repeated twice. The first, during one of the larger amplitude tides of the month and
the second during one of the smaller tides. Note that these tides are not the biggest nor the
smallest that could expect but most other tides would lie between these two amplitudes.
In subscript ELT₁ or ELT₂ refers to the session number. In the design of these data gathering
days, it was not possible to get the perfect tidal amplitude. The reason for this are
27
The time of high tide had to be around midday so that the full tidal curve could be observed in daylight. The equipment could still measure at night, but the
operator did not.
These two sets of data, and the simultaneously recorded MoH data are the basis for the access
window predictor.
From the observed data a curve of height over time was constructed. This plot shows the tidal
shape at each location. In total, six graphs were produced, two from each location. The actual
time of the ebb (Ht) is the time of the highest point on the curve. The earliest launch time (ELT)
and the latest retrieval time (LRT) can be interpolated from the curve at the navigable elevation
of each ramp.
From each session, the lag, that is the time difference between MoH and the sites high tide (Ht),
and the actual time the sea level crossed the navigable level, the ELT and LRT, was recorded.
The length of time between the ELT and Ht is the access window before high tide (Wb) and the
time between the Ht and LRT is the access window after high tide (Wa).
The assumptions made are that there is a relationship between the access times Wa and Wb with
the changes in the amplitude of the MoH tides. Two ‘snapshots’ were recorded and the data
used to linearly interpolate for other MoH tide amplitudes.
These variables are then used to calculate the Predicted Launch Time (PLT) and the Latest
Retrieval Time (LRT) at each location using the time and height of the predicted tide at MOH.
3.2. Reducing the impact of meteorological conditions
As described in the previous chapter, meteorological and atmospheric conditions play a
significant role in sea level prediction. Prolonged onshore winds can temporarily raise the sea
level and a high barometric pressure can lower local levels. This can have major influence
during severe weather. Periods of extreme weather were avoided during the data collection.
However, even during normal weather conditions anomalies exist.
Initially the design was to compare the predicted amplitude of the test day with the predicted
amplitudes from the two data gathering session. This was used to obtain a ratio factor to apply
to the access windows. It can be said that the meteorological forces that have deflected the tides
at MoH will have a similar impact at a nearby port on that given day. So if a strong onshore
wind had caused the sea level to rise a 100 mm at Mackay (not uncommon) then the same 100
28
Having the actual and predicted tide levels at Mackay allows for two solutions of access
windows, one using only predicted amplitudes and the other using actual measured tides levels
for the sessions 1 and 2.
3.3. Site selection
3.3.1. Camila site characteristics
Camila boat ramp is located on Camila creek, about 6 km from the Bruce Highway near the
small township of Camila.
Ramp is close to open ocean but has exposed flats at low tide
Located 93 km south of MoH
Accessible during mid to low tide
The ramp has always been a popular recreational boating launching point for access to the
remoter island in the Broad Sound. This area is notorious for shallow water and large tides. The
ramp has always been considered a half tide ramp although the ramp has been recently extended
to allow smaller boats to launch and access the permanent tidal pools that remain at low tide.
According to locals this extension has cause the flow to increase around the ramp making
launching dangerous during the flood tide.
29
Photo 3-B Camila Flood tide
30 3.3.2. Bucasia site characteristics
Bucasia ramp is located on the northern side of Eimeo Creek in Mackay. This is definitely only
a half tide ramp with the water only reaching the ramp a few hours either side of high tide. It is
close to the open ocean with extensive tidal flats exposed at low tide.
• Only accessible during upper part of tide • Very close to open ocean
• Not far from Mackay Outer Harbour (MoH)
Photo 3-D Bucasia location
31
Photo 3-F Bucasia boat-ramp
3.3.3. Murray Creek site characteristics
This ramp is located at the end of a dirt track on Constant Creek north of Mackay. This is very
popular recreational and up until recently professional fishing area. It has received a surge of
popularity since the State Government introduced several ‘net ban’ areas in Queensland. The
increase in activity has resulted in a refurbishment of the car park recently. Maritime Safety
Queensland (MSQ) has it listed as a tide dependant ramp, although similar to Camila, small
boats can launch at most tides since a ramp extension. It is located on a complex estuary system
some way upstream from the mouth. It has some rock-bars that restrict tidal flow (and outboard
motors).
• Located in the upper regions of complex estuarine system • Accessible in the lower half of the tide.
• located 47 km north of MOH • rock bars cause restricted flow
32
Murray Creek boat-ramp
33
34
3.4. Datum
3.4.1. Types of Datum
Since 1994 the datum on tide charts in Australia in the lowest astronomical tide (LAT). This
datum represents the lowest level that can be predicted to occur under normal conditions. The
port datum is the LAT at that site. Levels on tide charts are added to the port datum. When
using a marine chart, the depth is added to the interpolated tide level for that time to give you
water depth (Maritime Safety Queensland 2012).
Mean sea level (MSL) is the average sea level measured over a long time period. This time is
called the tidal epoch and in Queensland is 18.6 years (Maritime Safety Queensland 2016b).
A