safety
Article
Observing Patterns of River Usage
Amy E. Peden1,2,3,*, Richard C. Franklin1,2 , Peter A. Leggat2,4 and Daniel Lindsay2
1 Royal Life Saving Society–Australia, Broadway, NSW, 2007, Australia; [email protected]
2 College of Public Health, Medical and Veterinary Sciences, James Cook University, Townsville, QLD, 4811,
Australia; [email protected] (P.A.L.); [email protected] (D.L.)
3 School of Public Health and Community Medicine, University of New South Wales, Sydney, NSW, 2033,
Australia
4 School of Environmental and Geographical Sciences, Faculty of Science, University of Nottingham, Jalan
Broga, 43500 Semenyih, Selangor Darul Ehsan, Malaysia * Correspondence: [email protected]
Received: 11 July 2019; Accepted: 29 September 2019; Published: 4 October 2019
Abstract: Rivers are a leading location for drowning, yet little is known about people’s usage of these waterways. This pilot study aimed to test the use of direct observations to calculate river usage. Direct observations were conducted at regular intervals within defined zones at four river drowning locations in Australia (including weekends and the Australia Day national public holiday). Data recorded were date and time of observation; total people (including males, females, children, and adults); and number of people on, in, and beside the water. Univariate analysis with mean (SD) and range was conducted. Interrater reliability for observations was determined using the intraclass correlation coefficient (ICC) (one-way random-effects, average measures model), with a 95% confidence interval (CI). Across 149 time points, 309 observations resulted in 13,326 river interactions observed by multiple observers. There was an average of 39 people (M=39.4, SD=29.4, range=0–137) per observation, 44 people (M=44.2, SD=32.7, range=0–37) on an average weekend, and 97 people (M=96.8, SD=58.1, range=20–190) on Australia Day. More females (M=20.6, SD=16.0, range=0–83) than males (M=18.3, SD=14.5, range=0–68) were observed. More people were observed in the water (M=20.6, SD=20.4, range=0–84) than beside or on the water. Interrater reliability was excellent, consistently above 0.900 for all variables collected (apart from the variable of beside the river). Despite males accounting for 80% of river drowning fatalities, more females were observed than males. Increased visitation on the Australia Day public holiday may be linked to increased drowning risk. This study detailed a simple approach to data collection, exploring exposure within a defined zone at river locations. River usage is dynamic, with people’s movement in and out of the water changing their risk exposure. Observational-based data collection for drowning, particularly for rivers, is an important yet highly neglected area of research.
Keywords: drowning; rivers; exposure; observational studies; intraclass correlation coefficient (ICC); error; Australia; risk
1. Introduction
Accurately calculating exposure is one of the significant challenges associated with understanding drowning risk [1–3]. Many epidemiological studies of drowning utilise crude or age-standardised drowning rates per 100,000 population. However, drowning rates per head of population do not consider visitation, proximity to water (i.e., in, on, or beside the water), frequency and type of use, nor duration of visitation at aquatic locations, and thus, impact on drowning risk.
There are a variety of methods for calculating exposure. While surveys are a convenient tool, they have inherent limitations including their retrospective, self-reported nature and the impact of recall
bias on accuracy of data [4,5]. Observational studies are a popular alternative, although they are not without their own limitations, such as observer bias, confounding and selection bias, and cost [6].
To date, although surveys have been used to quantify drowning risk by exposure [1,3,7,8], with a number of studies in Australia [9–11], the only observational studies conducted have been at beaches [2,12,13]. This is despite rivers being the leading location for drowning in Australia [11] and a significant contributor to the global estimate of 360,000 fatal drownings each year [14]. There is a dearth of information enabling river drownings to be considered in the context of exposure at river locations.
Computer-assisted telephone interviewing (CATI) surveys have retrospectively asked participants about their aquatic usage to determine drowning rates by age group and sex [1,3]. For overall drowning risk in the Australian state of New South Wales, Mitchell et al. [1] found 25–34 year old males recorded the highest fatal drowning rate per 100,000 population, however when exposure was taken into account, males 65 years and older recorded the highest rate when exposed via being in or on the water and via swimming. For Australian beaches, Morgan et al. [2] found that males, when compared to females, spent longer in the water, were more likely to use surfing equipment, and mainly used a surf zone located farther from the shore and in deeper water. Findings suggest the overrepresentation of males in surf beach drowning statistics is, in part, a product of greater total exposure to the water plus more frequent exposure to deeper water and bathing further from shore [2].
For Australian rivers, after adjusting for exposure, Peden et al. (2018) [3] found a similar result, with males (7.6 times), males 75+years (8.5 times), and females 55–74 years (8.5 times) more likely to drown. When compared to females, males were 8.5 times more likely to drown with alcohol present and 25.5 times more likely to drown in a watercraft-related incident.
Data on exposure are important in order to identify those at increased risk of river drowning and guide effective prevention efforts. Given the dearth of information about river exposure, including a lack of real-time data collection in the field [3], this pilot study aimed to test the use of direct, visual observations to calculate river visitation.
2. Materials and Methods
This study utilised direct observation at popular access points to four river drowning locations during the 2018 summer (January and February) in Australia. Observers recorded data about patrons’ river usage within a pre-defined zone at regular intervals on a pre-prepared data collection sheet. This study forms part of a broader suite of work examining the epidemiology, risk factors, and strategies for the prevention of river drowning in Australia [3,9–11,15–19].
2.1. Site Selection
Observations were conducted at four river drowning locations, namely Alligator Creek (in the Australian state of Queensland) and the Murrumbidgee, Murray, and Hawkesbury rivers (in the state of New South Wales). Popular recreational locations with designated entry and exit points were chosen as the locations at the sites where the observational study would be conducted. Locations were chosen based on ease of use (in particular travel between two zones with consecutive days of data collection) and to achieve a mix of locations. Sites chosen spanned two Australian states; represented both council run and National Park owned and operated locations; were known for a mix of usage, e.g., popular swimming and/or boating locations; were both in towns and on the outskirts of towns; and in both tropical and sub-tropical climates.
2.2. Zone Identification and Study Design
the opposite side of the river. This was done to ensure consistency of observations and to ensure all observers used the same zone.
The methodology for identification of zones was adapted from the ‘Bingeing on the Beach’ study, which defined the sand and water between the flags (red and yellow beach flags put out by surf lifesavers to indicate the patrolled location to swim) as the zones of interest [20]. The zones of interest for this adaptation to rivers used an area that incorporated the water (both underneath and on top of) and the river bank/beach entry area. The riverbank zone extended to the beach entry area at Alligator Creek and the Murrumbidgee River, and to the grassy recreation area at the Murray and Hawkesbury River. When initially defining the zones, it was ensured that no blind spots were within the identified zone. Using direct observation, a minimum of two observers (from a pool of four), collected data on river usage within the predefined zone. Within the zone, observers collected data from a consistent location.
2.3. Data Collection
Data were collected across all sites for Friday, Saturday, and Sunday, with the Murray River having four extra days of data collection (Monday to Thursday). The Murray River data collection timeframe included Australia Day (Friday 26th January), which is a national public holiday in Australia. A seven day data collection period was used for the Murray due to its popularity and because it is a leading location for fatal drowning. This extended data collection period also allowed for the examination of weekday variation in river usage.
Data collection occurred during the Australian summer (January and February) and during the daylight savings period (where the sun does not set until 20:00–21:00 at night). Data collection at all sites except the Hawkesbury River occurred during school holidays. For each site, data were consistently collected on the half hour, every hour between 10:30am and 16:30. These hours were chosen in order to capture what the authors felt would be the majority of river attendees. Data were also collected at various hours outside this in order to allow for greater exploration of people’s visitation to rivers and how this changes over time during the day. Although observations were predominately conducted on the half hour, at hourly intervals, this was also varied, if required, based on factors such as needing to leave the site, other activities at the site, or wanting to see greater variation (i.e., 15 minutes intervals). Maximum daily air temperature was also recorded for each site from the [Australian] Bureau of Meteorology [21]. See Table1for a description of the sites and an outline of the data collection time periods and number of observations for each site.
Table 1.Data collection sites by time period, timeframe of observations, maximum daily air temperature, number of observations conducted and number of observers.
Site Name Description of Site Characteristics Date
Maximum Daily Air Temperature Degrees Celsius
(Fahrenheit)#
Time Period/Span1
Number of Observations Conducted Number of Observers (Number of Observations) Alligator Creek, Townsville, Queensland
Located within Bowling Green National Park, no gates or fees to enter. Carpark, BBQ facilities,
covered tables for eating, public toilet block, boardwalk area, and beach entry. One camping
area with facilities and three camping areas without facilities. Safety signage warning of previous death and injury at the site and
disallowing glass.
Friday 12 January, 2018 Saturday 13 January, 2018
Sunday 14 January, 2018
31.7 (89.1) 31.5 (88.7) 33.5 (92.3) 10:30–15:30 10:30–17:30 10:30–16:30 6 8 10 2 2 2 Murrumbidgee River, Wagga Wagga, New
South Wales
Carpark, BBQ facilities, covered tables for eating, public toilets, and a child’s playground. A canoe club is located at the site. There is a grassed area with trees and a sandy beach entry to the river. Walkway past the beach entry and down further along the river. Safety signage was present warning of submerged objects, strong currents,
and deep water.
Friday 19 January, 2018 Saturday 20 January, 2018
Sunday 21 January, 2018
39.8 (103.6) 41.5 (106.7) 42.1 (107.8) 10:30–20:30 9:30–20:30 9:30–17:30 11 12 9 3
3 ( 8 observations) 2 (4 observations) 3 (2 observations) 2 (7 observations)
Murray River, Albury, New South Wales
Carpark, large public reserve, child’s playground, BBQ facilities, picnic tables, public toilets, and public café(licensed—except for Australia Day).
The riverbank is covered in grass with concrete stairs and ramps to access the river at certain points. There is safety signage warning about strong currents. The site was a designated
‘alcohol free zone’ on Australia Day.
Monday 22 January, 2018 Tuesday 23 January, 2018 Wednesday 24 January, 2018
Thursday 25 January, 2018 Friday 26 January, 20182
Saturday 27 January, 2018 Sunday 28 January, 2018
38.2 (100.8) 41.5 (106.7) 33.5 (92.3) 35.8 (96.4) 37.3 (99.1) 34.2 (93.6) 36.8 (98.2) 9:30–17:00 10:30–18:00 07:30–19:00 08:30–17:30 08:30–17:30 08:30–19:30 08:30–17:30 9 9 9 9 10 12 10 2 2 2 2 2 2 2 Hawkesbury River, Windsor, New South
Wales
Carpark, large public reserve, public toilets, a boat ramp, and a boardwalk area adjacent to the
boat ramp at the river’s edge. The boat ramp featured safety signage regarding paddle craft, shallow water, wearing a lifejacket, and alcohol.
Friday 2 February, 2018 Saturday 3 February, 2018
Sunday 4 February, 2018
24.7 (76.5) 26.8 (80.2) 28.6 (83.5) 10:30–17:30 10:00–17:30 9:30–16:30 8 9 8
2 (7 observations) 1 (1 observation) 2 (3 observations) 1 (6 observations) 2 (7 observations) 1 (1 observation)
2.4. Observer Characteristics
Four observers were used across the data collection period. At any one time, a minimum of two observers were conducting observations. All observers were tertiary educated, three of four have expertise in drowning prevention, two have expertise in CPR-related research, and one prior training in observation techniques. All were aged between 22 and 43 years.
2.5. Data Coding and Cleaning
Data sheets were retained and electronically scanned to the primary researcher’s computer as an electronic backup. Data sheets were also photographed at the end of the day in case any sheets were lost. Data were transferred from the paper-based forms to an Excel spreadsheet at the end of each day. Twenty percent (n=7) of the sheets were rechecked by authors AEP and RCF; however, no data entry errors were identified. The four spreadsheets for each data collection site were combined into one file with a new variable added to denote the data collection site. The Excel spreadsheet was then converted into an IBMSPSS V20 dataset for the purposes of analysis. Time of day of observation was coded into the following time bands: morning (07:30–11:59), afternoon (12:00–17:59), and evening (18:00–20:30). These time bands correlate to data collection on drowning fatalities and allow for comparison of river exposure data with river fatality data.
2.6. Statistical Tests
Data were examined using univariate analysis, with mean (SD) and range calculated. ANOVA and T-tests were used to calculate statistical differences in average people observed, males and females observed, adults and children observed, and river usage by time of day, day of week, public holidays, and weekends. A modified Bonferonni, as suggested by Keppel [23], has been applied, deeming statistical significancep= 0.007. Interrater reliability for observations was determined using the intraclass correlation coefficient (ICC), with a 95% confidence interval (CI) reported. As per the guidelines outlined for ICC use in Hallgren [24], a one-way random-effects, average measures model examining absolute agreement was the ICC method chosen for this study.
This model was chosen because different raters were used across observations, all observations in the study were performed by multiple raters, and the agreement between values of the raters was of interest to the study [24]. As Australia Day (Friday 26th January) was an outlier, this was removed from the analysis and dealt with separately. As it is a day when most people are not at work or school, data collected on Australia Day were compared to an average weekend day. Only those observations with two or more observers were used for the purposes of calculating ICC, being 97.4% of all observations undertaken.
2.7. Ethics
Ethical approval for this study was provided by the Human Research Ethics Committee of James Cook University (HREC–H7249).
3. Results
There were 309 observations conducted across 149 time points, resulting in 13,326 river interactions observed by multiple observers. Of the 309 observations, 19 (6.1%) were undertaken on Australia Day and eight (2.6%) were not conducted by a minimum of two observers, and were therefore excluded from the calculation of the ICC.
3.1. Non-Australia Day observations
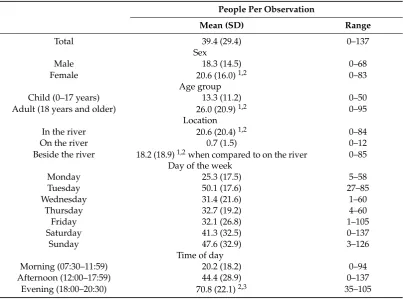
males were observed (t(287)=−4.07,p<0.001). A significantly higher average number of adults
[image:6.595.97.501.145.444.2]compared to children were also observed (t(288)=−12.953,p<0.001) (Table2).
Table 2.Demographics, proximity to river, and day of week by people observed (n=290 observations).
People Per Observation
Mean (SD) Range
Total 39.4 (29.4) 0–137
Sex
Male 18.3 (14.5) 0–68
Female 20.6 (16.0)1,2 0–83
Age group
Child (0–17 years) 13.3 (11.2) 0–50
Adult (18 years and older) 26.0 (20.9)1,2 0–95
Location
In the river 20.6 (20.4)1,2 0–84
On the river 0.7 (1.5) 0–12
Beside the river 18.2 (18.9)1,2when compared to on the river 0–85
Day of the week
Monday 25.3 (17.5) 5–58
Tuesday 50.1 (17.6) 27–85
Wednesday 31.4 (21.6) 1–60
Thursday 32.7 (19.2) 4–60
Friday 32.1 (26.8) 1–105
Saturday 41.3 (32.5) 0–137
Sunday 47.6 (32.9) 3–126
Time of day
Morning (07:30–11:59) 20.2 (18.2) 0–94
Afternoon (12:00–17:59) 44.4 (28.9) 0–137
Evening (18:00–20:30) 70.8 (22.1)2,3 35–105
1Independent samples t-test (pvalue).2statistical significancep<0.001.3One-way ANOVA.
The largest average number of people were observed in the river, in contrast to those beside or on the river. As the day progressed, the average number of people observed significantly increased, with the highest average number of people observed during the evening hours (F (6,286)=50.33,p<0.001) (Table2).
Figure1depicts the mean number of people observed by the number of observations across the day. The number of observations peaked in the morning (10:30) and early afternoon (15:30) (n=30 observations), whereas the average number of people observed peaked in the evening hours (n=81 people at 19:30). (Figure1).
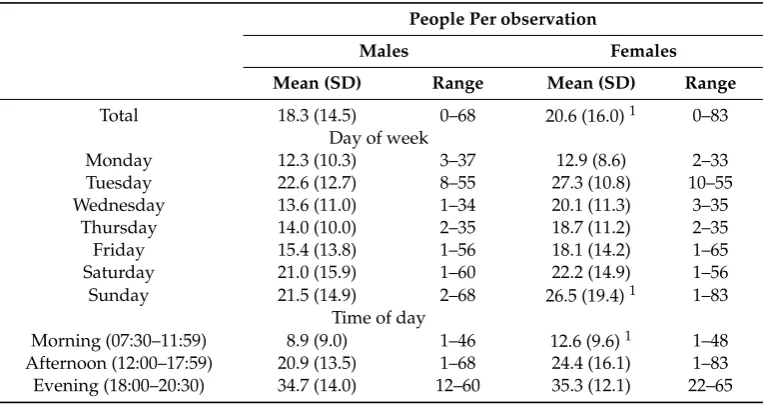
On average, more females than males were observed on every day of the week. This was significant on Sundays (t(73)=−3.60, p=0.001). Similarly, significantly more females than males were reported
during the morning (t(89)=−4.91,p<0.001) and afternoon (t(170)=−2.94,p=0.004) observations.
2019, 6, x FOR PEER REVIEW 3 of 17
Figure 1. Time of day by average number of people observed by number of observations. Note this figure depicts the time points where data were consistently collected across all observation sites, being on the half hour.
[image:7.595.108.491.384.586.2]On average, more females than males were observed on every day of the week. This was significant on Sundays (t(73) = –3.60, p = 0.001). Similarly, significantly more females than males were reported during the morning (t(89) = –4.91, p < 0.001) and afternoon (t(170) = –2.94, p = 0.004) observations. The smallest difference in visitation by sex was reported in the evening hours. (Table 3)
Table 3. Differences in river exposure by sex by in, on, or beside the river; time of day; and day of week.
People Per observation
Males Females
Mean (SD) Range Mean (SD) Range
Total 18.3 (14.5) 0–68 20.6 (16.0) 1 0–83
Day of week
Monday 12.3 (10.3) 3–37 12.9 (8.6) 2–33 Tuesday 22.6 (12.7) 8–55 27.3 (10.8) 10–55 Wednesday 13.6 (11.0) 1–34 20.1 (11.3) 3–35
Thursday 14.0 (10.0) 2–35 18.7 (11.2) 2–35 Friday 15.4 (13.8) 1–56 18.1 (14.2) 1–65 Saturday 21.0 (15.9) 1–60 22.2 (14.9) 1–56 Sunday 21.5 (14.9) 2–68 26.5 (19.4) 1 1–83
Time of day
Morning (07:30–11:59) 8.9 (9.0) 1–46 12.6 (9.6) 1 1–48
Afternoon (12:00–17:59) 20.9 (13.5) 1–68 24.4 (16.1) 1–83 Evening (18:00–20:30) 34.7 (14.0) 12–60 35.3 (12.1) 22–65
1 Statistical significance p=0.007.
3.2. Australia Day
Across the 19 observations conducted on Australia Day, an average of 97 people were observed, significantly higher than when compared to the mean number of people observed on an average weekend day (t(176) = 3.96, p = 0.001) and higher than both an average weekend and an average
0 5 10 15 20 25 30 35 0.0 10.0 20.0 30.0 40.0 50.0 60.0 70.0 80.0 90.0
7.30 8.30 9.30 10.30 11.30 12.30 13.30 14.30 15.30 16.30 17.30 18.30 19.30 20.30
Number of observ ations Mean people observ ed
Time of day of observation
Mean people observed Number of observations
Figure 1.Time of day by average number of people observed by number of observations. Note this figure depicts the time points where data were consistently collected across all observation sites, being on the half hour.
Table 3.Differences in river exposure by sex by in, on, or beside the river; time of day; and day of week.
People Per observation
Males Females
Mean (SD) Range Mean (SD) Range
Total 18.3 (14.5) 0–68 20.6 (16.0)1 0–83
Day of week
Monday 12.3 (10.3) 3–37 12.9 (8.6) 2–33
Tuesday 22.6 (12.7) 8–55 27.3 (10.8) 10–55
Wednesday 13.6 (11.0) 1–34 20.1 (11.3) 3–35
Thursday 14.0 (10.0) 2–35 18.7 (11.2) 2–35
Friday 15.4 (13.8) 1–56 18.1 (14.2) 1–65
Saturday 21.0 (15.9) 1–60 22.2 (14.9) 1–56
Sunday 21.5 (14.9) 2–68 26.5 (19.4)1 1–83
Time of day
Morning (07:30–11:59) 8.9 (9.0) 1–46 12.6 (9.6)1 1–48
Afternoon (12:00–17:59) 20.9 (13.5) 1–68 24.4 (16.1) 1–83 Evening (18:00–20:30) 34.7 (14.0) 12–60 35.3 (12.1) 22–65
1Statistical significancep=0.007.
3.2. Australia Day
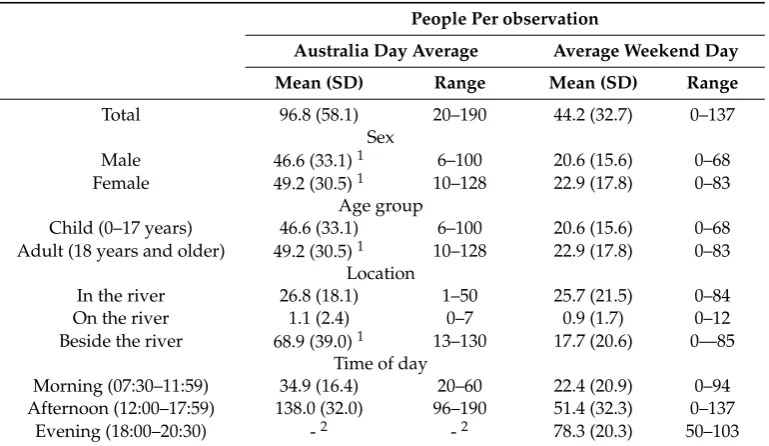
Across the 19 observations conducted on Australia Day, an average of 97 people were observed, significantly higher than when compared to the mean number of people observed on an average weekend day (t(176)=3.96,p=0.001) and higher than both an average weekend and an average weekday (excluding Australia Day) at the same location. Similar to non-Australia Day findings, more females than males were observed at the river (Table4).
A similar average number of children were observed on Australia Day and the average weekend day. Significantly more adults were observed on Australia Day than an average weekend day (F(76, 232)=3.81,p<0.001) (Table4).
at the river in the afternoon hours on Australia Day than an average weekend day. There were no observations conducted on Australia Day in the evening hours to allow for comparison (Table4).
Table 4.Results of Australia Day observations, compared to average weekend day.
People Per observation
Australia Day Average Average Weekend Day
Mean (SD) Range Mean (SD) Range
Total 96.8 (58.1) 20–190 44.2 (32.7) 0–137
Sex
Male 46.6 (33.1)1 6–100 20.6 (15.6) 0–68
Female 49.2 (30.5)1 10–128 22.9 (17.8) 0–83
Age group
Child (0–17 years) 46.6 (33.1) 6–100 20.6 (15.6) 0–68
Adult (18 years and older) 49.2 (30.5)1 10–128 22.9 (17.8) 0–83 Location
In the river 26.8 (18.1) 1–50 25.7 (21.5) 0–84
On the river 1.1 (2.4) 0–7 0.9 (1.7) 0–12
Beside the river 68.9 (39.0)1 13–130 17.7 (20.6) 0—85 Time of day
Morning (07:30–11:59) 34.9 (16.4) 20–60 22.4 (20.9) 0–94 Afternoon (12:00–17:59) 138.0 (32.0) 96–190 51.4 (32.3) 0–137
Evening (18:00–20:30) -2 -2 78.3 (20.3) 50–103
1Statistical significancep=0.001.2Data were not collected at these times on Australia Day and therefore analysis could not be conducted.
3.3. ICC Calculations
Of the 131 calculations with a minimum of two observers, 106 (80.9%) had two observers and 25 (19.1%) had three observers. One observer (AEP) conducted 100.0% of the observations and a second observer (SP) conducted 81.7% of the observations.
There was a high degree of reliability found for all variables. The variable ‘on the river’ recorded perfect agreement. The average number of people observed had the next highest level of agreement between observers. The only variable with an ICC score below 0.900 was the variable of average number of people observed ‘beside the river’, which had an ICC(1,k) of 0.892 (CI: 0.769–0.955) (Table5).
Table 5. Intraclass coefficient calculations (ICC 1,k) of accuracy of observations with a minimum of two observers.
Intraclass Correlation ICC (1,k) Confidence Interval (CI)
Total 0.994 0.988–0.998
Sex
Males per observation 0.955 0.905–0.981
Females per observation 0.920 0.830–0.967
Age group
Child (0–17 years) 0.939 0.871–0.975
Adult (18 years and older) 0.961 0.916–0.984
Location
In the river 0.981 0.959–0.992
On the river 1.000 1.000–1.000
Beside the river 0.892 0.769–0.955
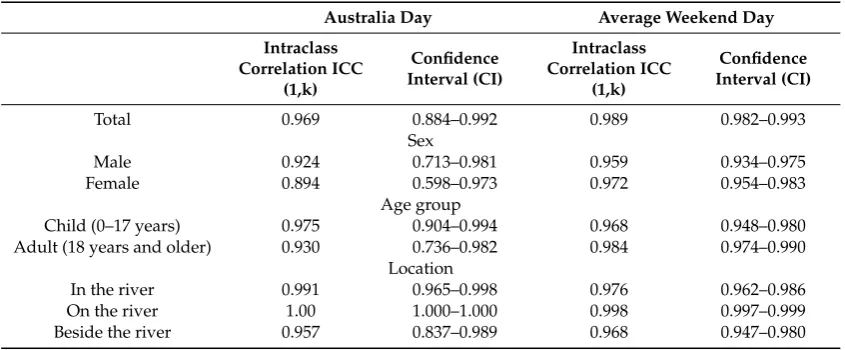
[image:8.595.93.502.560.704.2]beside the river recorded higher ICC scores on the average weekend day, with the variables of children, in the river, and on the river recoding higher ICC scores on Australia Day (Table6).
Table 6.Intraclass coefficient calculations (ICC 1,k) for Australia Day compared to an average day.
Australia Day Average Weekend Day
Intraclass Correlation ICC
(1,k)
Confidence Interval (CI)
Intraclass Correlation ICC
(1,k)
Confidence Interval (CI)
Total 0.969 0.884–0.992 0.989 0.982–0.993
Sex
Male 0.924 0.713–0.981 0.959 0.934–0.975
Female 0.894 0.598–0.973 0.972 0.954–0.983
Age group
Child (0–17 years) 0.975 0.904–0.994 0.968 0.948–0.980
Adult (18 years and older) 0.930 0.736–0.982 0.984 0.974–0.990
Location
In the river 0.991 0.965–0.998 0.976 0.962–0.986
On the river 1.00 1.000–1.000 0.998 0.997–0.999
Beside the river 0.957 0.837–0.989 0.968 0.947–0.980
4. Discussion
Calculating exposure is one of the significant challenges for understanding risk of injury [25], including drowning [1–3,9–11]. Collecting data on river exposure is challenging both at the macro level (i.e., how often do people visit a river in a given time period) and, in particular, at the micro level (i.e., what was the person doing at the location and for how long?). This does not take into account challenges around water depth, speed, and temperature, as well as environmental factors such as air temperature and visibility, which may also influence the risk of drowning.
This study used direct observations, which had an excellent level of agreement between observers, at four river drowning locations in Australia. Results show on average more females than males and more adults than children visited rivers. On average, more people were in the river than beside or on the river, although noting this is within the zone of observation only and does not include all people at the river. River usage peaked in the early evening hours with an average of 81 people observed at 19:30.
Worldwide, very few studies examining exposure to drowning risk have been conducted [9]. In Australia, much of the published data involve observations conducted at beaches [2,12,13], with one study examining self-reported river visitation (and impact on drowning risk) through the use of a CATI survey [3]. Both the beach observations [2,12,13] and survey of river visitation [3], found more males than females visiting the locations, with 70% of beach observations being male [2] and 75% of males visiting a river at least once in the 12 months prior to the survey, compared to 72% of females [3]. By contrast, this study saw a higher average number of females observed than males. Further data collection, or observation studies, at additional river locations are required to further test data on sex differences in river visitation collected through this study.
4.1. Comparing River Visitation Data to Fatal River Drowning Statistics
When examining river visitation by time of day, the mean number of people observed peaked in the evening hours (M=71) followed by the afternoon (M=44). This slightly differs from findings of the epidemiological analysis of fatal unintentional river drowning by the same time of day. The afternoon hours were found to record the highest proportion of river drowning fatalities (41.7%), compared to 20.8% of deaths in the evening hours [11]. This discrepancy may be explained by the evening time band for deaths running from 18:01 to 00:00, as opposed to the observations, which ran from 18:00 to 20:30, due to ethical constraints, as well as seasonal variation in drowning risk.
Similarly, due to ethical constraints, no data were captured in the early morning hours (00:01 to 06:00), during which time a further 10% of river drowning fatalities occur [11]. Ethical strategies that do not compromise safety for the data collectors, should be explored to address this gap in river exposure understanding. Options may include remote camera observations or time lapse photography.
4.2. Error and Bias
ICC calculations indicated an excellent level of agreement between observers for all data collected. The majority of ICC scores were above 0.900, with the variable of on the river scoring perfect agreement. This may be due to the fact that there were smaller numbers of people on the water boating or kayaking, as opposed to in or beside the river. Observers were more accurate in calculating the number of males and adults at the river, whereas ICC scores were lower (i.e.,<0.900) for the variables of beside the river and females on Australia Day. This may be due to larger numbers or challenges in determining gender when conducting observations, however overall, variables collected on Australia Day still had reasonably accurate ICC scores.
The locations chosen for observations had a bias towards swimming and activities where the person visiting the river was more likely to be in the water or beside the water, rather than on the water. Rivers often had a beach or step entry encouraging swimming. Only one location (the Hawkesbury River) was more predominately geared toward boating and had a boat ramp. Watercraft-related incidents (including both powered and unpowered boats and craft) account for 14% of all river drowning deaths [11] in Australia. Future data collection must collect data from a diverse range of river drowning locations and explore data collection at different locations along a river (i.e., not only those locations adjacent to popular entry and exit points).
4.3. Challenges
Rivers are a fluid environment, which poses challenges for the collection of data on exposure. While conducting observations, it was possible for individuals observed to move in and out of the water, to disappear entirely under the water while swimming, and even move in or out of the observation zone entirely. Although there was a high degree of reliability between observers, anecdotally, observers reported challenges in determining the sex of a person, especially if only the head of the person was visible above the water, and also difficulty in determining if older teenagers were children or adults. Exploring alternative ways to collect such data, such as through participatory public data collection tools including electronic diaries or cell phone ‘apps’, may be warranted to overcome such data challenges.
observation cameras and community data collection through diaries or cell phone “apps”, might be a possibility to collect data on river visitation and usage during the late evening and early morning hours. Data were collected on three types of river usage, in the river (i.e., in water), on the river, and beside the river. Observations conducted on average number of people beside the river were not as accurate as in the river or on the river. The observation zones often covered quite a large area immediately from the waters’ edge to a discernible area up to several metres beyond the riverbank. Falls (i.e., unintentional entry into water) account for 21% of all fatal unintentional drownings in rivers [11], although it is not known what distance people fall from. Further research is required to examine the specific issue of falls into rivers, including the impact of alcohol on falls among adults.
4.4. Holidays and the Impact on Exposure
An increase in river visitation was seen on Australia Day with an average of 97 people per observation, compared to an average of 44 on an average weekend day and an average of 39 people per observation overall. When compared to an average weekend day, significantly more males, females, and adults were observed on Australia Day, as well as significantly more people in and beside the river. Australia Day is a national public holiday where most adults do not attend work and students are on school holidays. Studies have shown an increase in drowning risk on holidays [27–30], due to increased leisure time, travel to unfamiliar aquatic environments [31], and alcohol consumption [32]. Studies have also shown increased alcohol consumption at rivers on Australia Day [26]. Such findings must be considered in the development and timing of distribution of public awareness messages about drowning risk at rivers. Further research is also required to determine if more people visiting rivers is protective or increases drowning risk.
It should be noted that there were Australia Day celebration events held at the data collection site (Murray River), which may have attracted more people than usual to the river precinct. The data collected represent this site on one day only and may not be indicative of other river sites on Australia Day. Further research is required to determine if similar increases in visitation are seen at other rivers on Australia Day and the impact of preorganised events on crowd numbers. The importance of conducting a risk assessment and having a risk mitigation plan in place must be communicated to local councils and organisers holding events in and around rivers [33].
4.5. Implications for Future Research
Observing river usage is a sound methodology for data collection on river visitation and usage, as shown by the high ICC scores, which indicated an excellent level of agreement between observers. The process appears to have good usability in the field, with minimal tools (e.g., two observers and a clipboard and pen with a data collection sheet) yielding consistent and usable data. Direct observations also avoid some of the limitations of surveys [34]. However, the process of conducting observations has its own limitations, as well as being time consuming and labour intensive. While other areas of injury prevention also utilise headcounts [35–37], more realistic methods for gathering data on river exposure and usage should also be explored. Alternative data collection measures may include community observation methods that would see larger amounts of data collected at a larger number of river locations with more diverse geographical dispersion and usage patterns. Alternative data collection methods may support or dispute the accuracy of direct observations to calculate river usage.
4.6. Practical Applications
Exposure impacts drowning risk [1–3]. Building upon epidemiological studies of drowning which consider exposure, rather than crude drowning rates per 100,000 population, can provide a more nuanced understanding of those at risk and better inform drowning prevention interventions.
This study detailed a simple approach to the collection of data on exposure that recorded high levels of accuracy between coders. The method was low resource, albeit with some challenges, in particular human resource requirements. Alternative approaches such as remote camera observation, the use of diaries or mobile phone “apps”, or artificial intelligence should be explored to allow for greater data collection, including at a wide range of locations and across more time points [3]. The findings of this study provide justification for observation-based data collection for drowning, in particular at rivers, which have been a neglected yet highly prevalent location for drowning.
4.7. Strengths and Limitations
This study is the first of its kind to use direct observations at river drowning locations. The study design resulted in observations conducted at different times across the day, during both weekdays and weekends. The large number of observations conducted (N=13,326) generated a significant pool of data with which to conduct statistical analysis about river usage. The study design is transferrable to the different sites where data were collected, with a high degree of reliability between observers.
There are limitations associated with this study. The data represent the best efforts of the observers. The fluid nature of river environments, where river users may have moved between zones while being observed (e.g., from beside the water to in the water), may have affected accuracy of data. While observers did not collude or compare findings, they were standing near each other in order to observe the same zone when recording data, which may have impacted the results. Observers may have benefited from practice effects, which saw data recording improve over time.
Data were collected in person (i.e., not using still images or video) and, therefore, there were site-specific visibility issues (e.g., natural slopes and gullies in the land, trees etc.), which may have impaired an observers ability to accurately record data. Observation zones varied in overall size site by site. As the research attracted media coverage (print, radio, television, and online), the results may be subject to social desirability bias. The presence of researchers may have influenced behaviour. While data were collected consistently at all four river locations for Fridays, Saturdays, and Sundays, data for Monday–Thursday were collected at one location only. This is a pilot study and represents what was observed at the four sites during data collection times only. The sites chosen aimed to reflect a diverse range of river scenarios, however these sites may not be a representative mix of typical river recreational locations. Further research is required to test these findings more widely at more diverse river locations. The time of day at which data could be collected was limited by ethical constraints. Given the number of people still present at the end of day counts, consideration should be given to conducting counts later into the evening.
5. Conclusions
Rivers are a leading location for drowning internationally, and the leading location for drowning in Australia, though little is known about exposure to drowning risk. Through direct observations, this study collected data on river visitation and usage, with a high degree of reliability between multiple observers. Despite males accounting for 80% of unintentional river drowning fatalities, more females were observed at rivers. Increased visitation was recorded on weekends and the Australia Day public holiday. The use of observational headcounts provided a greater understanding of river visitation and usage, and therefore drowning risk. Alternative data collection tools and methodologies, such as community observations and the use of cell phone “apps”, should be explored.
Funding:This research received no external funding.
Acknowledgments: This research is supported by Royal Life Saving Society–Australia to aid in the reduction of drowning. Research at Royal Life Saving Society–Australia is supported by the Australian Government. The authors would like to thank the river users who were welcoming of our presence. The authors wish to thank Stacey Pidgeon (Royal Life Saving Society–Australia) and Matthew Riggs (James Cook University) for their assistance in gathering the data. Lead author AEP’s doctoral studies are supported through an Australian Government Research Training Program Scholarship.
Conflicts of Interest:The authors declare no conflict of interest.
References
1. Mitchell, R.J.; Williamson, A.M.; Olivier, J. Estimates of drowning morbidity and mortality adjusted for exposure to risk.Inj. Prev.2010,16, 261–266. [CrossRef] [PubMed]
2. Morgan, D.; Ozanne-Smith, J.; Triggs, T. Direct observation measurement of drowning risk exposure for surf beach bathers.J. Sci. Med. Sport2009,12, 457–462. [CrossRef] [PubMed]
3. Peden, A.E.; Franklin, R.C.; Leggat, P.A. Exploring visitation at rivers to understand drowning risk.Inj. Prev. 2019,25, 392–399. [CrossRef] [PubMed]
4. Andersen, L.P.; Mikkelsen, K.L. Recall of occupational injuries: A comparison of questionnaire and diary data.Saf. Sci.2008,46, 255–260. [CrossRef]
5. Af Wåhlberg, A.E.; Dorn, L. How reliable are self-report measures of mileage, violations and crashes?Saf. Sci. 2015,76, 67–73. [CrossRef]
6. Robson, C. Chapter 13: Observational Methods. InReal World Research, 3rd ed.; John Wiley and Sons: Chichester, UK, 2011.
7. Gulliver, P.; Begg, D. Usual water-related behaviour and ‘near-drowning’ incidents in young adults.Aust. N. Z. J. Public Health2005,29, 238–243. [CrossRef]
8. Howland, J.; Mangione, T.; Hingson, R.; Levenson, S.; Winter, M.; Altwicker, A. A pilot survey of aquatic activities and related consumption of alcohol, with implications for drowning.Public Health Rep.1990,105, 415–419.
9. Peden, A.E.; Franklin, R.C.; Leggat, P.A. Fatal River Drowning: Identification of Research Gaps through a Systematic Literature Review.Inj. Prev.2016,22, 202–209. [CrossRef]
10. Peden, A.E.; Franklin, R.C.; Leggat, P.A. Alcohol and its contributory role in fatal drowning in Australian rivers, 2002–2012.Accid. Anal. Prev.2017,98, 259–265. [CrossRef]
11. Peden, A.E.; Franklin, R.C.; Leggat, P.A. The Hidden Tragedy of Rivers: A decade of unintentional fatal drowning in Australia.PLoS ONE2016,11, e0160709. [CrossRef]
12. Morgan, D. Estimates of drowning morbidity and mortality adjusted for exposure to risk.Inj. Prev.2011,17, 359. [CrossRef] [PubMed]
13. Morgan, D.; Ozanne-Smith, J. Development and Trial of a Water Exposure Measure of Estimated Drowning Risk for Surf Bathers.Int. J. Aquat. Res. Educ.2013,7, 116–135. [CrossRef]
14. World Health Organization. Preventing Drowning: An Implementation Guide; World Health Organization: Geneva, Switzerland, 2017.
15. Peden, A.E.; Franklin, R.C.; Leggat, P.A.; Aitken, P. Causal Pathways of Flood Related River Drowning Deaths in Australia.PLOS Curr. Disasters2017. [CrossRef]
16. Peden, A.E.; Franklin, R.C.; Leggat, P.A. The Flood-Related Behaviour of River Users in Australia.PLOS Curr. Disasters2018. [CrossRef]
17. Peden, A.E.; Franklin, R.C.; Leggat, P.A. Cardiopulmonary resuscitation and first-aid training of river users in Australia: A strategy for reducing drowning.Health Promot. J. Aust.2019,30, 258–262. [CrossRef] 18. Peden, A.E.; Franklin, R.C.; Leggat, P.A. Preventing river drowning deaths: Lessons from coronial
recommendations.Health Promot. J. Aust.2018,29, 144–152. [CrossRef]
19. Peden, A.E.; Franklin, R.C.; Leggat, P.A. Developing drowning prevention strategies for rivers through the use of a modified Delphi process.Inj. Prev.2019. [CrossRef]
21. Bureau of Meteorology. Climate Data Online. Australian Government, Canberra. Available online: http://www.bom.gov.au/climate/data/index.shtml?bookmark=136(accessed on 11 April 2018).
22. Australian Law Reform Commission. Seen and Heard: Priority for Children in the Legal Process (ALRC Report 84): Australian Government. 2015. Available online:http://www.alrc.gov.au/publications/ 18-childrens-involvement-criminal-justice-processes/age-thresholds-criminal-justice-pro (accessed on 3 March 2018).
23. Keppel, G.Design and Analysis: A Researcher’s Handbook, 3rd ed.; Prentice Hall: Englewood Cliffs, NJ, USA, 1991.
24. Hallgren, K.A. Computing Inter-Rater Reliability for Observational Data: An Overview and Tutorial. Tutor. Quant. Methods Psychol.2012,8, 23–34. [CrossRef]
25. Hinkelbein, J. Significant Lack of Data in Aviation Accident Analysis.Aviat. Space Environ. Med.2010,81, 77. [CrossRef]
26. Peden, A.E.; Franklin, R.C.; Leggat, P.A. Breathalysing and surveying river users in Australia to understand alcohol consumption and attitudes toward drowning risk. BMC Public Health2018,18, 1393. [CrossRef] [PubMed]
27. Barnsley, P.; Peden, A.E. A Retrospective, Cross-Sectional Cohort Study Examining the Risk of Unintentional Fatal Drowning during Public Holidays in Australia.Safety2018,4, 42. [CrossRef]
28. Peden, A.E.; Barnsley, P.D.; Queiroga, A.C. The association between school holidays and unintentional fatal drowning among children and adolescents aged 5–17 years.J. Paediatr. Child Health2019,55, 533–538. [CrossRef] [PubMed]
29. Tellier, E.; Simonnet, B.; Bailhache, M. Modelling and predicting drowning risk along the Gironde’s Oceanic Coast: Retrospective, prospective observational and pilot experimental studies.Revue d’Épidémiologie et de SantéPublique2018,66, S334–S335. [CrossRef]
30. Cohen, C.; Scolnik, D.; Rimon, A. Childhood Drowning: Review of Patients Presenting to the Emergency Departments of 2 Large Tertiary Care Pediatric Hospitals Near and Distant from the Sea Coast. Pediatr. Emerg. Care2018. [CrossRef]
31. Peden, A.E.; Franklin, R.C.; Leggat, P.A. International travelers and unintentional fatal drowning in Australia—A 10 year review 2002–2012.J. Travel Med.2016,23, 1–7. [CrossRef]
32. Lloyd, B.; Matthews, S.; Livingston, M. Alcohol intoxication in the context of major public holidays, sporting and social events: A time–series analysis in Melbourne, Australia, 2000–2009.Addiction2013,108, 701–709. [CrossRef]
33. Australian Water Safety Council.A Guide to Water Safety Essentials for Local Governments; Australian Water Safety Council: Sydney, Australian, 2008.
34. Drews, C.; Kraus, J.F.; Greenland, S. Recall bias in a case-control study of Sudden Infant Death Syndrome. Int. J. Epidemiol.1990,19, 405–411. [CrossRef]
35. Macpherson, A.; Parkin, P.C.; To, T.M. Mandatory helmet legislation and children’s exposure to cycling. Inj. Prev.2001,7, 228–230. [CrossRef]
36. Morongiello, B.A.; Dawber, T. Parental Influences on Toddlers’ Injury-Risk Behaviors: Are Sons and Daughters Socialized Differently?J. Appl. Dev. Psychol.1999,20, 227–251. [CrossRef]
37. Harrell, W.A. Effect of Two Warning Signs on Adult Supervision and Risky Activities by Children in Grocery Shopping Carts.Psychol. Rep.2003,92, 889–898. [CrossRef] [PubMed]