Faculty of Health, Engineering and Sciences
Application of electro-kinesis for saline-sodic
irrigation management
A Thesis submitted by
Jamal Mohamed Fernana
For the award of
DOCTOR OF PHILOSOPHY
I dedicate this work
to
My Mother
My Father’s soul
My Wife
My Children
My Siblings
My whole Family
And all of my Friends
Jamal Mohamed Fernana
Abstract
I
Abstract
The increasing demand for food production, and scarcity of good quality water with which to address this, has led to the use of marginal quality water, such as saline-sodic groundwater, for irrigation purposes, particularly in the arid and semi-arid areas. Long-term use of saline–sodic water for irrigation may adversely affect soil properties and crop yields. Traditionally, larger amounts of irrigation water are applied to leach salts from the root zone in order to maintain the root zone concentration of salts below the threshold for plant damage. However, the addition of excess water for salt leaching may lead to nitrate leaching out of the root zone, degrading groundwater quality and reducing crop production. To reduce these issues, this research has evaluated the potential for electro-kinesis (EK) to manage nitrate and salts within a simulated root zone depth (sand column) irrigated with saline-sodic water.
While previous research has been undertaken to evaluate the use of electro-kinesis (EK) under a narrow range of soil conditions, there is a lack of data on the ability to simultaneously control salt and nitrate movement in soil using EK, and insufficient evidence to understand the soil, water and management conditions under which EK may be usefully applied to improve root zone management. Therefore, three laboratory trials were conducted using sand columns (uncharged particles) investigate the effect of EK on salt distribution, nitrate movement and management options for the use of EK in combination with saline-sodic irrigation. A combined soil-water and EK model was subsequently developed and validated. The model was then used to predict nitrate and salt distribution under a range of EK and irrigation treatments.
The first study evaluated the effect of applying EK to irrigated sand columns (30 and 50 cm) with two different electrode separate distances (20 and 40 cm, where the anode was installed at the top while the cathode sheet was installed at the bottom of the sand column). The results showed that EK application significantly affected both soil solution ion movement within the column and the soil pH near the electrodes. Anions (i.e. chloride) were moved upwards in the sand column and held in the upper layers against the downward flow of applied irrigation water. However, the magnitude of the effect varied as a function of the EK application period, rate of EK application and the distance between the electrodes.
The second trial evaluated nitrate movement with three EK treatments (0, 0.005A, 0.01A and 0.02A, for 24h) applied to sand columns under various irrigation rates (0, 10, 20 and 30 mL h-1 for 9h). The results showed that application of EK resulted in a significant increase in nitrate concentration near the anode, and a significant decrease near the cathode. At the same time, the EC was significantly increased and the solution pH became more acidic (<6.5 initial condition) near the anode and alkaline (~ pH 10) near the cathode. Irrigation significantly decreased the nitrate concentration throughout the sand columns with leaching increasing as high irrigation rates and longer irrigation durations were applied.
Abstract
II
The sequential application of EK, irrigation and fertigation was shown to be an effective strategy for managing the movement of water and solution in a sand column. In general, nitrate moved upwards and sodium moved downwards during EK application. The application of irrigation and fertigation buffered the effects of EK on pH and EC. Periods of drainage also allowed for redistribution within the column by both diffusion and hydraulic movement under gravity. However, the dynamic responses and time-lag associated with changes at each depth in the root zone make it difficult to identify optimal management strategies. Hence, a numerical model incorporating the effect of both soil-water movement and EK on the movement and distribution of ions would be beneficial.
Certification of Thesis
This thesis is entirely the work of Jamal Mohamed Fernana except where otherwise acknowledged. The work is original and has not previously been submitted for any other award, except where acknowledged.
Student and supervisors signatures of endorsement are held at USQ.
Professor Steven Raine Principal Supervisor
Dr John Bennett Associate Supervisor
Acknowledgment
IV
Acknowledgments
First and foremost, I am very thankful to ALLAH for all his bounties and blessings, for giving me the ability to complete this study. Without him none of this work would have been possible.
I express my appreciation and thanks to my principal supervisor Professor Steven Raine for his scientific and personal guidance and suggestions. I greatly admire his capabilities of quick assessment, which greatly benefited me in writing and laboratory related issues.
I also express my sincere gratitude to my co-supervisor Dr John Bennett for his constant support, availability and constructive suggestions, which were helpful for the accomplishment of work presented in this thesis.
Special thanks to Dr Duc Cong for his support in developing the numerical model. I am also thankful to Dr. Tony Ahfock for his scientific support and help.
I would also like to express my gratitude to the National Centre for Engineering and Agriculture (NCEA) at the University of Southern Queensland (USQ) and its staff for providing the necessary equipment and technical support for this research.
I express my thanks to Dr Dio Antille for his great assistance.I am also grateful to the lovely staff in the Faculty of Health, Engineering and Sciences at USQ. A special thanks to Dr Friederike Eberhard and Dr Raed Ahmed for their support in the Waste Water Laboratory.
To Tripoli University and the Libyan Government, I would like to express my gratitude for providing funding for a full scholarship and the Australian Government Research Training Scheme (RTS) for covering the tuition fees of the final semester.
Table of content
V
Table of Contents
Abstract I
1 Chapter 1: Introduction ... 1
1.1 Background ... 1
Overview of research ... 2
1.2.1 Research hypotheses ... 2
1.2.2 Specific objectives of research ... 3
Structure of dissertation ... 3
2 Chapter 2: Literature Review ... 5
Introduction ... 5
Irrigation water quality ... 5
2.2.1 Salinity ... 5
2.2.2 Sodicity ... 6
2.2.3 Acidity and Alkalinity ... 7
Soil-water potential ... 7
Plant salt tolerance ... 8
Effects of salinity stress on plant growth ... 9
Traditional management of irrigation with saline-sodic water ... 10
Application of electric field to soils ... 10
2.6.1 Electrolysis ... 11
2.6.2 Electro-osmosis ... 11
2.6.3 Electro-migration ... 12
2.6.4 Diffusion ... 13
2.6.5 Electrophoresis ... 14
2.6.6 Other effects associated with applying an electric field in soil ... 14
Applications of electro-kinesis in soil... 14
Nitrate maintenance by electro-kinesis ... 16
Conclusions and implications for managing EK with irrigation ... 16
3 Chapter 3: General Methodology ... 18
Introduction ... 18
Soil and column preparation ... 18
Preparation of the salt solutions and application of water to the sand columns ………..20
Application of the electro-kinetic field ... 21
Table of content
VI
4 Chapter 4: A preliminary evaluation of using electro-kinesis to control salt
movement in an irrigated sand column ... 23
Introduction ... 23
Materials and methods ... 23
Results ... 25
4.3.1 Effect of electrode separation distance ... 25
4.3.2 Effect of current strength application rate ... 35
Discussion ... 42
Conclusion ... 44
5 Chapter 5: An evaluation of the potential to use electro-kinesis for controlling nitrate movement in an irrigated sand column ... 45
Introduction ... 45
Material and methods ... 45
Results ... 46
5.3.1 Solute dynamics due to the rate and duration of EK application ... 46
5.3.2 Effect of electro-kinesis and irrigation interactions on solute dynamics ………...48
Discussion ... 56
5.4.1 Effect of EK application rate on nitrate movement ... 56
5.4.2 Implications for the management of nitrate in irrigated root zones using EK ………...57
Conclusion ... 58
6 Chapter 6: Using electro-kinesis to manage sodium and nitrate movement in a sand column irrigated with saline-sodic water... 60
Introduction ... 60
Methodology ... 60
Results ... 61
6.3.1 Simultaneous movement of nitrate and sodium using EK ... 61
6.3.2 Movement of nitrate and sodium with sequential EK, irrigation and fertigation applications ... 65
Discussion ... 67
6.4.1 Using EK to simultaneously maintain nitrate and remove sodium from saline-sodic root zones ... 67
6.4.2 The effect of sequential EK, irrigation and fertigation applications on nitrate and sodium movement ... 68
Conclusion ... 69
7 Chapter 7: Development of a numerical model to predict nitrate and salt movement in soil columns due to electro-kinesis and irrigation applications ... 71
Table of content
VII
Development of the Diffusion Convection Electro-osmosis Electro-migration
Model (DCEEM) ... 71
7.2.1 Soil and Electric Parameters used in DCEEM ... 72
7.2.2 Model limitations ... 74
Materials and Methods ... 74
7.3.1 Model validation experimental design ... 74
7.3.2 Demonstration of model operation ... 75
Results and discussion ... 76
7.4.1 Validation of the DCEEM model ... 76
7.4.2 Using DCEEM to demonstrate the effect of EK and irrigation on nitrate and solute distribution within the sand columns ... 79
Conclusion ... 87
8 Chapter 8: Conclusion and Recommendations ... 88
Introduction ... 88
Review of research ... 88
General conclusion... 89
8.3.1 Efficacy of EK to control sodium distribution and nitrate retention within root zones ... 89
8.3.2 Simultaneously managing sodium and nitrate for systems subject to irrigation and EK ... 90
8.3.3 Predicting solute dynamics and informing best management with EK 90 Recommendations for further research ... 90
8.4.1 Experimental and mechanistic aspects that require further investigation ………..90
8.4.2 Model limitations and improvements ... 92
References ... 94
1. Appendix A DCEEM description and numerical details ... 102
A.1 Electrical equations ... 102
A.2 An electrical model to determine average anionic and cationic mobilities 103 A.3 Governing equation for fluid movement in soil ... 107
A.4 Governing equation for solute transport in soil ... 108
List of Figures
VIII
List of Figures
Figure 1-1 Outline of dissertation structure ... 4 Figure 2-1: Effect of irrigation water SAR and EC on the stability of soil structure
(ANZECC 2000 from DNR 1997a) ... 7 Figure 2-2: Salt tolerance of different crops (Munns & Tester 2008) ... 9 Figure 2-3: The processes occurring in electrokinetic remediation (Leinz et al. 1998) ... 11 Figure 2-4 : The migration of ions across the soil to opposed charged electrode under
an electric field (Acar et al. 1995). ... 13 Figure 2-5: Concept sketch describing the application of EK as a remediation system
in a contaminated site (Reddy & Cameselle 2009). ... 14 Figure 3-1: Sand columns mounted in wooden frame and attached to the EK equipment
within the electrically isolated wooden cupboard. Insert shows electrodes mounted inside PVC piping ... 19 Figure 3-2: The application of the vacuum to the porous soil solution extraction tubes
by extending the syringe plungers and holding the plungers in place with black plastic blocks ... 20 Figure 3-3: Configuration of the irrigation system apparatus ... 21 Figure 4-1: Solution EC in 30 cm columns where EK was applied at 0.01 A for (a) 24
h, (b) 48 h, (c) 72 h, (d) 96 h, (e) 120 h, (f) 144 h, (g) 168 h. Graph (h) shows the effect of EK application time. Horizontal and vertical bars show LSD0.05. ... 26 Figure 4-2: Solution EC in 50 cm columns where EK was applied at 0.01 A for (a) 24
h, (b) 48 h, (c) 72 h, (d) 96 h, (e) 120 h, (f) 144 h, (g) 168 h. Graph (h) shows the effect of EK application time. Horizontal and vertical bars show LSD0.05. ... 27 Figure 4-3: Effect of 0.01A EK application on solution pH in a 30 cm column after (a)
24 h, (b) 48 h, (c) 72 h, (d) 96 h, (e) 120 h, (f) 144 h, (g) 168 h. Graph (h) shows the effect of EK application time. Horizontal and vertical bars show LSD0.05. 28 Figure 4-4: Effect of 0.01A EK application on solution pH in a 50 cm column after (a)
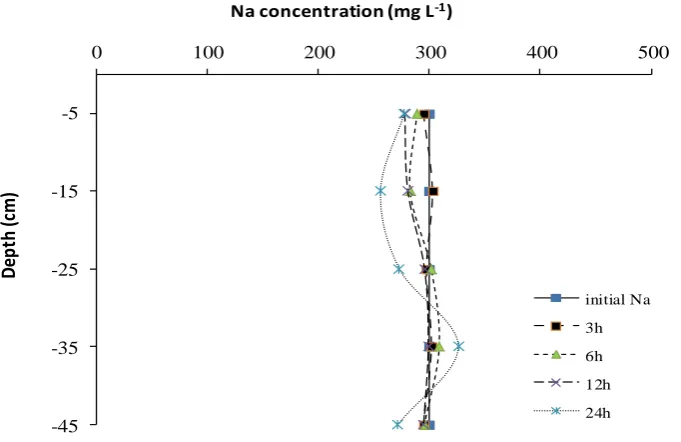
24 h, (b) 48 h, (c) 72 h, (d) 96 h, (e) 120 h, (f) 144 h, (g) 168 h. Graph (h) shows the effect of EK application time. Horizontal and vertical bars show LSD0.05. 29 Figure 4-5: Solution sodium concentration [Na] in 30 cm columns where EK was
applied at 0.01 A for (a) 24 h, (b) 48 h, (c) 72 h, (d) 96 h, (e) 120 h, (f) 144 h, (g) 168 h. Graph (h) shows the effect of EK application time. Horizontal and vertical bars show LSD0.05. ... 31 Figure 4-6: Solution sodium concentration [Na] in 50 cm columns where EK was
applied at 0.01 A for (a) 24 h, (b) 48 h, (c) 72 h, (d) 96 h, (e) 120 h, (f) 144 h, (g) 168 h. Graph (h) shows the effect of EK application time. Horizontal and vertical bars show LSD0.05. ... 32 Figure 4-7: Solution chloride concentration [Cl] in 30 cm columns where EK was
applied at 0.01 A for (a) 24 h, (b) 48 h, (c) 72 h, (d) 96 h, (e) 120 h, (f) 144 h, (g) 168 h. Graph (h) shows the effect of EK application time. Horizontal and vertical bars show LSD0.05. ... 33 Figure 4-8: Solution chloride concentration [Cl] in 30 cm columns where EK was
applied at 0.01 A for (a) 24 h, (b) 48 h, (c) 72 h, (d) 96 h, (e) 120 h, (f) 144 h, (g) 168 h. Graph (h) shows the effect of EK application time. Horizontal and vertical bars show LSD0.05. ... 34 Figure 4-9: Effect of 0.01A EK application on gravimetric water content in (a) 30 cm
List of Figures
IX
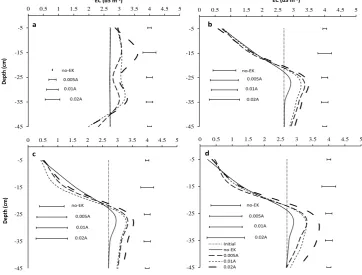
Figure 4-10: Solution electrical conductivity (EC) in 50 cm columns where EK applied at either 0.01A or 0.02 A for (a) 24 h, (b) 48 h, (c) 72 h, (d) 96 h, (e) 120 h, (f) 144 h, (g) 168 h. Bars at the right of graph are LSD (α=0.05) for comparing EC between treatments. Bars at the left of graph are LSD (α=0.05) for comparing within treatments. ... 37 Figure 4-11: Solution pH in 50 cm columns where EK applied at either 0.01A or 0.02
A for (a) 24 h, (b) 48 h, (c) 72 h, (d) 96 h, (e) 120 h, (f) 144 h, (g) 168 h. Bars at the right of graph are LSD (α=0.05) for comparing pH between treatments. Bars at the left of graph are LSD (α=0.05) for comparing within treatments. ... 38 Figure 4-12: Solution sodium concentration in 50 cm columns with EK applied at
0.01A or 0.02 A for: (a) 24 h, (b) 48 h, (c) 72 h, (d) 96 h, (e) 120 h, (f) 144 h and (g) 168 h. Bars at the right of graph are LSD (α=0.05) for comparing [Na] between treatments. Bars at the left of graph are LSD (α=0.05) for comparing within treatments. ... 40 Figure 4-13: Solution chloride concentration in 50 cm columns with EK applied at
0.01A or 0.02 A for: (a) 24 h, (b) 48 h, (c) 72 h, (d) 96 h, (e) 120 h, (f) 144 h and (g) 168 h. Bars at the right of graph are LSD (α=0.05) for comparing between treatments. Bars at the left of graph are LSD (α=0.05) for comparing within treatments. ... 41 Figure 4-14: Effect of EK application rate on the gravimetric water content in a 50 cm
column irrigated with saline-sodic water after EK applied for 168 h. Bars at the right of graph are LSD (α=0.05) for comparing the water content between treatments. ... 42 Figure 5-1: Nitrate concentration with depth after application of EK treatments and a
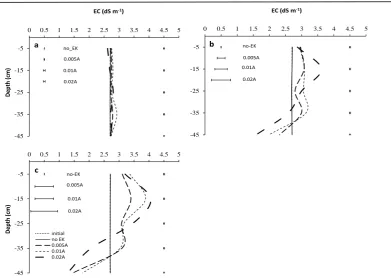
non-EK (control) treatment for: (a) 3 h, (b) 9 h, and (c) 24 h. Bars at the right of graph are LSD (α=0.05) comparing results between treatments at each depth. Bars at the left of graph are LSD (α=0.05) to compare within treatments. ... 47 Figure 5-2: Electric conductivity (EC) with depth after application of EK treatments
and a non-EK (control) treatment for: (a) 3 h, (b) 9 h, and (c) 24 h. Bars at the right of graph are LSD (α=0.05) comparing results between treatments at each depth. Bars at the left of graph are LSD (α=0.05) to compare within treatments. ... 48 Figure 5-3: pH with depth after application of EK treatments and a non-EK (control)
treatment for: (a) 3 h, (b) 9 h, and (c) 24 h. Bars at the right of graph are LSD (α=0.05) comparing results between treatments at each depth. Bars at the left of graph are LSD (α=0.05) to compare within treatments. ... 48 Figure 5-4: Nitrate concentration with depth after application of EK for 3 h on columns
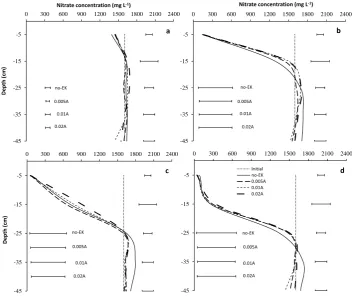
irrigated at either: a) 0, b) 10, c) 20 and d) 30 mL h-1. Bars at the right of graph are LSD (α=0.05) comparing results between treatments at each depth. Bars at the left of graph are LSD (α=0.05) to compare within treatments. ... 49 Figure 5-5: Nitrate concentration with depth after application of EK for 9 h on columns
irrigated at either: a) 0, b) 10, c) 20 and d) 30 mL h-1. Bars at the right of graph are LSD (α=0.05) comparing results between treatments at each depth. Bars at the left of graph are LSD (α=0.05) to compare within treatments ... 50 Figure 5-6: Nitrate concentration with depth after application of EK for 24 hours on
List of Figures
X
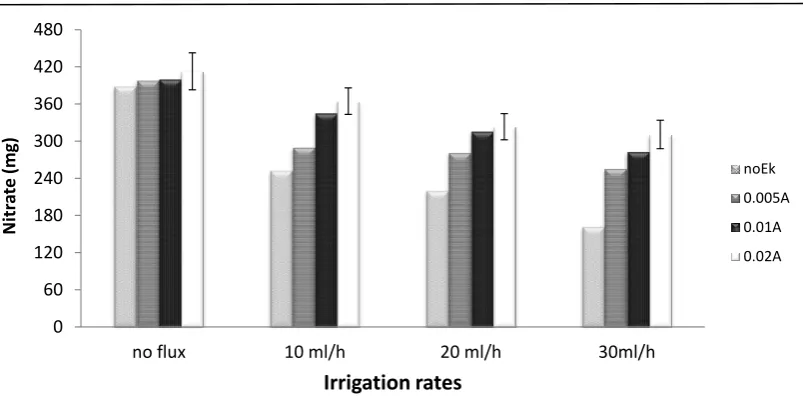
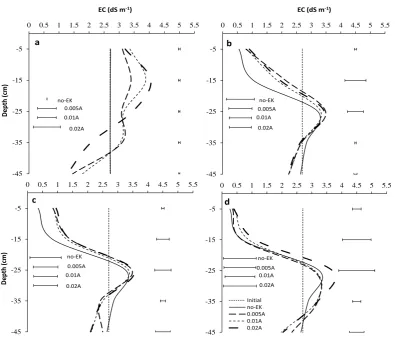
Figure 5-7: Total amount of nitrate in solution extracted from the 0-25 cm depth of the sand columns after application of the irrigation and EK treatments. ... 52 Figure 5-8: EC after application of EK for 3 h on columns irrigated with: (a) 0, (b) 10,
c) 20 and (d) 30 mL h-1. Bars at the right of graph are LSD (α=0.05) comparing results between treatments at each depth. Bars at the left of graph are LSD (α=0.05) to compare within treatments... 53 Figure 5-9: EC after application of EK for 9 h on columns irrigated with: (a) 0, (b) 10,
(c) 20 and (d) 30 mL h-1. Bars at the right of graph are LSD (α=0.05) comparing results between treatments at each depth. Bars at the left of graph are LSD (α=0.05) to compare within treatments... 53 Figure 5-10: EC after application of EK for 24 h on columns irrigated for 9 h with: (a)
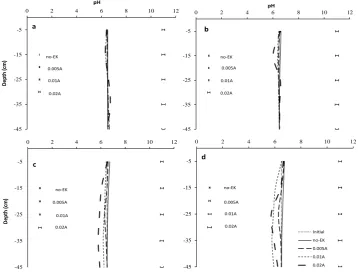
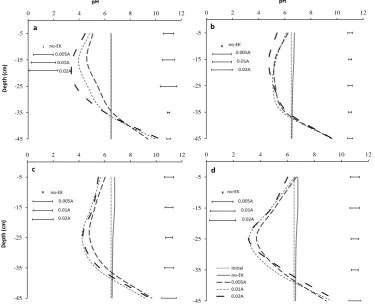
0, (b) 10, (c) 20 and (d) 30 mL h-1. Bars at the right of graph are LSD (α=0.05) comparing results between treatments at each depth. Bars at the left of graph are LSD (α=0.05) to compare within treatments. ... 54 Figure 5-11: pH after application of EK for 3 h on columns irrigated with: (a) 0, (b)
10, (c) 20 and (d) 30 mL h-1. Bars at the right of graph are LSD (α=0.05) comparing results between treatments at each depth. Bars at the left of graph are LSD (α=0.05) to compare within treatments ... 55 Figure 5-12: pH after application of EK for 9 h on columns irrigated with: (a) 0, (b)
10, (c) 20 and (d) 30 mL h-1. Bars at the right of graph are LSD (α=0.05) comparing results between treatments at each depth. Bars at the left of graph are LSD (α=0.05) to compare within treatments ... 55 Figure 5-13: pH after application of EK for 24 h on columns irrigated for 9 h with: (a)
0, (b) 10, (c) 20 and (d) 30 mL h-1. Bars at the right of graph are LSD (α=0.05) comparing results between treatments at each depth. Bars at the left of graph are LSD (α=0.05) to compare within treatments ... 56 Figure 6-1: The effect of applying 0.01A EK on nitrate concentration in a sand column ... 63 Figure 6-2: The effect of applying 0.01A EK on sodium concentration in a sand
column ... 63 Figure 6-3: The effect of applying 0.01A EK on electrical conductivity in a sand
column ... 64 Figure 6-4: The effect of applying 0.01A EK on soil solution pH in a sand column 64 Figure 6-5: Variation in nitrate concentration within a sand column with sequential
applications of EK, irrigation and fertigation treatments. ... 66 Figure 6-6: Variation in sodium concentration within a sand column with sequential
applications of EK, irrigation and fertigation treatments ... 66 Figure 6-7: Variation in EC within a sand column with sequential applications of EK,
irrigation and fertigation treatments. ... 67 Figure 6-8: Variation in pH within a sand column with sequential applications of EK,
irrigation and fertigation treatments. ... 67 Figure 7-1: Flowchart of DCEEM model ... 73 Figure 7-2: Sequence of EK and irrigation management options simulated to
demonstrate the DCEEM model capability ... 75 Figure 7-3: The predicted volumetric water content by the DCEEM compared with the
measured data after 6 hours of case1 ... 76 Figure 7-4: The variation in the predicted EC by the DCEEM compared with the
measured data after 6 hours of case2. ... 77 Figure 7-5: The predicted volumetric water content by the DCEEM compared with the
List of Figures
XI
Figure 7-6: The variation in the predicted EC by the DCEEM compared with the measured data after 6 hours of case3 ... 78 Figure 7-7: The predicted volumetric water content by the DCEEM compared with the
measured data after 6 hours of case3. ... 78 Figure 7-8: The predicted EC with depth from running the DCEEM model to simulate
applying 9 h irrigation at rate of 20 mL h-1 without applying EK ... 80 Figure 7-9: The predicted EC values with depth from running the DCEEM model to
simulate applying EK for: (a) 3h, (b) 4h, (c)5h and (d)6h after 9h irrigation. 80 Figure 7-10: The predicted nitrate concentration with depth from running the DCEEM
model 9 h 20 mL h-1 of irrigation without applying EK ... 81 Figure 7-11: The predicted nitrate concentration with depth from running the DCEEM
model to simulate applying EK for: (a) 3h, (b) 4h, (c)5h and (d)6h after 9h irrigation. ... 81 Figure 7-12: Volumetric water content with depth from running the DCEEM model 9
h 20 mL h-1 of irrigation without applying EK ... 82 Figure 7-13: Volumetric water content with depth from running the DCEEM model to
simulate applying EK for: (a) 3h, (b) 4h, (c)5h and (d)6h after 9h irrigation . 82 Figure 7-14: Effect of sequential periods of no-EK (i.e. drainage) and irrigation
applications on nitrate concentrations predicted by DCEEM within a sand column ... 84 Figure 7-15: Effect of sequential EK and irrigation applications on nitrate
concentrations predicted by DCEEM within a sand column ... 84 Figure 7-16: Total amount of nitrate in the 0-30 cm layer of the sand columns after the
sequential applications of the EK, no-EK and irrigation treatments. ... 84 Figure 7-17: Effect of sequential periods of no-EK (i.e. drainage) and irrigation
applications on EC predicted by DCEEM within a sand column. ... 85 Figure 7-18: Effect of sequential EK and irrigation applications on EC predicted by
DCEEM within a sand column ... 85 Figure 7-19: Effect of sequential periods of no-EK (i.e. drainage) and irrigation
applications on soil water content predicted by DCEEM within a sand column ... 86 Figure 7-20: Effect of sequential EK and irrigation applications on soil water content
List of Tables
XII List of Tables
Table 2-1: General guidelines for salinity of irrigation water (ANZECC 2000 adapted
from DNR 1997b) ... 6
Table 2-2: Soil type and average root zone leaching fraction (ANZECC 2000) from (DNR 1997a) ... 10
Table 3-1: Selected properties of the washed sand ... 18
Table 4-1: Experimental treatments ... 24
Table 4-2: Irrigation water quality ... 24
Table 5-1: The cumulative volume of leachate and concentration of nitrate over the 24 treatment period ... 49
Table 6-1: Saline-sodic solution... 61
Table 6-2: The treatment schedule applied to the sand column over a 48 hour period ... 61
Table 7-1: The DCEEM parameters ... 74
List of Symbols
XIII
List of symbols and abbreviations
A Cross-sectional area of soil tube (m2)
C Concentration of ions in (mol L-1) or (C m-3)
CEC Cation exchange capacity (cmolc kg-1) Ci Concentration of species i (moles m-3)
D Dielectric constant of the pore fluid (F m-1)
D* Diffusion coefficient (m2 s-1)
Deff Effective diffusion coefficient in soil (m2 s-1)
E Electric field gradient (V m)
ɛ Soil electrical permittivity(C2 N-1.m-2) EC Electrical conductivity (dS m-1)
ECiw Electrical conductivity of irrigation water(dS m-1)
ESP Exchangeable sodium percentage
F Faraday constant (C mol-1)
H Hydraulic head gradient
H+ Hydrogen ion
I Current through soil column(A)
J Current density(A m-2)
Jd Ion flux due to diffusion(mol m-2. s-1)
Ji Total Flow rate of specific ion(mol m-2.s-1)
Jm Migration flux of salt ions(mol m-2.s-1)
Ke Coefficient of electro-osmosis permeability(m2 V-1.s-1) Kh Hydraulic conductivity(m s-1)
LSD Least significant difference
List of Symbols
XIV
Qe Water flow rate(m3s-1)
Qw Electro-osmosis flow rate(m3 s-1)
R2 Coefficient of Determination
SAR Sodium adsorption ratio
ζ Zeta potential(V)
η Viscosity of the pore fluid(N.s m-2)
µ Mobility of ions in the electrolyte solution(m2 V-1.s-1)
Chapter 1: Introduction
1
1
Chapter 1: Introduction
1.1 Background
The need for increased food production is important due to the growing world population. For example, to maintain food supply at the current level, global food production needs to increase by 38% by 2025 and by 57% by 2050 (Wild 2003). Irrigation has played a major role in supporting agricultural production, particularly in arid and semiarid regions of world, and this role is likely to become more important as the demand for food increases. However, there is a growing shortage of suitable water for agriculture due to environmental requirements, increased variability and changes in rainfall, as well as the increasing and competitive demand for water by urban and non-agricultural industries. Hence, the focus has shifted towards exploring the feasibility of alternative sources of irrigation water. More recently, marginal quality water such as saline-sodic groundwater and industrial effluent has been used for irrigation (Fereres & Soriano 2007; Pereira et al. 2002).
Long-term use of untreated saline–sodic water for irrigation may adversely affect soil properties and crop yields (Bajwa & Josan 1989; Ezlit 2009; Manchanda et al. 1982). However, irrigation using marginally saline-sodic water when managed on a soil specific basis is feasible (Bennett 2011; Bennett & Raine 2012a; Chi et al. 2012; Ezlit et al. 2013; Quirk & Schofield 1955). Where the application of saline-sodic irrigation water is not managed, or incorrectly managed, negative impacts on soil productivity and soil structural integrity occur due to sodification (So & Aylmore 1993; Sumner 1993). Salinisation may also decrease plant water uptake due to an osmotic effect, although this same effect may stabilise soil structure, even where sodic (Ayers & Westcot 1985; Brinck & Frost 2009; Cucci et al. 2015; Mamedov & I 2014).
Excessive soluble salts and sodium concentrations in the soil solution may also cause osmotic stress and specific ion toxicity which influence the plants’ uptake of nutrients (Alharby et al. 2014). In particular, soil salinity may affect crop total nitrogen uptake and has a negative effect on biological activity and the nitrogen balance in the soil (Van Hoorn et al. 2001; Vaughan & Letey 2015).
Increasing the sodium concentration within the root zone may produce indirect impacts on plant growth due to its effect on soil structure, density and soil water relations resulting in low plant available water capacity and hydraulic conductivity (Ezlit et al. 2010; Vance et al. 2008). However, these impacts can be alleviated by improvements in land and water management (Tavakkoli et al. 2010).
Chapter 1: Introduction
2
EK has been used to extract heavy metals, organic compounds and remove inorganic matter from soils. For example, Van Doren and Bruell (1987) investigated the use of an electrical treatment to remove benzene from a water saturated clay with low hydraulic conductivity. This study showed that the benzene was completely removed from the clay after two weeks of the electrical treatment. Similarly, Acar et al. (1994) showed that approximately 90-95 % of cadmium (II) in a saturated kaolinite could be removed by EK. Furthermore, Kim et al. (2001) investigated EK as a remediation method to remove lead (Pb) and cadmium (Cd) contaminants from kaolinite and a tailing-soil. They found that approximately 75-85% of both Pb and Cd were removed from the kaolinite and 50-70% from the tailing-soil after application of EK for 4 days. Jeon et al. (2015) investigated the potential for an in situ EK system to remove arsenic (As), copper (Cu) and Pb from a contaminated paddy rice field. They found that approximately 44% of the As, 40% of the Cu and 47% of the Pb were removed from the soil after 24 weeks of applying EK.
The ability of EK to control nitrate movement has also been studied. In a lysimeter test, Cairo et al. (1996) evaluated the effect of using EK to concentrate and remove nitrate from soil using horizontal drainage tubing and parallel electrodes. After applying a small electrical current to a saturated soil, the nitrate concentration was found to increase towards the cathode due to a hydraulic effect. However, in an unsaturated soil, the nitrate was found to migrate towards the anode. Eid et al. (2000) evaluated the ability of EK to maintain nitrate near the anode in a saturated sandy soil under both closed and open system conditions. In both systems, the nitrate was concentrated and retained near the anode. Jia et al. (2006) studied the effect of applying an electrical current to control nitrate movement and pH changes in a vertical column of partially saturated sandy soil. They found that the highest nitrate concentration was recorded within 5 mm of the anode when 80 mA current was applied for 6 hours while the lowest concentration was measured near the cathode. Significant pH changes were also observed with the lowest pH (pH=3.5) measured at the anode and the highest (pH=11) measured at the cathode.
Researchers (e.g. Choi et al. 2009; Eid et al. 2000; Jia et al. 2005) have studied the potential to use EK to either remove salts from the root zone or to control nitrate movement under a narrow range of` soil conditions. However, there is a lack of data on the ability to simultaneously control salt and nitrate movement in soil using EK and insufficient evidence to understand the soil, water and management conditions under which EK may be usefully applied to improve root zone management.
EK has the potential to improve the management of salt and nitrogen within irrigated root zones, particularly where saline water is applied. However, to enable this technique is to be effectively deployed and managed in a commercial irrigation system there is a need to develop appropriate EK management strategies to maintain nitrate and minimise salt concentrations within the root zone. Hence, this research will evaluate under laboratory conditions, the potential for EK to assist in managing salinity and nitrate movement in soils irrigated with saline water.
Overview of research
1.2.1 Research hypotheses
Chapter 1: Introduction
3
Excess salts contained within irrigation water or the soil can be removed from the root zone by application of electro-kinesis.
Electro-kinesis can be used to manage the movement of nitrate (NO3-) within the root zone.
Electro-kinesis can be used to simultaneously improve nitrate retention and salt drainage in a sandy soil irrigated with saline-sodic water.
Options for using EK and irrigation applications to control salt and nitrate movement can be evaluated by using a soil-water model incorporating EK.
1.2.2 Specific objectives of research
This project aims to evaluate the potential use of electro-kinesis as a management strategy for controlling nitrate movement and reducing the impact of saline-sodic irrigation water within a root zone. The main objectives of this research are:
Evaluate the efficacy of using electro-kinesis to increase salt drainage from an irrigated sand column
Evaluate the potential use of electro-kinesis to retain nitrate within an irrigated sand column.
Evaluate the use of EK to simultaneously manage nitrate retention and salt drainage in an irrigated system with saline-sodic water applied.
Develop a combined soil-water and EK model and use the model to demonstrate the effect of management variables on the ability to control nitrate and salt movement in an irrigated soil.
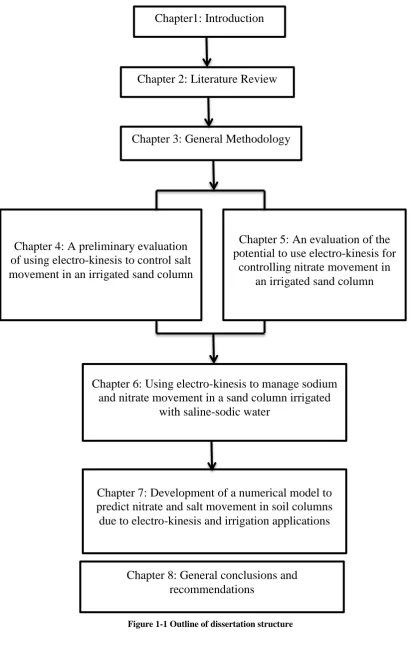
Structure of dissertation
This dissertation contains eight chapters (Figure 1.1). Chapter 2 provides a brief review of the effects of irrigation with saline-sodic water on soil properties and plant growth. It also provides a general review of electro-kinesis processes, theories and applications, including the effects of EK on ion movement in soils.
Chapter 1: Introduction
[image:20.595.108.520.68.725.2]4
Figure 1-1 Outline of dissertation structure
Chapter1: Introduction
Chapter 2: Literature Review
Chapter 3: General Methodology
Chapter 4: A preliminary evaluation of using electro-kinesis to control salt movement in an irrigated sand column
Chapter 5: An evaluation of the potential to use electro-kinesis for
controlling nitrate movement in an irrigated sand column
Chapter 6: Using electro-kinesis to manage sodium and nitrate movement in a sand column irrigated
with saline-sodic water
Chapter 8: General conclusions and recommendations
Chapter 2: Literature Review
5
2
Chapter 2: Literature Review
Introduction
This chapter describes specific impacts related to the use of saline-sodic water on irrigated soil and plant growth. It also provides a general review of the electro-kinesis processes, theories and applications, as well as the justification for undertaking this research. Section 2.2 discusses water quality and the problems associated with the use of low quality (saline-sodic) water on irrigated soil. Section 2.3 provides brief information on soil-water potential. The plant salt tolerance is discussed in section 2.4. Section 2.5 provides concise discussion regarding to traditional management of irrigation with saline-sodic water. Section 2.6 presents the electro-kinesis (EK) processes and theories including the use of EK to remove contaminates from a soil, and introduces the potential application of EK in agriculture as a soil management method for removing excess salts and maintaining nitrate in the root zone.
Irrigation water quality
Water used for irrigation always includes different dissolved salts (Ayers & Westcot 1985). The types and amounts of salt in the water may lead to negative impacts on both crop yield and soil properties. Increasing the salt concentration in soil solution affects plant water uptake due to the changes in soil water potential (i.e. osmotic potential) (Hadas 1976). Therefore, water quality is a major factor when determining the suitability of water for use in irrigation. The basic criteria need to categorise water for irrigation include: (1) water salinity or total dissolved salt (TDS); (2) Sodium Adsorption Ratio (SAR); (3) acidity (pH) and alkalinity (i.e. carbonate and bicarbonate), and; (4) the concentration of elements toxic to plant growth (Bauder et al. 2011).
2.2.1 Salinity
Salinity has been defined as the sum of mass concentration of dissolved ions in the water (Burger & Celkova 2003). The major dissolved inorganic ions in water are generally Na+, Ca2+, Mg2+, K+, HCO3-, SO42- and Cl-. The total dissolved salt (TDS) in irrigation water is often assessed by measuring its electrical conductance (EC) and the common units used are mS/cm, dS/m or µS/cm. The salinity of the applied irrigation water affects the soil salinity.
Chapter 2: Literature Review
6
Table 2-1: General guidelines for salinity of irrigation water (ANZECC 2000 adapted from DNR 1997b)
2.2.2 Sodicity
Sodicity, also known as the sodium adsorption ratio (SAR), is the most common quality factor used to determine the sustainable use of irrigation water particularly on clay soils. The SAR value of irrigation water quantifies the relative concentration of sodium (Na+) to calcium (Ca2+) and magnesium (Mg2+)(Ayers & Westcot 1985):
𝑺𝑨𝑹 = ⌊𝑵𝒂+⌋
√[𝑪𝒂+𝟐]+[𝑴𝒈+𝟐] 𝟐
Equation 2-1
where [Na+], [Ca2+] and [Mg2+] are expressed in mmole
c /litre (ANZECC 2000). The stability of clay soils is affected by the interaction of the ECi and SAR. A generalised relationship is shown in Figure 2-1 (ANZECC 2000).
High levels of SAR in irrigation water result in an increase in the soil sodium level, known as the Exchangeable Sodium Percentage (ESP). ESP is defined as the ratio of exchangeable sodium percentage (cmolc kg-1) to the total cation exchange capacity of the soil CEC (cmolc kg-1). The ESP is calculated as:
𝑬𝑺𝑷 =𝐍𝐚×𝟏𝟎𝟎𝐂𝐄𝐂
Equation 2-2
where Na is concentration of sodium (cmolc kg-1) in soil, and CEC is the cation exchangeable capacity (cmolc kg-1).
Chapter 2: Literature Review
7
Figure 2-1: Effect of irrigation water SAR and EC on the stability of soil structure (ANZECC 2000 from DNR 1997a)
There is close relationship between SAR of irrigation water and the resulting ESP. Therefore, the ESP can be calculated from SAR (Richards 1954).
Equation 2-3
2.2.3 Acidity and Alkalinity
The term pH, which is the negative log of the concentration of hydrogen ions, refers to acidity and alkalinity of irrigation water. The range of pH value has been divided into three parts: acid (pH˂7); neutral (pH=7) and; alkaline (pH˃7). The typical value of pH for irrigation water is from 6.5 to 8.4 (Bauder et al. 2011). The pH has significant impact on plant nutrition due to its effect on nutrient availability (Tu & Ma 2003). Values of pH that are higher than 8.5 are often caused by high bicarbonate (HCO3-) and carbonate (CO32-) concentrations. High concentrations of carbonate ions create insoluble salts from calcium and magnesium ions leading to a proportionally higher sodium concentration (i.e. SAR) in the soil solution (Bauder et al. 2011). The higher
SAR may influence crop yield and soil properties (Section 2.2.2).
Soil-water potential
Soil provides plants with nutrients, water and air. The plant availability of water in the soil is controlled by two important characteristics; the amount of water in the soil and the forces holding the water in the soil. Generally, the amount of water in soil has an impact on many processes in the soil such as gas exchangeable, the movement of nutrients to plant roots, soil temperature and water absorption (Jury 2004). Furthermore, water potential also plays a major role in water flow within the soil. Therefore, investigating water potential and water content is very important to improve understanding of the soil-plant-water relationship.
) 01475 . 0 0126 . 0 ( 1
) 01475 . 0 0126 . 0 ( 100
SAR SAR ESP
Chapter 2: Literature Review
8
The term water potential (ψw) is defined as the amount of energy required to move the unit of water in the soil-water equilibrium system to a reference point at same temperature (Hanks & Ashcroft 1980). Under equilibrium conditions, water moves from the point that has high total water potential to the point that has low total water potential (Hanks & Ashcroft 1980). Total water potential includes gravitational potential (ψz), matric potential (ψm), solute potential (ψs) and pressure potential (ψp).
ψw = ψz + ψp + ψm+ ψs Equation 2-4
where:
Gravitational potential (ψz) is defined as the difference in elevation of an infinitesimal amount of pure and free water and the reference point to the soil water (Hanks & Ashcroft 1980; Jury 2004);
Matric potential (ψm) is formally defined as the energy per unit volume of water needed to transfer a small amount of water from a reference soil-water pool to any selected point in the soil at reference air pressure(Jury 2004)
Solute potential (ψs) is ‘the change in energy per unit volume of water when solutes identical in composition to the soil solution at the point of interest in the soil added to pure, free water at the elevation of the soil’ (Jury 2004, p. 54).
Pressure potential (ψp) is defined as the water pressure applied by saturated water on the selected point in the soil (Jury 2004).
Plant salt tolerance
Salt tolerance is defined as the plant’s ability to survive and provide economic production under a salinity stress (Bresler 1982). Salinity influences plant growth and yield through both osmotic and toxic (specific ion) effect. Therefore, plants have evolved several of biochemical and molecular strategies either to exclude salt from their cells or to tolerate its presence inside the cells (Ingram & Bartels 1996). Some of these strategies are selection or exclusion of ions, control of ion uptake by roots, synthesis of compatible solutes and induction of anti-oxidative enzymes (Parida & Das 2005).
The general salt tolerance of crops has been outlined by Maas, E. and Hoffman, G. (1977), who described crop salt tolerance as a linear function of the yield reduction with increasing soil salinity. Most plants can exclude Na+ and Cl− effectively via roots while water is absorbed from the soil (Munns 2005). Halophytes have the ability to maintain this exclusion at higher salinities than glycophytes. For example, sea barley grass, Hordeum marinum, can exclude Na+ and Cl− up to least 450 mM NaCl (Garthwaite et al. 2005). In arid and semiarid lands, plant water uptake may suffer from drought as well as the low soil water potential caused by salinity. Therefore, these plants have evolved mechanisms to tolerate the effect of water stress.
Chapter 2: Literature Review
9
Figure 2-2: Salt tolerance of different crops (Munns & Tester 2008)
Effects of salinity stress on plant growth
Irrigation with saline-sodic water leads to the risk of salt accumulation in the root zone reducing plant growth and yield due to the reduction of soil water potential causing osmotic stress and leading to ion specific toxicities (Asgari et al. 2012; Chinnusamy et al. 2005). Munns and Tester (2008) note that both sodium (Na+) and chloride (Cl-) may be responsible for osmotic and toxic effects, which lead to a significant reduction in crop growth. In addition, irrigation with saline-sodic water may also affect the soil physical properties (i.e. soil structure) with a resultant impact on plant growth by influencing root distribution and the efficiency to take up water and nutrients (Blum & Rampazzo 1993).
a. Osmotic stress
The effect of osmotic stress is similar to the stress caused by drought. Plants under saline stress use energy required for other physiological processes to extract water from the soil (Katerji et al. 2003). While crops can tolerate low salt concentrations in the root zone, a concentration in the soil solution that exceeds the crop threshold impacts on plant growth and yield (Maas, E. & Hoffman, G. 1977). The reduction in crop water uptake reduces the movement of water and ions towards the root surface. This may also reduce the rate of nutrient movement towards the root and impact on nutrient uptake. Thus, osmotic stress impacts negatively on plant growth rate and water and nutrient uptake (Munns & Tester 2008).
Sa
lin
ity
tol
er
an
ce
(ch
an
ge
s
in
d
ry
m
at
te
r
as
%
con
tr
ol
Chapter 2: Literature Review
10
b. Specific Ion Effect
Specific elements (including sodium and chloride) are essential to plants in very low amounts but can cause toxicities at high concentrations (Ayers & Westcot 1985). Generally, increasing concentrations of salt in soil solution may lead to nutritional disorders impacting directly on plant growth (Quist & Williams 1999). High levels of Na+ may lead to a decrease in plant uptake of K+ (Greenway & Munns 1980). In many species, a higher concentration of K+ in growing tissues is related to salt tolerance. In addition, boron can cause toxicity to sensitive crops at concentrations less than 1 part per million (ppm) (Bauder et al. 2011).
Traditional management of irrigation with saline-sodic water
The application of saline–sodic irrigation water is a major reason for soil salinisation, sodification and nutrient loss in irrigated areas. The application of soil amendment or use of water treatment is used to reduce the effects on soil irrigated with saline-sodic water. Blending or alternating saline-sodic water with good quality water is also used. However, the application of additional water (i.e. leaching fraction) is most commonly need to minimise salts in the root zone. In this method, greater amounts of irrigation water are applied to leach salts from the root zone in order to maintain the concentration of salts under the threshold salinity, while in the close system this method cannot be used due to the accumulation of salt will be occurred (no draining water). According to equation (2-5), the root zone salinity (ECse) can be calculated from the irrigation water salinity (ECi) and the root zone leaching fraction (LF), as listed in Table 2-2 for four broad soil types (ANZECC 2000).
ECse = 𝟐.𝟐 ×𝑳𝑭𝑬𝑪𝒊 Equation 2-5
where:
ECse = average root zone salinity in dS/m
ECi = electrical conductivity of irrigation water in dS/m LF = average leaching fraction.
However, the addition of excess water to leach salts may lead to the leaching of nitrogen and other mobile ions beyond the root zone, adversely affecting groundwater quality and crop production.
Table 2-2: Soil type and average root zone leaching fraction (ANZECC 2000) from (DNR 1997a)
Application of electric field to soils
Chapter 2: Literature Review
11
This researcher found that water moved through capillary pores towards the cathode when an electric field was applied to a clay water mixture. When the electric potential was removed, the water stopped moving (Mitchell & Soga 2005). Applying an electrical current (in the range of mA cm-2) generates physical, chemical and hydrological changes in the soil (Acar et al. 1995). The main phenomena includes electrolysis and the transport processes electro-osmosis, electro-migration (ionic migration), and diffusion (Acar & Alshawabkeh 1993; Reddy & Cameselle 2009). Figure 2-3 shows a simplified description of the EK transport processes.
Figure 2-3: The processes occurring in electrokinetic remediation (Leinz et al. 1998)
2.6.1 Electrolysis
Electrolysis is the cause of oxidation and reduction processes at the electrodes. Applying an electrical current through electrodes causes a loss or gain of electrons by ions in the solution (Bockris & Reddy 1970). Consequently, ions which lose electrons become positively charged (cations); whereas ions which gain electrons will be negatively charged (anions). The removal of electrons is oxidation, occurring at the anode (positive charged electrode); while the gain of electrons is reduction, occurring at the cathode (negative charged electrode) (Bockris & Reddy 1970).
Electrolysis of water is the primary reaction at the electrodes when applying an electrical field to a soil (Gray 1900; Mise 1961; Reddy & Cameselle 2009). As a result of this reaction, hydrogen gas will be generated at the negative electrode (anode); while oxygen gas will be produced at the positive electrode (cathode) (Zoulias et al. 2004). These reactions (equations 2-6 and 2-7) affect soil pH as the pH of the pore fluid will be acidic (pH ˂4) at the anode and basic (pH ˃10) at the cathode.
𝟐𝐇𝟐𝐎 − 𝟒𝐞−→ 𝐎𝟐+ 𝟒𝐇+ at anode (oxidation) Equation 2-6
𝟒𝐇𝟐𝐎 + 𝟒𝐞−→ 𝟐𝐇𝟐+ 𝟒𝐎𝐇− at cathode (reduction) Equation 2-7
2.6.2 Electro-osmosis
Chapter 2: Literature Review
12
solution (Casagrande 1900; Das 2013). Thus, electro-osmosis can be defined as the consequences of the different electrical charges in the soil capillary, or pore wall, and the adjacent pore water because the pore wall attracts the positively charged water molecules present in the pore space (Leinz et al. 1998).
The earliest observation of electro-osmosis flow was reported by Reuss in 1808 (Paillat et al. 2000). Wet fine-grained (clay soil) included two charged layers (negative and positive charged layers). The clay surface of the capillary wall is negatively charged and attracts a layer from the soil solution. By applying an electric current via electrodes placed in the soil the positive charged ions will attract to the cathode and move water in the same direction (Mitchell 1993). Equation 2-8, which is analogue to Darcy’s law, describes the EO-induced water flow rate for applied purposes (Alshawabkeh et al. 1999; Bjerrum et al. 1967).
Qe = Ke E A Equation 2-8
Where Qe indicates the EO-induced water flow rate (m3s-1); Ke = the coefficient of electro-osmotic conductivity (m2V-1s-1); E = the electric field strength (V m-1) and; A
= total cross-sectional area perpendicular to the direction of fluid flow (m2).
The coefficient of electro-osmosis, as described in equation (2-8), is directly related to the Zeta potential of the soil-pore fluid interface ζ (V), the soil electrical permittivity ε (C2N-1m-2) and soil porosity n (unit less). However, it is inversely proportional to the
viscosity of the pore fluid η (N s m-2) and 4π which is a shape factor describing the spherical shape of particles (Acar & Alshawabkeh 1993; Arnold 1973; Banerjee & Law 1998). The Ke value depends on the soil type which generally is between 1.5 x 10⁻⁹ and 12 x 10-9 m2 V-1 s-1 (Mitchell & Soga 2005);
𝑲𝒆 = 𝟒𝝅𝜼𝜺 𝜻 𝒏 Equation 2-9
In the EO process, the water flow occurs as a result of both the applied electrical gradient and the hydraulic gradient. The hydraulic flow (qh) due to the hydraulic gradient (ih) is described by Darcy’s law (Reddy & Cameselle 2009).
qh = kh ih , Equation 2-10
where (kh) is the hydraulic conductivity.
2.6.3 Electro-migration
Chapter 2: Literature Review
13
Figure 2-4 : The migration of ions across the soil to opposed charged electrode under an electric field (Acar et al. 1995).
The migration of ions toward electrodes occurs when an electrical field is applied. However, the amount of ionic migration is affected by the ionic mobility. The values of ionic mobility in dilute solutions vary among ions. The typical range of these values is 3X10⁻⁸ to 1X10⁻⁷ m2 V-1.s-1, ‘except for H+ and OH–, which have mobilities one order of magnitude greater’ (Baraud et al. 1997; Page & Page 2002). The mass transport of ions by migration can be calculated by using equation 2-11 (Acar & Alshawabkeh 1993).
Jm
j = - u*j cj E Equation 2-11
where, Jmj refers to migration flux of salt ions, u*j is effective ionic mobility, E = electrical potential.
The effective ionic mobility (u*j) is defined as the velocity of the ion in soil pores under effect of a unit electric field (Alshawabkeh & Acar 1996). It can be theoretical estimated by using the Nernst-Townsend-Einstein relation (Holmes & Handler 1962).
u*
j = uj τn= 𝑫𝒋 ∗
𝑹𝑻𝒛𝒊 𝑭 Equation 2-12
where, uj= ionic mobility, D* = the diffusion coefficient (m2/s) zjis valence, F = Faraday’s constant, R = the universal gas constant and T is absolute temperature
2.6.4 Diffusion
Diffusion can be defined as a process of ions transport occurring in response to a concentration gradient especially near the electrodes (Page & Page 2002). The common law describing the flux of ions in solution affected by diffusion is Fick’s law (Acar & Alshawabkeh 1993):
𝐉𝒅= 𝑫∗ 𝛁 (− 𝐂𝒊 ) Equation 2-13
Chapter 2: Literature Review
14
The effective diffusion coefficient of the salt ions in the porous medium (i.e. soil) is related to the diffusion coefficient in free solution which are constrained by the soil porosity and a tortuosity factors.
𝑫∗= 𝑫
𝒊 𝛕 𝐧 Equation 2-14
where, is tortuosity factor, Di is diffusion coefficient in free solution at infinite
dilution (cm2 s-1).
2.6.5 Electrophoresis
Electrophoresis is defined as the transport of charged particulates when an electric field is applied (Acar & Alshawabkeh 1993; Mitchell & Soga 1976). Applying an electric field in a soil-water system leads to the negative charged particulates moving to the anode while the positive charged particulates move toward the cathode. Electrophoresis can be important in transporting dispersed clay particulates in soils (Acar & Alshawabkeh 1993; Paillat et al. 2000).
2.6.6 Other effects associated with applying an electric field in soil
Application of an electric field through a soil may also have an impact on temperature. This occurs when the high electric field is applied. For example, Shang and Dunlap (1996) reported that extreme heating of the soil was noticed after applying 200 V m-1. Furthermore, Casagrande (1949) observed that heating and energy losses occurred when a voltage gradient greater than 50 V m-1 was applied.
Applications of electro-kinesis in soil
EK processes have been used to remove salts and contaminates from subsurface drains or soils. Figure (2-5) shows a typical field electro-kinesis remediation system.
Figure 2-5: Concept sketch describing the application of EK as a remediation system in a contaminated site (Reddy & Cameselle 2009).
Chapter 2: Literature Review
15
benzene, toluene, trichloroethylene (TCE), and m-xylene were easily detached from kaolin by EO; however, chemicals that have a low solubility and high distribution coefficient, such as hexane and isooctane, were transported from the clay at a slower rate. In addition, Kim et al. (2001) examined the efficiency of using EK to remove lead (Pb) and cadmium (Cd) from the soil. This study reported that approximately 75-85% of Pb and Cd were removed efficiently from kaolinite soil and 50-70% was removed from a tailing soil over a period of more than 4 days.
Jeon et al. (2015) tested the ability of an in situ EK process to remove As, Cu and Pb from a contaminated paddy rice field soil. It was observed that approximately 44.4 % of the As, 40.3 % of the Cu and 46.6 % of the Pb were removed from the soil after 24 weeks of applying the electrical field. According to El-Sawaby and Vadyunina (1977), the application of EK to saline soils led to an increase in the salt content of the drainage water when compared to leaching with water alone, but these differences decreased over time.
Electro-osmosis has been used in different ways including soil contamination treatment, dewatering biomass and the dewatering process of sludge (Al-Asheh et al. 2004; Bjerrum et al. 1967; Lockhart 1983; Mohamedelhassan & Shang 2001; Xue et al. 2015).
Electro-osmosis has been used as a dewatering technique. Water can be simply removed from a material after placing this material between electrodes and applying electrical potential. Following the classic investigations of Station and Casagrande (1947) on the capability of applying electric field for dewatering of clay soils, several researchers used electro-osmosis for dewatering (Adamson et al. 1966; Bjerrum et al. 1967; Casagrande 1949; Fourie et al. 2007; Shang & Lo 1997).
Shapiro and Probstein (1993) removed 94% of effluent contaminates from saturated clay using a direct current electro-osmotic dewatering technique. Reddy et al. (2006) investigated the feasibility of using electro-osmosis for de-watering of sediment. Applying the electric potential reduced the initial moisture content by 35% and 51%, respectively near the bottom and at the top of the sediment sample, compared to less than 5% moisture content reduction by gravity alone. Furthermore, Zhou et al. (2001) dewatered sludge and found that applying an electrical field of 1200 V/m removed 60% of the water while 35% removal was achieved at 400 V/m and gravity alone removed less than 20%.
Chapter 2: Literature Review
16
Nitrate maintenance by electro-kinesis
Cairo et al. (1996) evaluated EK using subsurface horizontal drainage tubing and parallel electrodes to collect and extract nitrates from soil. These authors found that the application of a small direct-current electrical field to the soil resulted in an increase in the nitrate concentration at the anode and a decrease in concentration at the cathode demonstrating the movement of the nitrate from the cathode to the anode. Eid et al. (2000) also tested the nitrate gradient developed in response to an electrical potential. This laboratory experiment tested two systems; a closed system (no flow) and an open system with flow opposite to the direction of the electric current. This study showed that the application of EK effectively concentrated and maintained the nitrate near to the anode although the pH gradient affected the movement of NO3 via the soil column. Moreover, Jia et al. (2006) evaluated the application of electro-kinesis on nitrate movement in wet soil. This study showed that nitrate concentration increased at the anode while sodium and calcium concentration were reduced; also reported a lower pH value near the anode. Recently, García et al. (2015) evaluated EK to remove nitrate from a clay soil and found that application of an electrical field removed about 90% of the nitrates from the soil in less than a week.
Conclusions and implications for managing EK with irrigation
The ability to use EK to remove salts from a soil and maintain nitrates near the anode has been demonstrated in sections 2.7 and 2.8. However, to use EK in agricultural applications it needs to be managed to maintain root zone factors suitable for plant growth and yield. Maximising plant growth and yield requires optimal management of soil water, nutrients, pH and EC. EK has the ability to influence each of these factors in the root zone but has not been evaluated for irrigated conditions.
The effects of the EK processes on soil pH have been discussed in the previous sections. It was shown that the lowest pH occurs at the anode while the highest value occurs at the cathode. These changes have direct and indirect impacts on plants due to effects on the solubility and availability of nutrients. Therefore, maintaining pH at moderate values is an important challenge when using EK as a management tool in agriculture.
The excessive application of irrigation water to leach salts from the root zone leads to the loss of nutrients via drainage water. Therefore, selecting the application irrigation method and practices to avoid these issues is important to successful management. Traditionally, greater amounts of irrigation water are applied to leach salts from the root zone in order to maintain the root zone concentration of salts under the threshold for plant damage. However, the addition of excess water for leaching of salts may lead to leaching of nitrogen beyond the root zone, degrading groundwater quality and reducing crop production. To address these issues, the electro-kinesis technique has been tested and evaluated as alternative management method.
Chapter 2: Literature Review
17
Chapter 3: General Methodology
18
3
Chapter 3: General Methodology
Introduction
Laboratory experiments were conducted in order to evaluate the potential to use electro-kinesis (EK) to improve the management of soils irrigated with saline-sodic water. Preliminary experiments were conducted to investigate the effect of EK on salt drainage (Chapter 4) and nitrate movement (Chapter 5) in sand columns. This was followed by a study investigating the ability to simultaneously improve the management of nitrate retention and salt drainage using EK in a sand irrigated with saline-sodic water (Chapter 6). This led to the development of a combined soil-water and EK model (Chapter 7) which was used to demonstrate the effect of management variables on the ability to improve nitrate and salt management. As many of the materials and methods used in these experiments were similar, this chapter describes the common components. Details specific to each experiment are described in the relevant chapters.
Soil and column preparation
A local river sand was sourced from a commercial landscape supplier. The sand was washed with distilled water then dried in an oven at 105ºC for 48 hours before being passed through a 2 mm screen sieve and thoroughly mixed. The sand (Table 3-1) was then stored in air-tight plastic containers until use.
Table 3-1: Selected properties of the washed sand
Properties Unit Value
EC (1:5 soil-water ratio) pH (1:5 soil-water ratio) Clay
Silt Sand
dS m-1 % % %
0.04 ± 0.02 6.6 ± 0.01
0.0 0.0 100
Chapter 3: General Methodology
19
were installed as a ring around the inside surface (circumference) of the PVC pipe prior to soil packing (see Figure 3-1). The anode was installed 2.5-7.5 cm from the top surface of the sand column while the cathode sheet was installed 2.5-7.5 cm from the bottom surface of the sand column with both electrodes having wire connectors fitted through the side of the PVC pipe.
Figure 3-1: Sand columns mounted in wooden frame and attached to the EK equipment within the electrically isolated wooden cupboard. Insert shows electrodes mounted inside PVC piping
Chapter 3: General Methodology
20
Figure 3-2: The application of the vacuum to the porous soil solution extraction tubes by extending the syringe plungers and holding the plungers in place with black plastic blocks
After soil packing, the column base was inserted into a plastic Buchner funnel and the join between the column and funnel sealed with PVC tape. The sand column was then mounted vertically in a wooden frame (see Figure 3-1) and the top surface fitted with a removable PVC cap in which a small hole had been drilled to enable the application of drip irrigation while minimising evaporative losses.
Preparation of the salt solutions and application of water to the sand columns
Saline-sodic salt solutions were prepared and applied to the sand columns both during soil packing (section 3.2) and by irrigation during experimentation. Combinations of calcium chloride (CaCl2.2H2O) and sodium chloride (NaCl) were dissolved in distilled water to prepare a range of saline-sodic water qualities with different electrical conductivity (EC) and sodium adsorption ratio (SAR). After preparation, the EC of the solution was confirmed by measuring three sub-samples using a calibrated EC meter (LabCHEM- CP-Cond/pH, version 1.01).
Chapter 3: General Methodology
21
controlled by valves connected with a dripper at the top of the columns. The columns were allowed to free drain.
Figure 3-3: Configuration of the irrigation system apparatus
Application of the electro-kinetic field
The wooden frame holding the sand columns and the majority of the monitoring and electrical power generating equipment were installed within an electrically isolated wooden safety cupboard fitted with isolation switches (Figures 3-1 and 3-2). The cupboard was also fitted with a clear perspex front wall to enable visual observation of the columns and power supply during experimentation. A DC power supply (GPR-11H30D-1.2 DC 330 watts) which was able to be used in either constant current or constant voltage mode applied the electrical field to the sand columns. The electrical power was generally applied as a constant current at ≤ 1.1 A and ≤ 110 V.
Measurements and chemical analyses
Measurements of the electrical voltage being applied when a constant current was used were recorded from the power supply digital screen at regular intervals. Soil solution samples were also extracted from the sand columns at times which varied according to the experimental needs. Where appropriate, both the total drainage and rate of drainage were recorded during the experiment at suitable intervals.
Chapter 3: General Methodology
22
To determine gravimetric water content, ~10 g of sampled soil was weighed using an electronic scale (OHAUS corporation, USA, d = 0.1 mg) and then dried in an oven at 105 C° for 24 hours. The soil sample was then taken out of the oven and allowed to cool for 30 minutes in a desiccator prior to re-weighing and the gravimetric water content calculated using:
𝑮𝒓𝒂𝒗𝒊𝒎𝒆𝒕𝒓𝒊𝒄 𝒘𝒂𝒕𝒆𝒓 𝒄𝒐𝒏𝒕𝒆𝒏𝒕 (%) =𝑺𝒐𝒊𝒍 𝒘𝒆𝒕 𝒘𝒆𝒊𝒈𝒉𝒕−𝒔𝒐𝒊𝒍 𝒅𝒓𝒚 𝒘𝒆𝒊𝒈𝒉𝒕𝒔𝒐𝒊𝒍 𝒅𝒓𝒚 𝒘𝒆𝒊𝒈𝒉𝒕 × 𝟏𝟎𝟎 Equation 3-4
For the measurement of soluble ions, ~5 g of air dried soil was weighed in an aluminium container of known weight, transferred to a centrifuge tube (45 cm3) with 25 cm3 of distilled water and mixed by a shaker (John Morris Pty. Ltd, Model No 3521, Illinois USA) for 10 minutes at 100 rpm. The tubes were then placed in centrifuge (Labtek Pty. Ltd, Model No, 650.550.050, Australia) for 15 minutes at 3000 rpm and the supernatant transferred to a 100 cm3 container.
Chapter 4: A preliminary evaluation of using electro-kinesis to control salt movement in an irrigated sand column
23
4
Chapter 4: A preliminary evaluation of using electro-kinesis to
control salt movement in an irrigated sand column
Introduction
Worldwide there is increasing demand for food and the shortage of good quality irrigation water has led to the use of alternate sources of irrigation water, particularly in arid and semi-arid areas. In particular, marginal water such as saline-sodic groundwater and industrial effluent water are increasingly used for irrigation (Fereres & Soriano 2007; Pereira et al. 2002). Long-term use of saline-sodic water may have negative impacts on soil productivity due to salinisation and sodification. This can affect soil structure (Aylmore 1993; Tedeschi & Dell’Aquila 2005) and potentially decrease plant water uptake due to reduced water holding capacity and an osmotic effect (Ayers & Westcot 1985; Brinck & Frost 2009). Research (Bauder & Brock 2001; Bennett & Raine 2012b; Chi et al. 2012; Ezlit et al. 2013) has shown that the impacts of irrigation with saline-sodic water can be reduced by improvements in land and water management.
Traditional irrigation management of saline-sodic soils (Chapter 2.5) includes the application of chemical amendments and additional water to leach salt from the root zone (Abbott & McKenzie 1986; Bauder & Brock 2001; Choudhary et al. 2011). Common amendments include gypsum (CaSO4•2H2O), lime (CaCO3) and organic matter (Bennett, J. et al. 2015; Bennett, J. M. et al. 2015; Bennett et al. 2014; Qadir et al. 2001). However, the effectiveness of these amendments in removing sodium from a root zone is soil specific and gradual, dependent on cation exchange (i.e. sodium for calcium) and subsequent leaching of the sodium from the root zone (Bennett, J. et al. 2015; Bennett et al. 2014; Valzano et al. 2001). Conversely, excessive water added to leach sodium and salts can increase leaching of nitrogen to groundwater (Li et al. 2007).
Previous studies (Acar et al. 1994; Acar et al. 1995; Alshawabkeh & Acar 1996; Alshawabkeh et al. 1999; Bruell et al. 1992; Méndez et al. 2011) have shown that electro-kinesis (EK) can be used to remove salts and/or contaminates