Article
Interactive Effects of Endogenous and Exogenous
Nutrition on Larval Development for
Crown-Of-Thorns Starfish
Ciemon Frank Caballes1,*, Morgan S. Pratchett1and Alexander C. E. Buck1,2
1 ARC Centre of Excellence for Coral Reef Studies, James Cook University, Townsville, QLD 4811, Australia;
2 Marine Biology and Aquaculture, College of Science and Engineering, James Cook University, Townsville,
QLD 4811, Australia; [email protected]
* Correspondence: [email protected]; Tel.: +61-7-4781-5747
Academic Editors: Sven Uthicke and Michael Wink
Received: 30 November 2016; Accepted: 27 February 2017; Published: 4 March 2017
Abstract: Outbreaks of crown-of-thorns starfish are often attributed to step-changes in larval survivorship following anomalous increases in nutrients and food availability. However, larval growth and development is also influenced by the nutritional condition of spawning females, such that maternal provisioning may offset limitations imposed by limited access to exogenous sources of nutrients during the formative stages of larval development. This study examined the individual, additive, and interactive effects of endogenous (maternal diet:Acropora,Porites, mixed, and starved) and exogenous (larval diet: high concentration at 104cells·mL−1, low concentration at
103algal cells·mL−1, and starved) nutrition on the survival, growth, morphology, and development of larvae of the crown-of-thorns starfish. Female starfish onAcroporaand mixed diet produced bigger oocytes compared toPorites-fed and starved treatments. Using oocyte size as a proxy for maternal provisioning, endogenous reserves in the oocyte had a strong influence on initial larval survival and development. This suggests that maternal reserves can delay the onset of obligate exogenous food acquisition and allow larvae to endure prolonged periods of poor environmental nutritive conditions or starvation. The influence of exogenous nutrition became more prominent in later stages, whereby none of the starved larvae reached the mid-to-late brachiolaria stage 16 days after the onset of the ability to feed. There was no significant difference in the survival, development, and competency of larvae between high and low food treatments. Under low algal food conditions, larvae compensate by increasing the length of ciliated feeding bands in relation to the maximum length and width, which improve food capture and feeding efficiency. However, the effects of endogenous nutrition persisted in the later developmental stages, as larvae from starved females were unable to develop larger feeding structures in response to food-limiting conditions. Phenotypic plasticity influenced by endogenous provisions and in response to exogenous food availability may be an important strategy in boosting the reproductive success of crown-of-thorns starfish, leading to population outbreaks.
Keywords: Acanthaster outbreak; maternal provisioning; larval nutrition; larval development; phenotypic plasticity
1. Introduction
Marked and acute increases in the local abundance of the coral-eating crown-of-thorns starfish (CoTS),Acanthaster plancis. l., often termed “outbreaks”, contribute significantly to global declines in coral cover [1–3] and are a central focus of ongoing research and management to secure the future of coral reef ecosystems [4,5]. Effective long-term management of CoTS outbreaks is fundamentally
dependent upon identifying the ultimate cause(s) of changes in key demographic properties that potentially differentiate outbreak and non-outbreak populations [6]. However, given the exceptional fecundity and reproductive potential of CoTS [7], it has been suggested that very subtle changes in recruitment rates could be sufficient to initiate outbreaks [8], especially if primary outbreaks represent the accumulation of individuals over several successive recruitment events (e.g., [9]). Conversely, step-changes in developmental rates and survivorship of CoTS larvae have been reported across relatively moderate gradients in chlorophyll concentrations, such that periodic influxes or concentrations of nutrients (e.g., during major flood events [10,11], upwelling [12], or from oceanographic features such as chlorophyll fronts [13]) may be an important precursor to CoTS outbreaks [14–16].
For planktotrophic larvae, the energy required for survival, growth, and development can be derived from two sources: parental investment in the oocyte and nutrient acquisition by pelagic larvae from the external environment [17–19]. There is a clear dissociation between the adult and larval nutritional environments of CoTS and the factors influencing the abundance of adult food (coral) and larval food (microalgae) may be quite different. The importance of exogenous food, acquired through the filter feeding activity of larvae, to complete development is well established for CoTS [14–16,20–22]. The “larval-starvation hypothesis” is predicated on the notion that normally low levels of nutrients in near-reef environments would generally constrain growth and development of CoTS larvae and the release from starvation during periods of nutrient-induced phytoplankton blooms significantly enhances larval survival and recruitment success leading to population outbreaks [20,23]. Fabricius et al. [14] reported dramatic increases in survival and competency of CoTS larvae with every doubling of chlorophyll concentration (a proxy for phytoplankton abundance) above 0.25µg·L−1. In addition, Uthicke et al. [22] also demonstrated that algal food concentration has a strong influence on larval development, with temperature as a modulator. Apart from exogenous food availability, the condition of CoTS larvae (at least during early larval stages) will also be partly influenced by the nutritional condition of females during spawning, whereby well-fed females produce larger and faster developing larvae [24]. The question is whether the effects of maternal provisioning are sufficient to offset potential limitations on larval growth and survivorship when larvae are exposed to low levels of food in the environment?
The nutritional condition, and therefore fitness, of adult CoTS is clearly dependent on availability of coral prey [25], and may also vary with differences in the local availability of different types of corals [24]. It is well known that adult CoTS have very specific prey preferences, generally feeding onAcroporaandMontiporacorals to the exclusion of all other coral genera when available [3]. Although CoTS will eat virtually all scleractinian corals and can cause comprehensive depletion of corals during severe population outbreaks, there is often serial depletion of different coral genera (e.g., [26]), whereby less preferred coral prey are generally consumed only after other more preferred corals are locally depleted. While it is yet to be effectively shown, strong feeding preferences by CoTS likely reflect the variation in the nutritional content and/or food value of different coral prey [27]. If so, it can be inferred that the nutritional condition of CoTS would be maximized when feeding on generally preferred corals suchAcropora, while condition is likely to decline after preferred coral prey have been locally depleted, such that feeding is restricted to less preferred corals (e.g.,Porites). In Guam, Caballes et al. [24] showed that CoTS maintained for 8-weeks on a diet ofAcropora abrotanoidesgained weight and produced bigger oocytes, compared to conspecifics that were maintained on a diet of Porites rusor starved. Moreover, differences in the diet and nutritional condition of females had a significant bearing on the quality and quantity of their progeny [24].
modify larval shape to maintain high clearance rates at food-limiting conditions. Bipinnaria larvae of the sand starfish,Luidia foliolata, maintained at high food concentration had pointed anterodorsal and posterodorsal arms, whereas larvae at low food levels had rounded arms, which was associated with high clearance rates [31]. Wolfe et al. [32] documented phenotypic plasticity in 7-day old CoTS larvae in response to a range of algal food concentrations. However, the effect of adult diet and corresponding maternal investment on how larvae respond to variable conditions of exogenous food availability is unknown. This has important implications in understanding how CoTS larvae thrive even in oligotrophic conditions.
The purpose of this study was to evaluate the individual, additive, and interactive effects of endogenous (“Maternal”) and exogenous (“Larval”) nutrition on larval vitality and morphology. Previous studies [24] have shown that there are significant maternal effects on the quality of CoTS larvae, but it is unknown whether significant levels of endogenous nutrients could offset potential limitations associated with low availability of planktonic food (e.g., [20]). Maternal nutrition could affect larval planktonic duration by affecting larval growth rates, but effects of exogenous food (phytoplankton) could overwhelm maternal effects [18]. This study aims to determine whether the effects of maternal provisioning disappears though compensation or persists throughout development under different conditions of food availability for larvae. The gonad index and size of oocytes from females fed withAcropora, mixed diet (Acropora,Pocillopora,Porites),Porites, and starved females were compared as a proxy for maternal provisioning and oocyte quality. The effects of endogenous and exogenous nutrition on (1) absolute survival; (2) development and competency; and (3) growth and morphology of larvae were specifically addressed in this paper.
2. Materials and Methods
2.1. Collection and Maintenance of Specimens
Adult individuals of the Pacific crown-of-thorns starfish (Acanthastercf.solaris) were collected on 26 October 2015 from Eyrie Reef (14.705660◦S, 145.379154◦E), located 8 km west of Lizard Island in the northern Great Barrier Reef (GBR), Australia. Starfish were transported to the Lizard Island Research Station and placed in 1000-L oval tanks with continuous flow of fresh seawater (27.15±0.97◦C; 35.46±0.07 psu; pH 8.17±0.01). Sex was determined by examining contents drawn from gonads along the arm junction using a syringe with a large-bore biopsy needle [33]. Twelve female starfish were allowed to acclimatize to ambient aquarium conditions for three days, without food prior to being assigned to one of four different feeding treatments (described below). A fresh batch of male starfish was collected from Eyrie Reef on 29 November 2015 and gravid males were placed in 1000-L oval tanks with flow-through seawater and maintained on a mix ofAcropora intermedia,Porites cylindrica, and Pocillopora damicorniscorals for three days. Coral fragments used for experimental feeding treatments were collected from within the Lizard Island lagoon (14.697030◦ S, 145.451410◦E) and allowed to acclimatize in plastic aquaria for 24 h (GBRMPA Permit No. G15/38002.1). Coral infauna (e.g.,Trapezia crabs) were physically removed from all coral fragments so as not to deter feeding by CoTS [34].
2.2. Maternal Feeding Treatments
and (iv) Starved (no food provided, only dead coral skeletons). Supply of coral food for fed treatments was replenished as soon as the piece of coral provided had been completely consumed. Sample size (n= 3) was kept low to limit the amount of coral fedad libitumto starfish. Wet weight of each starfish, prior to and 30 days after feeding treatments, was measured. Gonads and pyloric caeca were also weighed after feeding treatments to calculate the gonad index (GSI) and the pyloric caeca index (PCI) for each individual. The average weight of gonads and pyloric caeca from three arms was multiplied with the total number of arms of each starfish to estimate the total gonad or pyloric caeca weight. GSI and PCI were expressed as the ratio of gonad or pyloric caeca weight to the total weight of the starfish [36].
2.3. Spawning Induction and Oocyte Metrics
Gonad lobes were dissected from the twelve females and ovaries were rinsed in 0.2-µm filtered seawater (FSW) to remove loose oocytes. Ovary lobes were treated in 10−5M 1-methyladenine to
induce ovulation. Released oocytes were transferred into containers with filtered seawater and wet mounted on glass slides for microscopic examination. Diameters (Doocyte) of the long and short
axes of 100 randomly selected mature oocytes (have undergone germinal vesicle breakdown) from each treatment were measured using image analysis of micrometer-scaled photographs of oocytes in Image J [37]. Oocyte volume (Voocyte) was calculated using the formula for an oblate spheroid:
Voocyte= 4/3×π×a2×b, (1)
whereais the radius of the major axis (long axis) andbis the radius of the minor axis (short axis).
2.4. Fertilization and Larval Rearing
Oocytes from each female were placed in separate 1-L beakers with FSW kept at 28 ◦C. Approximately 200 oocytes from each female were transferred into triplicate 250-mL beakers using a glass pipette. Spermatozoa were collected from the testes of five males and checked for motility under a microscope. Roughly equal amounts of spermatozoa from each male were combined and counted using a haemocytometer. Oocytes were fertilized with spermatozoa diluted to achieve a spermatozoa-to-oocyte ratio of 100:1.
the start of feeding, all surviving larvae were categorized into the following developmental stages: (1) early bipinnaria—gut fully formed, preoral and anal lobes present, coelomic pouches below or close to mouth;(2) advanced bipinnaria—coelomic pouches fuse as axohydrocoel above the mouth, anterodorsal and posterolateral arms start to form;(3) early brachiolaria—brachiolar arms start to appear as stump-like projections from the anteroventral surface of the larvae, anterior extension of axohydrocoel, anterodorsal, posterolateral, and posterodorsal arms start to elongate, preoral arms start to form;(4) mid-late brachiolaria—brachiolar arms prominent, starfish rudiment developing in the posterior region of larvae, postoral arms form, and other larval arms more elongated; and (5) abnormal—stunted and deformed larvae [24,39,40].
Diversity 2017, 9, 15 5 of 18
[image:5.595.146.458.226.392.2]surface of the larvae, anterior extension of axohydrocoel, anterodorsal, posterolateral, and posterodorsal arms start to elongate, preoral arms start to form; (4) mid-late brachiolaria—brachiolar arms prominent, starfish rudiment developing in the posterior region of larvae, postoral arms form, and other larval arms more elongated; and (5) abnormal—stunted and deformed larvae [24,39,40].
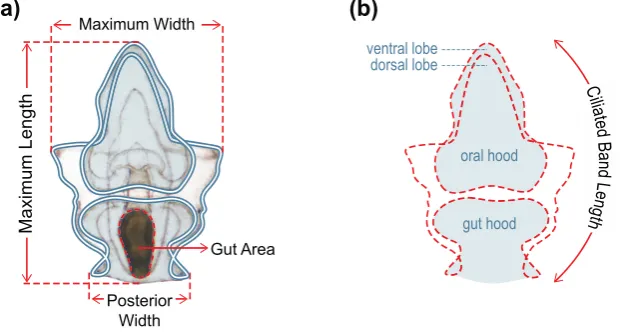
Figure 1. Morphometric measurements of larvae taken four and ten days after commencement of feeding: (a) size of morphological features; (b) Ciliated band length = sum of the traced perimeter measurements of the oral hood and ventral lobe, gut hood, larval sides, and dorsal lobe (red dashed outline).
2.5. Statistical Analyses
Statistical comparison of oocyte diameter and volume was made using a two-factor mixed model hierarchical analysis of variance (ANOVA) with “Maternal Nutrition” as a fixed effect (four levels) and “Female” (three levels, random) nested within “Maternal Nutrition”. No departures from normality and homogeneity of variance were detected for all data. A post hoc Tukey’s test was used for pairwise comparisons of fixed factor means. A generalized linear model (GLM) with quasibinomial errors and logit link function was used to analyze the effect of maternal nutrition and larval feeding treatments (fixed categorical predictors) on the proportion of surviving and normally developing larvae and percentage of larvae at the brachiolaria stage (response variables). Treatments with zero variance (e.g., 0% larvae at the mid-late brachiolaria stage across all replicates for treatment with no algal food) were excluded from this analysis. Pairwise post hoc tests were subsequently performed using the Tukey’s method in “lsmeans” function in R [41]. The frequency distribution of larvae under different developmental stages was analyzed as a contingency table using log-linear models with log link and Poisson error terms [42] to examine larval progression in relation to “Maternal” and “Larval” nutrition treatments. “Developmental Stage” was considered as a response variable so all models included the interaction between “Maternal” and “Larval” nutrition [43]. Degrees of freedom (df) were calculated and deviance statistics (χ2) were used to compare models in R [41]. Pairwise comparisons were done using G-test of independence with correction for false discovery rate [44]. Data for measurements of morphological traits were analyzed using two-way ANOVA testing for the main and interactive effects of “Maternal” and “Larval” nutrition treatments. Data were log-transformed when assumptions of normality or homogeneity of variance were not met. Significant tests were followed by post hoc Tukey’s test for pairwise comparisons within fixed effects. Principal component analysis (PCA), implemented using the “vegan” package in R, was used to visualize the effect of “Maternal” and “Larval” nutrition treatments on larval morphology. Morphometric data were log-transformed and the average per replicate culture bottle was used to avoid pseudoreplication. Further morphometric comparisons were performed using permutational multivariate ANOVA (PERMANOVA) on 9999 permutations under a reduced model [45].
Gut Area Maximum Width
Posterior Width
Ma
xi
m
um L
ength
C ilia
te d B
an
d L
en
gth
gut hood dorsal lobe
ventral lobe
oral hood
(a)
(b)
Figure 1.Morphometric measurements of larvae taken four and ten days after commencement of feeding: (a) size of morphological features; (b) Ciliated band length = sum of the traced perimeter measurements of the oral hood and ventral lobe, gut hood, larval sides, and dorsal lobe (red dashed outline).
2.5. Statistical Analyses
treatments on larval morphology. Morphometric data were log-transformed and the average per replicate culture bottle was used to avoid pseudoreplication. Further morphometric comparisons were performed using permutational multivariate ANOVA (PERMANOVA) on 9999 permutations under a reduced model [45]. Morphological traits were log-transformed and Euclidean distances were used to generate a resemblance matrix in PRIMER v.6 (Primer-E Ltd., Plymouth, UK). Means and standard deviation (±SD) were calculated for all data in each treatment. All statistical analyses were performed in R, unless stated otherwise, and p-values (p) below 0.05 were considered statistically significant in all tests.
3. Results
3.1. Maternal and Oocyte Metrics
Initial diameter (F3,8= 0.19,p= 0.9011) and weight (F3,8= 0.21,p= 0.8898) of female starfish used
under the four maternal nutrition treatments were not significantly different. Weight change after 30 days was also not significantly different between maternal diet treatments (F3,8= 0.47,p= 0.7130).
Maternal diet had a significant effect on pyloric caeca indices (PCI;F3,8= 4.60, p= 0.0374), mainly
due to females under the mixed diet treatment having significantly higher PCI than starved starfish. The gonadosomatic index (GSI) of females given Acropora(24.1±1.7% SD, standard deviation in all instances hereafter) and mixed (24.2 ± 1.4%) diets were significantly higher than Porites-fed (13.2±1.6%) and starved (11.2±2.5%) starfish (F3,8= 14.29,p= 0.0014).
Variation in oocyte diameter (D) and volume (V) was consistent with patterns for GSI between treatments (Figure 2). The diameter and volume of oocytes from starfish placed under Acropora (D = 0.22±0.01 mm; V = 0.0051±0.0009 mm3) and mixed (D = 0.22±0.02 mm; V = 0.0051±0.0010 mm3) diet treatments were significantly larger compared to Porites-fed
(D = 0.19±0.02 mm; V = 0.0033±0.0008 mm3) and starved (D = 0.19±0.01 mm; V = 0.0031±0.0006 mm3) females. Maternal diet treatments accounted for 60% and 63% of the variation in oocyte diameter and volume, respectively (Table S1). There was a significant difference in oocyte size among females within treatments, but this only accounted for 5% of the variation (Table S1).
Diversity 2017, 9, 15 6 of 18
Morphological traits were log-transformed and Euclidean distances were used to generate a resemblance matrix in PRIMER v.6 (Primer-E Ltd., Plymouth, UK). Means and standard deviation (± SD) were calculated for all data in each treatment. All statistical analyses were performed in R, unless stated otherwise, and p-values (p) below 0.05 were considered statistically significant in all tests.
3. Results
3.1. Maternal and Oocyte Metrics
Initial diameter (F3,8 = 0.19, p = 0.9011) and weight (F3,8 = 0.21, p = 0.8898) of female starfish used under the four maternal nutrition treatments were not significantly different. Weight change after 30 days was also not significantly different between maternal diet treatments (F3,8 = 0.47, p = 0.7130). Maternal diet had a significant effect on pyloric caeca indices (PCI; F3,8 = 4.60, p = 0.0374), mainly due to females under the mixed diet treatment having significantly higher PCI than starved starfish. The gonadosomatic index (GSI) of females given Acropora (24.1 ± 1.7% SD, standard deviation in all instances hereafter) and mixed (24.2 ± 1.4%) diets were significantly higher than Porites-fed (13.2 ± 1.6%) and starved (11.2 ± 2.5%) starfish (F3,8 = 14.29, p = 0.0014).
Variation in oocyte diameter (D) and volume (V) was consistent with patterns for GSI between treatments (Figure 2). The diameter and volume of oocytes from starfish placed under Acropora (D = 0.22 ± 0.01 mm; V = 0.0051 ± 0.0009 mm3) and mixed (D = 0.22 ± 0.02 mm; V = 0.0051 ± 0.0010 mm3) diet treatments were significantly larger compared to Porites-fed (D = 0.19 ± 0.02 mm; V = 0.0033 ± 0.0008 mm3) and starved (D = 0.19 ± 0.01 mm; V = 0.0031± 0.0006 mm3) females. Maternal diet treatments accounted for 60% and 63% of the variation in oocyte diameter and volume, respectively (Table S1). There was a significant difference in oocyte size among females within treatments, but this only accounted for 5% of the variation (Table S1).
Figure 2. Size of oocytes from female starfish under different maternal nutrition treatments: (a) oocyte diameter; (b) oocyte volume. Boxplots with different letters above are significantly different.
3.2. Larval Survival
Absolute survival of larvae (without taking into account normal development and larval stage) was high (>85%) across all treatments at day 4 (Figure 3) and no significant differences were found between maternal nutrition and between larval diet treatments (GLM, Table 1). At day 8, maternal
D
iam
et
er
(
m
m
)
0.14 0.16 0.18 0.20 0.22 0.24 0.26 0.28
Maternal Nutrition Treatments
Acropora Mixed Porites Starved
Vo
lu
m
e
x
1
0
-2 (m
m
3)
0.10 0.20 0.30 0.40 0.50 0.60 0.70 0.80
(a)
(b)
a a b b
[image:6.595.155.443.468.674.2]a a b b
Figure 2.Size of oocytes from female starfish under different maternal nutrition treatments: (a) oocyte diameter; (b) oocyte volume. Boxplots with different letters above are significantly different.
3.2. Larval Survival
between maternal nutrition and between larval diet treatments (GLM, Table1). At day 8, maternal effects were significant, with a higher proportion (>70%) of surviving larvae from females that were fed (Acropora, Mixed,Porites) compared to the starved treatment (56.9± 13.1%) (Figure3). At 12 and 16 days after the onset of larval ability to feed, maternal and larval nutrition treatments had a significant additive effect on larval survival. At day 12, survival was >60% for larvae from females on a coral diet, while survival was only 48.4±14.2% for larvae from unfed starfish. Survival was also >60% for larvae provided with exogenous food, while only 52±15.6% of starved larvae survived at day 12. At the end of the experiment (day 16), survival was almost twice as high for larvae from maternally fed treatments (Acropora= 50.1±14.6%, Mixed = 49.4±15.7%,Porites= 45.3±19.0%) compared to those from the starved treatment (37.7±17.1%). Larvae that were fed with microalgae also had a higher survival rate (High: 55.9±13.1%; Low: 53.8±10.7%) compared to larvae with no food (28.4±10.5%) at day 16 (Figure3).
Diversity 2017, 9, 15 7 of 18
[image:7.595.143.453.262.672.2]effects were significant, with a higher proportion (>70%) of surviving larvae from females that were fed (Acropora, Mixed, Porites) compared to the starved treatment (56.9 ± 13.1%) (Figure 3). At 12 and 16 days after the onset of larval ability to feed, maternal and larval nutrition treatments had a significant additive effect on larval survival. At day 12, survival was >60% for larvae from females on a coral diet, while survival was only 48.4 ± 14.2% for larvae from unfed starfish. Survival was also >60% for larvae provided with exogenous food, while only 52 ± 15.6% of starved larvae survived at day 12. At the end of the experiment (day 16), survival was almost twice as high for larvae from maternally fed treatments (Acropora = 50.1 ± 14.6%, Mixed = 49.4 ± 15.7%, Porites = 45.3 ± 19.0%) compared to those from the starved treatment (37.7 ± 17.1%). Larvae that were fed with microalgae also had a higher survival rate (High: 55.9 ± 13.1%; Low: 53.8 ± 10.7%) compared to larvae with no food (28.4 ± 10.5%) at day 16 (Figure 3).
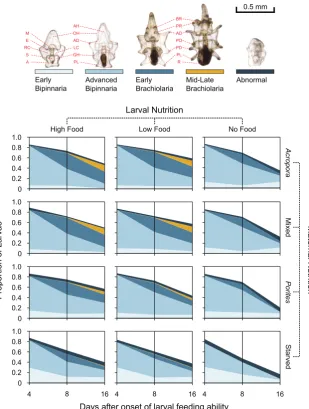
Figure 3. Larval survival and progression of larval development at 4, 8, and 16 days. Morphological traits used in scoring larvae are: mouth (M), esophagus (E), right coelomic pouch (RC), stomach (S), anus (A), axohydrocoel (AH), oral hood (OH), anterodorsal arm (AD), left coelomic pouch (LC), gut hood (GH), posterolateral arm (PL), brachiolar arm (BR), preoral arm (PR), anterodorsal arm (AD), postoral arm (PO), posterodorsal arm (PD), posterolateral arm (PL), and rudiment (R).
P
ropo
rtion o
f La
rvae
Days after onset of larval feeding ability
High Food Low Food No Food
A
cr
opor
a
Mixed
Starv
e
d
M
ater
nal
N
utrit
ion
Early Bipinnaria
Advanced Bipinnaria
Early Brachiolaria
Mid-Late Brachiolaria
Abnormal 0.5 mm
OH AD AH
LC GH PL M
E RC
S A
PR BR AD PO PD PL R
4 8 16 4 8 16 4 8 16
Larval Nutrition
Porites
0 0.2 0.4 0.6 0.8 1.0 0 0.2 0.4 0.6 0.8 1.0
0 0.2 0.4 0.6 0.8 1.0
0 0.2 0.4 0.6 0.8 1.0
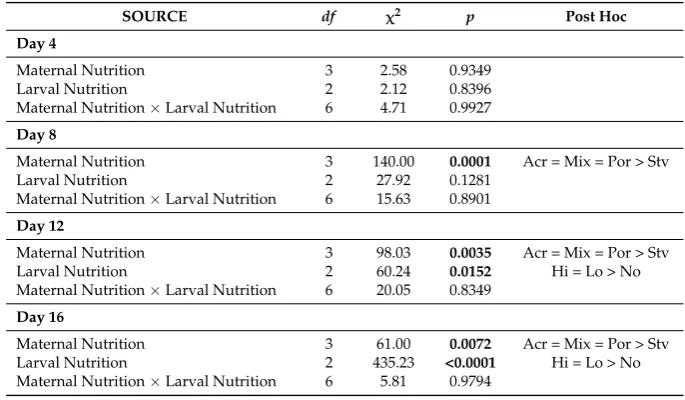
Table 1. Analysis of deviance for binomial generalized linear models (GLMs) testing the effects of maternal nutrition and larval feeding treatments on the proportion of surviving larvae at 4, 8, 12, and 16 days after the onset of the ability of larvae to feed. Hereafter, Maternal Diet:Acr=Acropora,
Mix= mixed diet,Por= Porites, Stv= starved; Algal Food Concentration (cells·mL−1): Hi= 104, Lo= 103,No= 0.
SOURCE df χ2 p Post Hoc
Day 4
Maternal Nutrition 3 2.58 0.9349
Larval Nutrition 2 2.12 0.8396
Maternal Nutrition×Larval Nutrition 6 4.71 0.9927
Day 8
Maternal Nutrition 3 140.00 0.0001 Acr = Mix = Por > Stv
Larval Nutrition 2 27.92 0.1281
Maternal Nutrition×Larval Nutrition 6 15.63 0.8901
Day 12
Maternal Nutrition 3 98.03 0.0035 Acr = Mix = Por > Stv
Larval Nutrition 2 60.24 0.0152 Hi = Lo > No
Maternal Nutrition×Larval Nutrition 6 20.05 0.8349
Day 16
Maternal Nutrition 3 61.00 0.0072 Acr = Mix = Por > Stv
Larval Nutrition 2 435.23 <0.0001 Hi = Lo > No
Maternal Nutrition×Larval Nutrition 6 5.81 0.9794
3.3. Larval Development
At day four after the onset of larval feeding ability, the majority of the larvae across all treatments were at the advanced bipinnaria stage. The distribution of larvae among the different developmental stages was dependent on maternal nutrition (Table2), with a higher proportion of larvae that were still at early bipinnaria under the starved treatment (35.7±18.1%) compared to larvae from starfish placed onAcropora(9.9±4.9%), mixed (11.8±4.6%), andPorites(15.4±10.5%) coral diet (Figure3). At day 8, larval development was dependent on maternal and larval nutrition treatments (Table2). The stage of development was bimodal (Figure3), with the majority of larvae remaining at advanced bipinnaria and the main driver of variation was the proportion of larvae at the brachiolaria stage (Maternal Nutrition:Acropora= 36.9±9.9%, Mixed = 35.2±10.0%,Porites= 24.1±10.8%, Starved = 13.4±13.4%; Larval Nutrition: High = 35.3±11.0%, Low = 29.9±13.8%, No Food = 16.9±12.1%). At day 16, maternal provisioning and larval diet had a significant additive effect on the developmental progression of larvae (Table2). The developmental stage frequency distribution of larvae from starfish onAcroporaand mixed diets were significantly different from Porites-fed and starved treatments (Figure3). Retrogression of larvae from brachiolaria or advanced bipinnaria back to early bipinnaria was evident for larvae from starved females and for starved larvae fromPorites-fed females (Figure3).
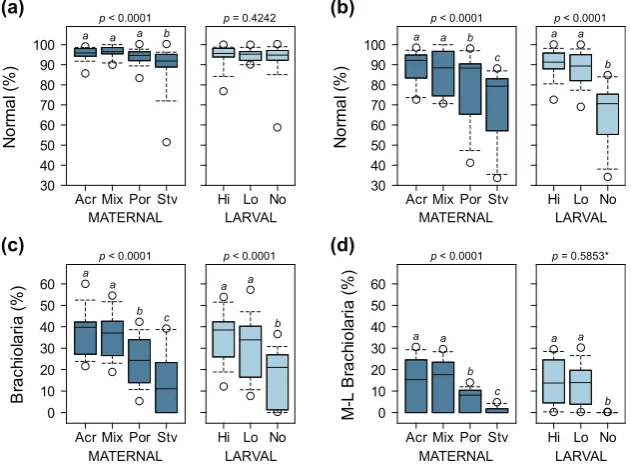
was 8% higher compared toPorites-fed treatments and 18% higher compared to starved treatments. Fed larvae were also 1.4 times more likely to undergo normal development compared to starved larvae (Figure4b). Maternal condition also had a strong influence on the proportion of larvae that reached the mid-to-late brachiolaria stage after 16 days. Treatments onAcroporaand mixed diets were 2.3 and 13.7 times more likely to reach competency compared toPorites-fed and starved treatments, respectively. None of the unfed larvae reached the mid-to-late brachiolaria stage at 16 days and were excluded in the analysis due to zero variance. There was no significant difference in the proportion of larvae at the mid-to-late brachiolaria stage between high and low algal food treatments.
Table 2.Analysis of deviance for log-linear models testing complete and conditional dependence of larval development on maternal provisioning and larval diet at 4, 8, and 16 days.
Source df χ2 p Post Hoc
Day 4
Maternal Nutrition 36 82.80 <0.0001 Acr = Mix = Por6=Stv
Larval Nutrition 32 7.34 0.9663
Maternal Nutrition×Larval Nutrition 24 4.94 1.0000
Day 8
Maternal Nutrition 36 79.62 <0.0001 Acr = Mix6=Por = Stv
Larval Nutrition1 32 51.55 0.0157
Maternal Nutrition×Larval Nutrition 24 22.05 0.5763
Day 16
Maternal Nutrition 36 103.49 <0.0001 Acr = Mix6=Por = Stv
Larval Nutrition 32 143.85 <0.0001 Hi = Lo6=No
Maternal Nutrition×Larval Nutrition 24 12.38 0.9753
1Power not sufficient to show significant differences in post hoc pairwise comparisons.
Diversity 2017, 9, 15 9 of 18
compared to starved treatments. Fed larvae were also 1.4 times more likely to undergo normal development compared to starved larvae (Figure 4b). Maternal condition also had a strong influence on the proportion of larvae that reached the mid-to-late brachiolaria stage after 16 days. Treatments on Acropora and mixed diets were 2.3 and 13.7 times more likely to reach competency compared to Porites-fed and starved treatments, respectively. None of the unfed larvae reached the mid-to-late brachiolaria stage at 16 days and were excluded in the analysis due to zero variance. There was no significant difference in the proportion of larvae at the mid-to-late brachiolaria stage between high and low algal food treatments.
Table 2. Analysis of deviance for log-linear models testing complete and conditional dependence of larval development on maternal provisioning and larval diet at 4, 8, and 16 days.
Source df χ2 p Post Hoc
Day 4
Maternal Nutrition 36 82.80 <0.0001 Acr = Mix = Por ≠ Stv
Larval Nutrition 32 7.34 0.9663
Maternal Nutrition × Larval Nutrition 24 4.94 1.0000
Day 8
Maternal Nutrition 36 79.62 <0.0001 Acr = Mix ≠ Por = Stv
Larval Nutrition 1 32 51.55 0.0157
Maternal Nutrition × Larval Nutrition 24 22.05 0.5763
Day 16
Maternal Nutrition 36 103.49 <0.0001 Acr = Mix ≠ Por = Stv Larval Nutrition 32 143.85 <0.0001 Hi = Lo ≠ No Maternal Nutrition × Larval Nutrition 24 12.38 0.9753
[image:9.595.142.458.435.673.2]1 Power not sufficient to show significant differences in post hoc pairwise comparisons.
Figure 4. Proportion of normally developing larvae at 8 days (a) and 16 days (b) after the onset of the ability of larvae to feed, and proportion of larvae at the brachiolaria stage after 8 days (c) and larvae at the mid-to-late (M-L) brachiolaria stage after 16 days (d). p-values are from overall binomial GLMs and different letters are significantly different based on post hoc pairwise comparisons (* p-value for comparison between high and low algal food treatments only; starved larvae not included in analysis due to zero variance).
Acr Mix Por Stv
No rma l ( % ) 30 40 50 60 70 80 90 100
Hi Lo No Acr Mix Por Stv
No rm a l (% ) 30 40 50 60 70 80 90 100
Hi Lo No
Acr Mix Por Stv
B rac hi o lar ia ( % ) 0 10 20 30 40 50 60
Hi Lo No Acr Mix Por Stv
M -L B ra ch iol a ri a ( % ) 0 10 20 30 40 50 60
Hi Lo No
MATERNAL LARVAL MATERNAL LARVAL
MATERNAL LARVAL MATERNAL LARVAL
(a) (b)
(c) (d)
a a a b
a a
b c
a a b c a a b a a b c a a b a a b
p < 0.0001 p = 0.4242 p < 0.0001 p < 0.0001
p < 0.0001 p < 0.0001 p < 0.0001 p = 0.5853*
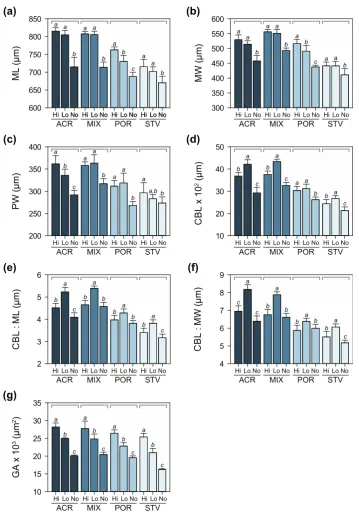
3.4. Larval Growth and Morphometry
Maternal diet had a significant effect on initial size across all morphological traits at four days after the onset of larval feeding ability (Table S3). Larval diet did not influence larval growth at this stage. Variation in maximum larval length, maximum width, posterior width, ciliated band length, and gut area was mainly due to maternal treatments (Figure5). In particular, variation in larval size was driven by differences in growth rates, which was consistently higher for coral-fed treatments compared to larvae from starved starfish. Among the coral-fed treatments, larvae from starfish on Acroporaand mixed diets were bigger compared toPorites-fed treatments. Patterns of variation in maximum width and posterior width were consistent with differences in ciliated band length and gut area, respectively, suggesting proportional growth of feeding structures and stomach with overall larval size (Figure5).
Diversity 2017, 9, 15 10 of 18
3.4. Larval Growth and Morphometry
Maternal diet had a significant effect on initial size across all morphological traits at four days after the onset of larval feeding ability (Table S3). Larval diet did not influence larval growth at this stage. Variation in maximum larval length, maximum width, posterior width, ciliated band length, and gut area was mainly due to maternal treatments (Figure 5). In particular, variation in larval size was driven by differences in growth rates, which was consistently higher for coral-fed treatments compared to larvae from starved starfish. Among the coral-fed treatments, larvae from starfish on
[image:10.595.145.455.253.697.2]Acropora and mixed diets were bigger compared to Porites-fed treatments. Patterns of variation in maximum width and posterior width were consistent with differences in ciliated band length and gut area, respectively, suggesting proportional growth of feeding structures and stomach with overall larval size (Figure 5).
Figure 5. Morphometric measurements of larvae (± SD) at Day 4: (a) maximum length (ML), (b) maximum width (MW), (c) posterior width (PW), (d) ciliated band length (CBL), (e) ratio of CBL to
ML, (f) ratio of CBL to MW, and (g) gut area (GA). Letters above bars denote significant differences as determined by Tukey’s post hoc tests following two-way ANOVA.
GA
x
10
3 (
μ m 2) 5 10 15 20 MW ( μ m) 300 350 400 450 500 550
Hi Lo No Hi Lo No Hi Lo No Hi Lo No
ML ( μ m) 400 450 500 550 600 650 700
a b c d
PW ( μ m) 150 200 250 300 350 400 C B
L x 10
2 (
μ m) 15 20 25 30 35 C B L : M L ( μ m) 3.0 3.5 4.0 4.5 5.0 CBL : M W ( μ m) 4.5 5.0 5.5 6.0 6.5
Hi Lo No Hi Lo No Hi Lo No Hi Lo No
a a b c
b a c d a a b c
b a b c b a c c
b a c d
Hi Lo No Hi Lo No Hi Lo No Hi Lo No Hi Lo No Hi Lo No Hi Lo No Hi Lo No Hi Lo No Hi Lo No Hi Lo No Hi Lo No
Hi Lo No Hi Lo No Hi Lo No Hi Lo No Hi Lo No Hi Lo No Hi Lo No Hi Lo No
Hi Lo No Hi Lo No Hi Lo No Hi Lo No
ACR MIX POR STV
ACR MIX POR STV
ACR MIX POR STV
ACR MIX POR STV
ACR MIX POR STV
ACR MIX POR STV
ACR MIX POR STV
(a) (b)
(c) (d)
(e)
(g)
(f)
Figure 5. Morphometric measurements of larvae (± SD) at Day 4: (a) maximum length (ML), (b) maximum width (MW), (c) posterior width (PW), (d) ciliated band length (CBL), (e) ratio of
At 10 days after the onset of larval feeding ability, there was a significant interaction in the effects of maternal and larval diet on larval size (Table S4). Initial differences in larval size due to maternal nutritional condition persisted at this stage, while larval diet also had a significant effect on larval growth, i.e., fed larvae were longer and wider compared to starved larvae (Figure6a–c). Larvae under low algal food concentration had disproportionately longer ciliated bands (Figure6d) in relation to maximum length and width (Figure6e,f). The influence of maternal effects on gut area was reduced, while the effect of larval nutrition was more pronounced at this stage (Figure6g).
Diversity 2017, 9, 15 11 of 18
[image:11.595.119.479.191.707.2]At 10 days after the onset of larval feeding ability, there was a significant interaction in the effects of maternal and larval diet on larval size (Table S4). Initial differences in larval size due to maternal nutritional condition persisted at this stage, while larval diet also had a significant effect on larval growth, i.e., fed larvae were longer and wider compared to starved larvae (Figure 6a–c). Larvae under low algal food concentration had disproportionately longer ciliated bands (Figure 6d) in relation to maximum length and width (Figure 6e,f). The influence of maternal effects on gut area was reduced, while the effect of larval nutrition was more pronounced at this stage (Figure 6g).
Figure 6. Morphometric measurements of larvae (± SD) at Day 10: (a) maximum length (ML), (b) maximum width (MW), (c) posterior width (PW), (d) ciliated band length (CBL), (e) ratio of CBL to
ML, (f)ratio of CBL to MW, and (g) gut area (GA). Different letters above bars indicate significant differences based on Tukey’s post hoc tests following two-way ANOVA.
10 15 20 25 30 35 4 5 6 7 8 9 2 3 4 5 6 10 20 30 40 50 200 250 300 350 400 300 350 400 450 500 550 600 600 650 700 750 800 850 MW ( μ m)
Hi Lo No Hi Lo No Hi Lo No Hi Lo No
ML ( μ m) a a b a a b a b c a a b PW ( μ m) C B
L x 10
2 (
μ m) C B L : M L ( μ m) C B L : M W ( μ m) GA x 1 0
3 (
μ
m
2)
Hi Lo No Hi Lo No Hi Lo No Hi Lo No
Hi Lo No Hi Lo No Hi Lo No Hi Lo No Hi Lo No Hi Lo No Hi Lo No Hi Lo No
Hi Lo No Hi Lo No Hi Lo No Hi Lo No
Hi Lo No Hi Lo No Hi Lo No Hi Lo No Hi Lo No Hi Lo No Hi Lo No Hi Lo No
Hi Lo No Hi Lo No Hi Lo No Hi Lo No
ACR MIX POR STV
ACR MIX POR STV
ACR MIX POR STV
ACR MIX POR STV
ACR MIX POR STV
ACR MIX POR STV
ACR MIX POR STV
(a)
(b)
(c)
(d)
(e)
(g)
(f)
a a b a a b a bc a a b
a b
c a
a
b a a
b a a,b b b a c b a c a a
b b a
c b a c b a b b a b b a c c a c b a b b a b b a c a b c a b c a b c a b c
Figure 6. Morphometric measurements of larvae (±SD) at Day 10: (a) maximum length (ML), (b) maximum width (MW), (c) posterior width (PW), (d) ciliated band length (CBL), (e) ratio ofCBL
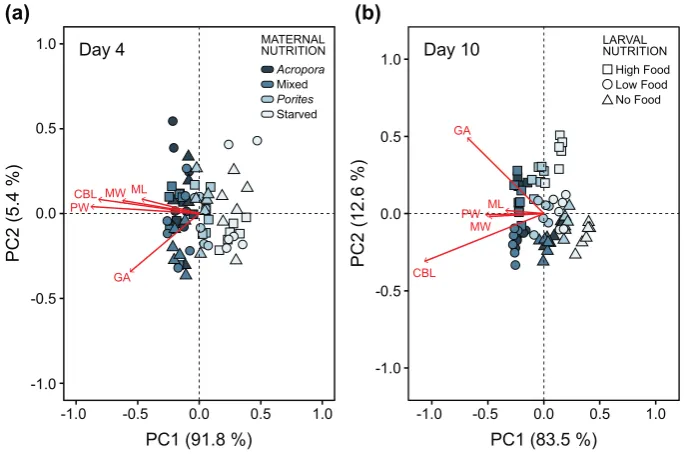
Consistent with individual measurements of morphological traits, maternal diet explained 66.2% of the variation in overall larval allometry at four days after the onset of larval feeding ability (Table S5). Larvae from females underAcroporaand mixed diets were generally longer and wider. At this stage, ciliated band length and gut area coincided with larval growth (i.e., increase in larval length and width), irrespective of changes in larval morphology (Figure7a).
At day 10, endogenous and exogenous nutrition explained 37.5% and 38.9% of the variation in larval morphology, respectively (Table S5). The effects of these factors were interactive and mostly driven by differences in ciliated band length and gut area (Figure7b). Ciliated bands were disproportionately longer in relation to maximum length and maximum width, which indicates phenotypic change in response to the concentration of algal food. Gut area also varied with algal food concentration, i.e., larvae under high food concentration treatments had larger stomachs compared to low food and starved treatments.
Diversity 2017, 9, 15 12 of 18
Consistent with individual measurements of morphological traits, maternal diet explained 66.2% of the variation in overall larval allometry at four days after the onset of larval feeding ability (Table 5S). Larvae from females under Acropora and mixed diets were generally longer and wider. At this stage, ciliated band length and gut area coincided with larval growth (i.e., increase in larval length and width), irrespective of changes in larval morphology (Figure 7a).
[image:12.595.126.469.260.487.2]At day 10, endogenous and exogenous nutrition explained 37.5% and 38.9% of the variation in larval morphology, respectively (Table 5S). The effects of these factors were interactive and mostly driven by differences in ciliated band length and gut area (Figure 7b). Ciliated bands were disproportionately longer in relation to maximum length and maximum width, which indicates phenotypic change in response to the concentration of algal food. Gut area also varied with algal food concentration, i.e., larvae under high food concentration treatments had larger stomachs compared to low food and starved treatments.
Figure 7. Principal component analysis (PCA) plot of morphological traits measured to analyze similarities in larval morphology at (a) four days and (b) ten days after the onset of feeding ability. Red vectors are morphometric measurements of maximum length (ML), maximum width (MW), posterior width (PW), ciliated band length (CBL), and gut area (GA). Maternal nutrition treatments are indicated by different colors and larval feeding treatments are indicated by symbols. Individual data points are average values from 10 replicate larvae per experimental bottle.
4. Discussion
This study shows that the inferred nutritional condition, and thereby the diet, of crown-of-thorns starfish has a significant and lasting effect on larval vitality. Notably, CoTS fed on either an exclusive diet of Acropora or a mixed diet in which Acropora represented ~33% of available prey produced larger gonads and oocytes, which were correlated with larval growth and morphology, as well as rates of larval survival, development, and competency. The influence of endogenous nutrition was most apparent in the earlier stages of development (i.e., bipinnaria stage) while the significance of exogenous nutrition was manifested in later stages (i.e., advanced bipinnaria to the brachiolaria stage). Our results suggest that the quantity and quality of coral food rations to female starfish differed sufficiently to affect reproductive investment in CoTS, as evidenced by significant variations in oocyte diameter and volume. This is consistent with a previous study by Caballes et al. [24], which showed that CoTS fed ad libitum with Acropora for two months during peak oogenesis produced significantly larger oocytes compared to oocytes from Porites-fed and starved females. Intraspecific
0.0 0.0
-0.5
-1.0 0.5 1.0
-0.5
-1.0 0.5 1.0
GA PWCBL MW ML
0.0 0.0
-0.5
-1.0 0.5 1.0
-0.5
-1.0 0.5 1.0
(a) (b)
MATERNAL NUTRITION Acropora Mixed Porites
LARVAL NUTRITION
High Food Low Food No Food Starved
Day 4 Day 10
PC1 (91.8 %)
PC2
(
5
.4
%
)
PC
2 (
12
.6
%)
PC1 (83.5 %)
GA
PW
CBL MW
ML
Figure 7. Principal component analysis (PCA) plot of morphological traits measured to analyze similarities in larval morphology at (a) four days and (b) ten days after the onset of feeding ability. Red vectors are morphometric measurements of maximum length (ML), maximum width (MW), posterior width (PW), ciliated band length (CBL), and gut area (GA). Maternal nutrition treatments are indicated by different colors and larval feeding treatments are indicated by symbols. Individual data points are average values from 10 replicate larvae per experimental bottle.
4. Discussion
oocyte size in many echinoderms is often mediated by differences in food quality and quantity [46]. Within species, larger oocytes are generally associated with specimens collected from field sites with abundant food and with animals under high food treatments in laboratory studies [18,46,47]. Using the gonad index and oocyte size as an index for maternal investment, the present study demonstrates that maternal effects persist through to later stages of development and affect how larvae respond to varying conditions of food availability in the external environment.
Neither endogenous provisioning to the egg or exogenous food availability influenced initial larval survival (all above 85% at day 4), but larvae from fed adults, regardless of diet, generally showed faster growth and development compared to those from starved adults. This suggests that early larval success is significantly influenced by maternal condition. The influence of adult diet and nutritional condition on initial growth and development has been previously shown for CoTS [24] and other echinoderms [19,46,48,49]. After the digestive tract differentiates (usually two days after fertilization), CoTS larvae enter a facultative feeding period where they are capable of feeding, but do not necessarily require food for growth and development due to existing maternal reserves [17]. Starved larvae have been shown to survive for long periods and develop all the way to early brachiolaria [20,24]. The onset of the ability to feed occurs at around the same stage across several species with planktotrophic larvae, but the onset of the need to feed and the duration of the facultative feeding period vary dramatically according to oocyte size and quality [50], and hence maternal diet. In the present study, the influence of maternal effects on survival and development remained strong at eight days after the onset of the ability to feed. This stage is normally the transition phase from bipinnaria to brachiolaria larval form. Continued development at this stage suggests that maternal reserves can buffer the effects of low food availability or starvation. Rate of survival, normal development, and larval progression was higher in larvae from coral-fed adults (Acropora, mixed,Poritesdiet) compared to starved treatments. Moreover, the proportion of larvae that progressed to the brachiolaria stage was higher in starfish on Acroporaand mixed diet compared toPorites-fed treatments. Differences in the inferred nutritional condition between adult starfish onAcroporaand mixed diet versusPorites-fed females was most likely influenced by variable consumption rates between coral species. In the present study, estimated coral consumption was higher forAcropora intermediaandPocillopora damicorniscompared toPorites cylindrica. Similarly, when coral food was rationedad libitumto CoTS for 60 days, consumption rates ofAcropora abrotanoideswere significantly higher compared toPorites rus[24]. Efficiency in feeding and digestion was significantly higher on acroporid and pocilloporid corals compared to poritids [51]. This is in accordance with CoTS feeding preferences observed in the field and in controlled laboratory assays, where the frequency of predation and predation rates onPoriteswas consistently lower compared to AcroporaandPocilloporacorals (reviewed by Pratchett et al. [3]). General models of optimal diet theory would predict that CoTS would prefer to feed on corals with the highest nutritional value to maximize energetic return [27]. Nutritional analyses of corals showed that the energetic and protein contents of acroporid and pocilloporid corals were marginally higher compared to poritids [51].
allows reproductively mature females to allocate energetic and structural resources directly towards the oocyte and indirectly to the juvenile (e.g., in the forcipulate starfish, Pisaster ochraceous [47]). Maternal provisioning of surplus nutritional reserves to the oocyte may allow larvae to withstand prolonged periods of starvation [54] and produce larger larvae with structures that improve feeding efficiency in food-limited environments [32].
Larvae from starved females were shorter, narrower, and had smaller stomachs compared to those from fed starfish, while female CoTS onAcroporaand mixed diets produced bigger larvae with larger gut areas compared toPorites-fed treatments. At this stage, ciliated band length was proportional to overall larval size. In a previous study, Caballes et al. [24] reported that four-day old larvae from CoTS fed withAcroporaorPoriteswere bigger in terms of length, width and stomach area compared to those from starved starfish. Divergence in initial larval size and form was mainly driven by maternal diet treatments. The influence of exogenous nutrients is negligible at this stage (4 days after the onset of the ability of larvae to feed) due to available maternal reserves. While maternal provisions were still present, Byrne et al. [19] did not observe a significant size difference between fed and unfed larvae of the echinoid,Tripneustus gratilla.
The onset of phenotypic response of larvae comes in later, influenced by the synergistic effects of endogenous and exogenous nutrition. Initial differences in larval size and development rate influenced by endogenous maternal reserves were carried over to later stages. Continuous supply of high concentrations of algal food for 16 days did not compensate for initial deficiencies of larvae from starved andPorites-fed females. Likewise, growth in larvae from starfish onAcroporaand mixed diets was stunted in the absence of particulate food. Supplemental storage lipids from maternal provisions may be important in allocating resources for larval growth and for building larval feeding structures. Exceptionally high feeding rates on a lipid-rich food source such as hermatypic corals [55–57] uniquely predisposes CoTS to increased maternal reserves. Lipid levels in corals are higher than most marine invertebrates [58]. Maternally derived energetic lipids, particularly triglycerides, fuel early development in echinoderms [52]. Moreover, elevated levels of lipids during egg production in corals [59] coincides with oogenesis in CoTS in the GBR, hence an increase in the amount of lipids in CoTS diet prior to spawning. Although the proportion of triglycerides inA. intermedia[60],P. damicornis and P. cylindrica[57] were almost identical, variable consumption rates on these species could drive differences in maternal provisioning. Byrne et al. [19] suggest that the presence of triglycerides later in development may be a bet-hedging strategy to maintain a buffer against uncertain food supply for larvae. Our results support this proposed strategy, i.e., the degree of allometric elongation of ciliated bands in relation to larval size was more pronounced among larvae from starfish onAcroporaand mixed diets compared to larvae from starfish under poor maternal nutritive conditions.
Enhancement of feeding capacity is set by the total length of the ciliated band, which requires complementary increases in body size or changes in larval shape to maximize the length of ciliated bands [29,30]. George [31,49] demonstrated that the bipinnaria larvae of asteroids are capable of changing the size of their feeding structures in response to the amount of available algal food. For CoTS larvae, allometric growth of the ciliated band relative to body size can be achieved by increasing the length and width of the larval body coupled with allometric development of bigger oral and gut hoods. Larval CoTS in starved and low food condition had longer ciliated bands relative to body size [32]. Few studies have proposed reliable cues that stimulate these changes in the size of larval feeding structures. Shilling [61] found that echinoderms respond morphologically to organic compounds in the environment that may indicate the availability of dissolved and particulate nutrients. Larvae may also respond morphologically upon detection of chemical and physical cues from algal cells [62].
planktonic predators [63] and by reducing the probability of advective loss from adult habitat [64]. The ability of larvae from well-fed females to modify feeding structures in response to oligotrophic conditions, which is typical for reef waters, may help explain reported outbreaks in locations where the likelihood of elevated phytoplankton levels induced by terrestrial runoff is low [26,65–67].
5. Conclusions
Maternal diet had strong effects on larval survival, development, and growth at the earlier stages. Ciliated band length was proportional to larval growth at this stage. The effect of exogenous diet becomes more pronounced at the later stages, presumably when maternal provisions have been exhausted. Under low algal food conditions, larvae compensate by increasing the length of ciliated feeding bands in relation to larval size, which improves food capture and feeding efficiency. However, the effects of endogenous nutrition persist through to the later stages of larval development, as larvae from starved females did not possess supplemental maternal reserves to develop longer ciliated bands in response to low-food conditions. Resilience of CoTS larvae from starvation and food-limiting conditions is influenced, in part, by the availability of surplus maternal reserves in the earlier stages of development and then later through compensatory morphological plasticity to improve the efficiency of food capture. Although acquisition of particulate food may still be necessary to fuel larval growth for successful metamorphosis, initial advantages or deficiencies in larval survival, growth, and development are carried over in later stages. Phenotypic plasticity influenced by endogenous provisions and in response to exogenous food availability may be an important strategy in boosting the reproductive success of CoTS, leading to population outbreaks.
Supplementary Materials:The following are available online athttp://www.mdpi.com/1424-2818/9/1/15/s1, Tables S1–S5. Table S1: Results of mixed model hierarchical ANOVA for diameter and volume of oocytes from female starfish under four maternal diet treatments: Acr =Acropora, Mix = mixed diet, Por =Porites, Stv = starved. Table S2: Analysis of deviance for binomial generalized linear models (GLMs) testing the effects of maternal nutrition and larval feeding treatments on the proportion of normally developing larvae and larvae at brachiolaria stage after 8 days and normally developing and larvae at mid-to-late brachiolaria after 16 days. Maternal Diet: Acr =Acropora, Mix = mixed diet, Por =Porites, Stv = starved; Algal Food Concentration (cells·mL−1): Hi = 104,
Lo = 103, No = 0. Table S3: Results of two-way ANOVA testing the main and interactive effects of maternal nutrition and larval feeding treatments on different morphometric measurements taken 4 days after the onset of larval feeding. Maternal Diet: Acr =Acropora, Mix = mixed diet, Por =Porites, Stv = starved; Algal Food Concentration (cells·mL−1): Hi = 104, Lo = 103, No = 0. Table S4: Results of two-way ANOVA testing the main
and interactive effects of maternal nutrition (Acr =Acropora, Mix = mixed diet, Por =Porites, Stv = starved) and larval feeding (Hi = 104, Lo = 103, No = 0 cells·mL−1) treatments on different morphometric measurements
taken at day 10 after onset of larval feeding ability. Table S5: Results of permutational multivariate ANOVA (PERMANOVA) testing the main and interactive effects of maternal diet and larval feeding treatments on larval morphology. Maternal Diet: Acr =Acropora, Mix = mixed diet, Por =Porites, Stv = starved; Algal Food Concentration (cells·mL−1): Hi = 104, Lo = 103, No = 0.
Acknowledgments: Funding for this study was provided by the Ian Potter Foundation 50th Anniversary Commemorative Crown-of-Thorns Starfish Research Grant to M.S.P. and C.F.C., and the Australian Research Council Centre of Excellence for Coral Reef Studies annual research funding to M.S.P. and PhD research allocation to C.F.C. We thank Andrew Hoey, Vanessa Messmer, Arun Oakley-Cogan, Alexia Graba-Landry, and Zara-Louise Cowan for field and laboratory assistance. We also acknowledge Maia Raymundo and Chao-yang Kuo for assistance in preparing the manuscript, Maria Byrne and Symon Dworjanyn for technical advice, and Lyle Vail, Anne Hoggett and the staff at the Australian Museum’s Lizard Island Research Station for logistical support. Comments from two anonymous reviewers significantly improved this manuscript.
Author Contributions: C.F.C. and M.S.P. conceived and designed the experiments; C.F.C., M.S.P., A.C.E.B. performed the experiments; C.F.C. and A.C.E.B. analyzed the data; M.S.P. contributed reagents/materials/analysis tools; C.F.C and M.S.P. wrote the paper.
References
1. Bellwood, D.R.; Hughes, T.P.; Folke, C.; Nyström, M. Confronting the coral reef crisis. Nature2004,429, 827–833. [CrossRef] [PubMed]
2. Hughes, T.P.; Graham, N.A.J.; Jackson, J.B.C.; Mumby, P.J.; Steneck, R.S. Rising to the challenge of sustaining coral reef resilience.Trends Ecol. Evol.2010,25, 633–642. [CrossRef] [PubMed]
3. Pratchett, M.S.; Caballes, C.F.; Rivera-Posada, J.A.; Sweatman, H.P.A. Limits to understanding and managing outbreaks of crown-of-thorns starfish (Acanthasterspp.).Oceanogr. Mar. Biol. Annu. Rev.2014,52, 133–200. 4. Westcott, D.A.; Fletcher, C.S.; Babcock, R.C.; Plaganyi-Lloyd, E. A Strategy to Link Research and
Management of Crown-of-Thorns Starfish on the Great Barrier Reef: An Integrated Pest Management Approach; National Environment Science Programme: Cairns, Australia, 2016.
5. Hoey, J.; Campbell, M.; Hewitt, C.; Gould, B.; Bird, R.Acanthaster planciinvasions: Applying biosecurity practices to manage a native boom and bust coral pest in Australia.Manag. Biol. Invasions2016,7, 213–220. [CrossRef]
6. Moore, R.J. Persistent and transient populations of the crown-of-thorns starfish,Acanthaster planci. Lect. Notes Biomath.1990,88, 236–277.
7. Babcock, R.C.; Milton, D.A.; Pratchett, M.S. Relationships between size and reproductive output in the crown-of-thorns starfish.Mar. Biol.2016,163, 234. [CrossRef]
8. Uthicke, S.; Schaffelke, B.; Byrne, M. A boom–bust phylum? Ecological and evolutionary consequences of density variations in echinoderms.Ecol. Monogr.2009,79, 3–24. [CrossRef]
9. Pratchett, M.S. Dynamics of an outbreak population ofAcanthaster planciat Lizard Island, northern Great Barrier Reef (1995–1999).Coral Reefs2005,24, 453–462. [CrossRef]
10. Brodie, J.E.; Fabricius, K.E.; De’ath, G.; Okaji, K. Are increased nutrient inputs responsible for more outbreaks of crown-of-thorns starfish? An appraisal of the evidence.Mar. Pollut. Bull.2005,51, 266–278. [CrossRef] [PubMed]
11. Wooldridge, S.A.; Brodie, J.E. Environmental triggers for primary outbreaks of crown-of-thorns starfish on the Great Barrier Reef, Australia.Mar. Pollut. Bull.2015,101, 805–815. [CrossRef] [PubMed]
12. Houk, P.; Raubani, J.Acanthaster plancioutbreaks in Vanuatu coincide with ocean productivity, furthering trends throughout the Pacific Ocean.J. Oceanogr.2010,66, 435–438. [CrossRef]
13. Houk, P. The transition zone chlorophyll front can triggerAcanthaster plancioutbreaks in the Pacific Ocean: Historical confirmation.J. Oceanogr.2007,63, 149–154. [CrossRef]
14. Fabricius, K.E.; Okaji, K.; De’ath, G. Three lines of evidence to link outbreaks of the crown-of-thorns seastar
Acanthaster plancito the release of larval food limitation.Coral Reefs2010,29, 593–605. [CrossRef]
15. Wolfe, K.; Graba-Landry, A.; Dworjanyn, S.A.; Byrne, M. Larval starvation to satiation: Influence of nutrient regime on the success ofAcanthaster planci.PLoS ONE2015,10, 1–18. [CrossRef] [PubMed]
16. Pratchett, M.S.; Dworjanyn, S.; Mos, B.; Caballes, C.F.; Thompson, C.; Blowes, S. Larval survivorship and settlement of crown-of-thorns starfish (Acanthastercf.solaris) at varying algal cell densities.Diversity2017,9, 2. [CrossRef]
17. McEdward, L.R. Reproductive strategies of marine benthic invertebrates revisited: Facultative feeding by planktotrophic larvae.Am. Nat.1997,150, 48–72. [CrossRef] [PubMed]
18. Bertram, D.F.; Strathmann, R.R. Effects of maternal and larval nutrition on growth and form of planktotrophic larve.
Ecology1998,79, 315–327. [CrossRef]
19. Byrne, M.; Sewell, M.A.; Prowse, T.A.A. Nutritional ecology of sea urchin larvae: Influence of endogenous and exogenous nutrition on echinopluteal growth and phenotypic plasticity inTripneustes gratilla.Funct. Ecol. 2008,22, 643–648. [CrossRef]
20. Lucas, J.S. Quantitative studies of feeding and nutrition during larval development of the coral reef asteroid
Acanthaster planci(L.).J. Exp. Mar. Biol. Ecol.1982,65, 173–193. [CrossRef]
21. Okaji, K.; Ayukai, T.; Lucas, J.S. Selective feeding by larvae of the crown-of-thorns starfish,Acanthaster planci(L.).
Coral Reefs1997,16, 47–50. [CrossRef]
23. Birkeland, C. Terrestrial runoff as a cause of outbreaks ofAcanthaster planci(Echinodermata: Asteroidea).
Mar. Biol.1982,69, 175–185. [CrossRef]
24. Caballes, C.F.; Pratchett, M.S.; Kerr, A.M.; Rivera-Posada, J.A. The role of maternal nutrition on oocyte size and quality, with respect to early larval development in the coral-eating starfish,Acanthaster planci.
PLoS ONE2016,11, e0158007. [CrossRef] [PubMed]
25. Lucas, J.S. Growth, maturation and effects of diet inAcanthaster planci(L.) (Asteroidea) and hybrids reared in the laboratory.J. Exp. Mar. Biol. Ecol.1984,79, 129–147. [CrossRef]
26. Kayal, M.; Vercelloni, J.; Lison de Loma, T.; Bosserelle, P.; Chancerelle, Y.; Geoffroy, S.; Stievenart, C.; Michonneau, F.; Penin, L.; Planes, S.; et al. Predator crown-of-thorns starfish (Acanthaster planci) outbreak, mass mortality of corals, and cascading effects on reef fish and benthic communities.PLoS ONE2012,7, e47363. [CrossRef] [PubMed]
27. Ormond, R.F.G.; Hanscomb, N.J.; Beach, D.H. Food selection and learning in the crown-of-thorns starfish,
Acanthaster planci(L.).Mar. Behav. Physiol.1976,4, 93–105. [CrossRef]
28. Revelante, N.; Gilmartin, M. Dynamics of phytoplankton in the Great Barrier Reef lagoon.J. Plankton Res. 1982,4, 47–76. [CrossRef]
29. McEdward, L.R. Comparative morphometrics of echinoderm larvae. II. Larval size, shape, growth, and the scaling of feeding and metabolism in echinoplutei.J. Exp. Mar. Biol. Ecol.1986,96, 267–286. [CrossRef] 30. Hart, M.W.; Strathmann, R.R. Functional consequences of phenotypic plasticity in echinoid larvae.Biol. Bull.
1994,186, 291–299. [CrossRef]
31. George, S.B. Phenotypic plasticity in the larvae of Luidia foliolata (Echinodermata: Asteroidea). InEchinoderms Through Time; David, B., Guille, A., Féral, J.-P., Roux, M., Eds.; August AiméBalkema: Rotterdam, The Netherlands, 1994; p. 20.
32. Wolfe, K.; Graba-Landry, A.; Dworjanyn, S.A.; Byrne, M. Larval phenotypic plasticity in the boom-and-bust crown-of-thorns seastar,Acanthaster planci.Mar. Ecol. Prog. Ser.2015,539, 179–189. [CrossRef]
33. Caballes, C.F.; Pratchett, M.S. Reproductive biology and early life history of the crown-of-thorns starfish. InEchinoderms: Ecology, Habitats and Reproductive Biology; Whitmore, E., Ed.; Nova Science Publishers, Inc.: New York, NY, USA, 2014; pp. 101–146.
34. Pratchett, M.S. Influence of coral symbionts on feeding preferences of crown-of thorns starfishAcanthaster planciin the western Pacific.Mar. Ecol. Prog. Ser.2001,214, 111–119. [CrossRef]
35. Lucas, J.S. Reproductive and larval biology ofAcanthaster planci(L.) in Great Barrier Reef Waters.Micronesica 1973,9, 197–203.
36. Conand, C. Distribution, reproductive cycle and morphometric relationships of Acanthaster planci
(Echinodermata: Asteroidea) in New Caledonia, western tropical Pacific. In Proceedings of the 5th International Echinoderm Conference, Galway, Ireland, 24–29 September 1984; pp. 499–506.
37. Schneider, C.A.; Rasband, W.S.; Eliceiri, K.W. NIH Image to ImageJ: 25 years of image analysis.Nat. Methods 2012,9, 671–675. [CrossRef] [PubMed]
38. Devlin, M.J.; DeBose, J.L.; Ajani, P.; Teixeira da Silva, E.; Petus, C.; Brodie, J.E. Phytoplankton in the Great Barrier Reef: Microscopy analysis of community structure in high flow events. InReport to the National Environmental Research Program; Reef and Rainforest Research Centre Limited: Cairns, Australia, 2013; p. 68. 39. Yamaguchi, M. Early life histories of coral reef asteroids, with special reference toAcanthaster planci(L.). InBiology and Geology of Coral Reefs; Jones, O.A., Endean, R., Eds.; Academic Press, Inc.: New York, NY, USA, 1973; Volume 2, pp. 369–387.
40. Byrne, M.; Barker, M.F. Embryogenesis and larval development of the asteroidPatiriella regularisviewed by light and scanning electron microscopy.Biol. Bull.1991,180, 332–345. [CrossRef]
41. R Core Team.R: A Language and Environment for Statistical Computing; R Foundation for Statistical Computing: Vienna, Austria, 2016; Available online:http://www.R-project.org/(accessed on 28 February 2017). 42. Agresti, A.Introduction to Categorical Data Analysis; John Wiley & Sons Ltd.: New York, NY, USA, 1996. 43. Quinn, G.P.; Keough, M.J.Experimental Design and Data Analysis for Biologists; Cambridge University Press:
New York, NY, USA, 2002.
44. Benjamini, Y.; Hochberg, Y. Controlling the false discovery rate: A practical and powerful approach to multiple testing.J. R. Stat. Soc. Ser. B1995,57, 289–300.
46. George, S.B. Echinoderm egg and larval quality as a function of adult nutritional state.Oceanol. Acta1996,
19, 297–308.
47. George, S.B. Population differences in maternal size and offspring quality forLeptasterias epichlora(Brandt) (Echinodermata: Asteroidea).J. Exp. Mar. Biol. Ecol.1994,175, 121–131. [CrossRef]
48. De Jong-Westman, M.; Qian, P.-Y.; March, B.E.; Carefoot, T.H. Artificial diets in sea urchin culture: Effects of dietary protein level and other additives on egg quality, larval morphometrics, and larval survival in the green sea urchin,Strongylocentrotus droebachiensis.Can. J. Zool.1995,73, 2080–2090. [CrossRef]
49. George, S.B. Egg quality, larval growth and phenotypic plasticity in a forcipulate seastar. J. Exp. Mar. Biol. Ecol.1999,237, 203–224. [CrossRef]
50. Herrera, J.C.; McWeeney, S.K.; McEdward, L.R. Diversity of energetic strategies among echinoid larvae and the transition from feeding to nonfeeding development.Oceanol. Acta1996,19, 313–321.
51. Keesing, J.K. Feeding Biology of the Crown-of-Thorns Starfish,Acanthaster planci(Linnaeus). Ph.D. Thesis, James Cook University, Townsville, Australia, 1990.
52. Prowse, T.A.A.; Sewell, M.A.; Byrne, M. Fuels for development: Evolution of maternal provisioning in asterinid sea stars.Mar. Biol.2008,153, 337–349. [CrossRef]
53. Stimson, J.S. Location, quantity and rate of change in quantity of lipids in tissue of Hawaiian hermatypic corals.
Bull. Mar. Sci.1987,41, 889–904.
54. George, S.B.; Cellario, C.; Fenaux, L. Population differences in egg quality ofArbacia lixula(Echinodermata: Echinoidea): Proximate composition of eggs and larval development. J. Exp. Mar. Biol. Ecol. 1990,141, 107–118. [CrossRef]
55. Patton, J.S.; Battey, J.F.; Rigler, M.W.; Porter, J.W.; Black, C.C.; Burris, J.E. A comparison of the metabolism of bicarbonate14C and acetate 1-14C and the variability of species lipid compositions in reef corals.Mar. Biol. 1983,75, 121–130. [CrossRef]
56. Harland, A.D.; Navarro, J.C.; Spencer Davies, P.; Fixter, L.M. Lipids of some Caribbean and Red Sea corals: total lipid, wax esters, triglycerides and fatty acids.Mar. Biol.1993,117, 113–117. [CrossRef]
57. Yamashiro, H.; Oku, H.; Higa, H.; Chinen, I.; Sakai, K. Composition of lipids, fatty acids and sterols in Okinawan corals.Comp. Biochem. Physiol. Part B Biochem. Mol. Biol.1999,122, 397–407. [CrossRef]
58. Giese, A.C. Lipids in the economy of marine invertebrates.Physiol. Rev.1966,46, 244–298. [PubMed] 59. Arai, I.; Kato, M.; Heyward, A.; Ikeda, Y.; Iizuka, T.; Maruyama, T. Lipid composition of positively buoyant
eggs of reef building corals.Coral Reefs1993,12, 71–75. [CrossRef]
60. Imbs, A.B.; Yakovleva, I.M. Dynamics of lipid and fatty acid composition of shallow-water corals under thermal stress: an experimental approach.Coral Reefs2012,31, 41–53. [CrossRef]
61. Shilling, F.M. Morphological and physiological responses of echinoderm larvae to nutritive signals.Am. Zool. 1995,35, 399–411. [CrossRef]
62. Miner, B.G. Larval feeding structure plasticity during pre-feeding stages of echinoids: Not all species respond to the same cues.J. Exp. Mar. Biol. Ecol.2007,343, 158–165. [CrossRef]
63. Sinervo, B.; McEdward, L.R. Developmental consequences of an evolutionary change in egg size: An experimental test.Evolution1988,42, 885. [CrossRef]
64. Strathmann, R.R. Length of pelagic period in echinoderms with feeding larvae from the Northeast Pacific.
J. Exp. Mar. Biol. Ecol.1978,34, 23–27. [CrossRef]
65. Lane, D.J.W.Acanthaster planciimpact on coral communities at permanent transect sites on Bruneian reefs, with a regional overview and a critique on outbreak causes.J. Mar. Biol. Assoc. UK2011,92, 803–809. [CrossRef] 66. Roche, R.C.; Pratchett, M.S.; Carr, P.; Turner, J.R.; Wagner, D.; Head, C.; Sheppard, C.R.C. Localized outbreaks
ofAcanthaster planciat an isolated and unpopulated reef atoll in the Chagos Archipelago.Mar. Biol.2015,
162, 1695–1704. [CrossRef]
67. Suzuki, G.; Yasuda, N.; Ikehara, K.; Fukuoka, K.; Kameda, T.; Kai, S.; Nagai, S.; Watanabe, A.; Nakamura, T.; Kitazawa, S.; et al. Detection of a high-density brachiolaria-stage larval population of crown-of-thorns sea star (Acanthaster planci) in Sekisei Lagoon (Okinawa, Japan).Diversity2016,8, 9. [CrossRef]